Engineering, 2013, 5, 450-454
http://dx.doi.org/10.4236/eng.2013.510B092 Published Online October 2013 (http://www.scirp.org/journal/eng)
Copyright © 2013 SciRes. ENG
Monitoring the Radiation Injury of Red Blood Cells to
Micowave Radiati on with Di fferent Power D ensity
Junguang Yong1, Ping Ruan1, Hongtao Shen2
1Guangdong Pharmaceutical University, Guangzhou, China
2College of Physics and Technology, Guangxi Normal University, Guilin, China
Email: Rp711@sina . c om, shenht@ciae.ac.cn
Received 2013
ABSTRACT
Multiple state-of-the-art techniques, such as multi-dimensional micro-imaging, fast multi-channel micro-spetrophoto-
metry, and dynamic micro-imaging ana lysis, were used to dynamically investigate v arious effects of cell under the 900
MHz electromagnetic radiation. Cell changes in shape, size under different power density electromagnetic wave s radi a-
tion were presented in this paper. Experimental r esults indicated that the isolated human red blood cells (RBCs) do not
have obviously real-time responses to the ultra-low density (15 μW/cm2, 31 μW/cm2) electromagnetic wave radiation
when the radiation time is not more than 30 minutes; however, the cells do have significant reactions in shape, size to
the electromagnetic waves radiation with power densities of 1 mW/cm2 and 5 mW/cm2. The data reveals the possible
influences and statistical relationships among living human cell functions, radiation amount and exposure time with
high-frequency electromagnetic waves. The results of this study may be significant on protection of human being and
other living organisms against possible rad iation aff e ctions of the high-frequency electromagnetic waves.
Keywords: Biomedical Measurement; RBCs; Electromagnetic (EM) Waves; Power Density
1. Introduction
As the modern electronics products become more and
more popular, radiations from various appliances, such as
consumer electronics, automated office equipment, high
voltage transport lines, power stations etc., begin to be a
serious human exposure issue with potential health con-
sequences. These radiation waves can possibly penetrate
various substances including human body cells and has
become the fourth biggest pollution source subsequent to
water contamination, air and noise pollutions. So far, there
are a lot of investigations on biological responses to the
EM (Electromagnetic) radiation. There is a wide range of
data documenting the ability of EM radiation to affect the
biochemical and molecular mechanisms of cells both in
vitro and in vivo with effects independent of thermal
phenomena such as, altered cell growth [1], exocytosis
[2], gene expression [3], chromosomal instability [4] and
the expression of heat shock proteins [5,6]. The effects of
EM radiations on human body are generally accepted.
[7,8].
However, there are only scattered studies dealing with
the influences of EM waves on RBCs geometric charac-
teristics. In most previou s studies the effects were gener-
ally measured after a relatively long period of radiation
due to the limitations of experimental conditions. Due to
the self-repairing process, however, the changes in cells
may be recovered or distorted in the delayed observations.
Hence, real-time research and measurements of EM wav es
radiation effects on cells should be carried out. In this
work, the influences of EM radiation on live red cells
geometric char acteristics were studied with different pow-
er densit i e s a nd different radiation time intervals.
2. Materials and Methods
1) Technology and Methods
The imaging and analysis system used in this research
has multiple functions of multi-dimensional micro-im-
aging, fast multi-channel micro-spetrophotometry, and
dynamic micro-imaging. It is able to measure multiple
structures and parameters of live cells simultaneously
and monitor the changes of molecule structures and sub-
stance concentration. The whole system, shown in Fig-
ure 1, is based on an inverted microscope (Nikon TE300,
Tokyo, Japan). The prepared samples were mounted un-
der the microscope, and a halogen lamp is used to pro-
duce light beams which go through the adjustable optics
pinhole 1 and then focused onto the samples. The aper-
ture of the optical pinhole can be adjusted in the rang e of
1 μm ~ 200 μm. The transmitted light from the samples
penetrates an objective lens and a transflective lens, and
J. G. YONG ET AL.
Copyright © 2013 SciRes. ENG
451
Figure 1. Experimental equipment.
goes through the image analytical system of microscopic
organisms. A CCD (Charge-Coupled Device) camera
(IMAC-CCDS30 768 × 572, Tokyo, Japan) and an image
capturing card (MATROX-METEOR PCI, Dorval,
Canada) are used to capture the microscopic images and
send them to the system host (Lenovo ThinkStation D20,
Beijing, China) for real-time image processing, analysis,
storage and display.
The analytic system of microscopic images can cap-
ture the microscopic images of the RBCs and then auto-
matically recognize and count the cells [9]. It also can
give out quantitative information of single cell in shape,
size and other characteristics. The image analysis in-
cludes capturing and buffering the selected cells images,
binary conversion of the images with suitable thresholds,
cell edge detection and separation. The analysis process
also includes space location, measurement calibration,
and calculation of cell contact area, perimeter, long axis,
short axis, long-short axis ratio, normalized factors of
shape and other mechanical parameters. Among these va-
lues, the long axis and short axis values are one dimen-
sional, which represent the cell deformation; the contact
area and perimeters are two dimensional, which repre-
sent the cell size. The normalized factors, between 0 ~ 1,
are geometric characteristics of RBCs.
2) EM Wave Exposure
The EM waves are radiated by a pillar antenna located
outside of the plastic incubator. In our early experiments
[10,11], we have been using the same setup as exposure
devices for getting the different power densities. The EM
signal is generated by a EM wave generator VS-401A
(Verition, Shenzheng,China) and firstly amplified by a
linear Power Amplifier [Model PF0342A ] before it is fe d
to the pillar antenna. The generator operates in the 900
MHz f req uen cy ( GSM standing waves, adopted by China
Mobile,) with the frequency stability ±0.05%. The max-
imum output power of the generator is about 10 mW/ c m2.
A PMM-8053 EM analyzer combined with a PMM-
EP300 probe (PPM, Segrate, Italy) was used to monitor
the power density and electric field strength of EM waves
around the sample. The signal source output level can be
adjusted through modifying the distance between antenna
and cell pools. Four levels of power densities, two of
which (15 μW/cm2, 31 μW/cm2) corresponding to the
radiation power of mobile phones and the other two (1
mW/ cm2, 5 mW/cm2) cor responding to mobile phone sta-
tions, microwave oven production lines as well as airport
radar stations could be obtained by this method. Consid-
ering the cell pools are very small (5 mm × 5 mm) with
the distance from the signal source, the EM fields in the
cell poolsare considered to be uniform. Absorbed power
was calculated by an Ansoft HFSS simulation code. Us-
ing this method of calculation, an average incident power
of 1.25 mW (5 mW/cm2) resulted in 0.26 mW of absorb-
ed power. Thus approximately 21 percent of the incident
power was absorbed by the sample. The 0.26 mW of ab-
sorbed power produced an average specific absorption
rate (SAR) of 2.08 W/Kg, since the volume of the sample
cell was 0.125 cc. By this method, the SARs for the four
levels of power densities 15 μW/cm2, 31 μW/cm2, 1
mW/ cm2 and 5 mW/cm2 are 6.24 mW/kg, 12.90 mW/kg,
0.42 W/kg and 2.08 W/kg. All exposures were controlled
with the assistance of a computer system and all expo-
sure data, such as input power level of the antenna and
the temperature inside exposure incubator (maintained at
37˚C with the stability ±0.1˚C) were checked every sec-
ond to confirm that exposure conditions in the incubator
were achieved as scheduled. The temperature time course
was measured in preliminary tests by means of a fiber
optic thermometer (Geokon BGK-FBG-4700, Beijing,
China). Measured data showed that there is no increase
of temperature observed at 5 mW/cm2, 15 μW/cm2, 31
μW/cm2 and 1 mW/cm 2.
3) Preparation of Hu man Red Cell S amp le s
A pipe of intravenous blood was sampled from a healthy
adult volunteer (who had signed a contract according the
local law) after a medical examination. After adding par-
naparin sodium (anticoagulants), the sample was centri-
fugalized at a speed of 2000 rpm (revolutions per minute)
for 10 minutes. The white cells and blood platelet in the
upper layer were then removed. The remaining red cell
solution was washed by 10 times of iso-osmotic PBS li-
quid in volume, and centrifugalized [12]. Three addition-
al cycles of washing-centrifugation are needed for clean-
ing the cells. The cleaned cells were then put into gluco-
sans liquids for further centrifugation. The density (g/g)
of the glucosans liquids should be 23%, 22%, 21%, 20%,
19%, respectively in the following centrifugations. Each
centrifugation is in a speed of 3000 rpm (1198 g-force)
for 40 minutes. By this way, “Young Red Cells” at top of
the sample can be obtained and then put into iso-osmotic
J. G. YONG ET AL.
Copyright © 2013 SciRes. ENG
452
PBS liquid with the ratio1:8000 in volume [13]. In the
subsequent measurement, the sample liquid was trans-
ferred onto the glass slides and put into a micro cell pools
after the temperature reaches the preset value of 37˚C.
The temperature was kept at 37˚C during all the mea-
surements.
4) Experimental
RBCs were continuously monitored and measured be-
fore, in the course of, and after radiation, respectively, in
the following two experiments.
a) RBC samples were irradiated by 900 MHz EM
waves with power densities of 15 μW/cm2 (SAR 6.24
mW/ kg ), 31 μW/cm2 (SAR 12.90 mW/kg ), 1 mW/cm2
(SAR 0.42 W/kg) and 5 mW/cm2 (SAR 2.08 W/kg), re-
spectively, for 30 minutes each. The contact area, peri-
meter, long-short axis ratio, and normalized factors (a
parameter describe the stiffness and deformability of
cells in the software) of real-time geometric shaping for
the cells were then measured with microscopic imaging
and analysis. A bout 80 cells were measured for each sam-
ple in two seconds.
b) Th e EM w ave with 900 MHz 5 mW/ cm 2 (SAR 2.08
W/kg) was used to irradiate the RBCs for 60 minutes,
and the measurements were performed at the beginning,
the tenth, the 20th and the 30th minute of irradiation and
the 30th, the 60th minute after radiation, respectively. The
parameters determined include contact area, perimeter,
long-short axis ratio and normalized factors, etc. About
80 cells were measured for each sample in two seconds.
5) Statistical Analysis l
Cell changes in shape, size and parameters of Hb ab-
sorption spectrum under different power density elec-
tromagnetic waves radiation were measured. For estima-
tion of the effect in each independent group, the averaged
parameter was first calculated; the error of these calcula-
tions was less than 10%. Student’s t-test was used to
compare different group of data. For statistical analysis
we used the data obtained from different cells; the num-
ber of cells is about 80. The level of statistical signific-
ance was basically set at 5%. For statistical analysis,
SPSS software (ver11.0, IBM, Chicago, USA) was em-
ployed.
3. Results and Discussion
As can be seen from Table 1, the geometric characteris-
tics of the tested RBCs had no significant changes (P >
0.05) after 30 minutes radiation of the ultra-low power
irradiation (15 μW/cm2, 31 μW/cm2) However, after 30
minute irradiation with power densities of 1mW/cm2 and
5 mW/cm2, the size and the long to short axis ratio of
RBCs decreased, and the normalized f actors of RBCs in-
creased (P < 0.05). Part of RBCs was changed from dou-
ble concaves to acanthocytes. As power density increases,
the aggregation of red cells increases accordingly.
Real-time reactions of live RBCs to 900 MHz EM
wave with 5 mW/cm2 power density are show n in Table
2, where the measurements were performed at different
times in the course of and after radiation, respectively.
As the radiation time increases, the contact area and pe-
rimeter of red cells become smaller while the long to
short axis ratio and the normalized factors become larger
compared to the corresponding values before radiation.
As the time of radiation over the RBCs becomes longer,
the number of the deformed RBCs increases. In fact, af-
ter 60 minutes of radiation, all RBCs were deformed to
be acanthocytes. Aggregation was strengthened as more
acanthocytes were formed. If the radiation time is longer
than 60 minutes, this kind of deformation will be irre-
parable. Figure 2 show s the results of RBCs deformation
under EM waves’ radiation measured at different time
points: before radiation, after 30 minutes and after 60 mi-
nutes radiation.
The red cells will be changed in shape, size, and su-
Table 1. Geometric parameters of RBC vs power density (for 900 MHz EM wave) after 30 minutes N = 80.
power density
0 15 μW/cm
2
31 μW/cm
2
1 mW/cm
2
5 mW/cm
2
Area (μm2) 42.59 ± 5.14 42.72 ± 4.91 42.99 ± 5.03 40.46 ± 4.88
*
40.73 ± 4.99
*
Diameter (μm) 7.04 ± 0.45 7.05 ± 0.48 7.09 ± 0.44 6.91 ± 0.40
*
6.86 ± 0.43
*
Long-short axis ratio 1.03 ± 0.05 1.03 ± 0.05 1.03 ± 0.05 1.05 ± 0.06
*
1.06 ± 0.05
*
Normalized factor 0.76 ± 0.06 0.76 ± 0.05 0.76 ± 0.06 0.79 ± 0.04
*
0.80 ± 0.05
*
*P < 0.05; N: number of data point in each measure .
Table 2. Geometric parameters of RBC vs irradiation time (for 900 MHz EM wave, 5 mW/cm2) N = 80.
t (min) 0 10 20 30 60 90 120
Area (μm2) 42.95 ± 5.11 42.88 ± 5.05 41.36 ± 4.83* 40.55 ± 4.70* 39.58 ± 4.83# 39.33 ± 4.80 39.19 ± 4.92
Diameter (μm) 7.05 ± 0.46 7.05 ± 0.43 6.92 ± 0.50* 6.86 ± 0.52* 6.78 ± 0.43# 6.80 ± 0.40 6.79 ± 0.46
Long-short axis ratio 1.03 ± 0.05 1.03 ± 0.06 1.04 ± 0.05* 1.06 ± 0.06* 1.07 ± 0.05# 1.07 ± 0.06 1.07 ± 0.05
Normalized factor 0.75 ± 0.06 0.75 ± 0.05 0.78 ± 0.06* 0.79 ± 0.06* 0.82 ± 0.05# 0.82 ± 0.06 0.82 ± 0.05
*P < 0.05; #P < 0.01; N: numbe r of data point in each me asure.
J. G. YONG ET AL.
Copyright © 2013 SciRes. ENG
453
(a) (b) (c)
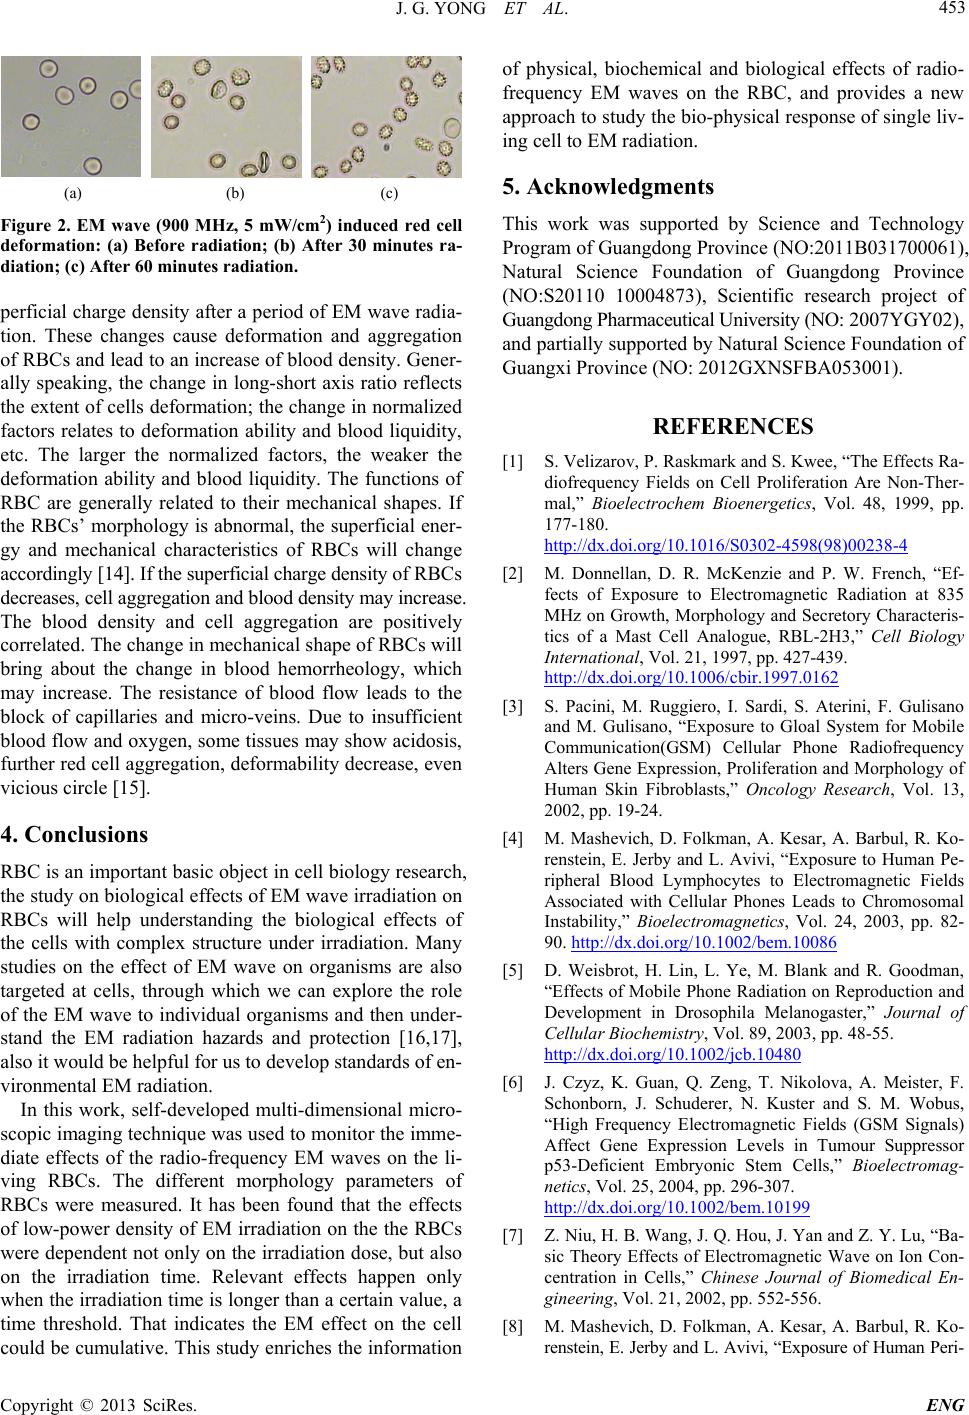
Figure 2. EM wave (900 MHz, 5 mW/cm2) induced red cell
deformation: (a) Before radiation; (b) After 30 minutes ra-
diation; (c) After 60 minutes radiation.
perf icial ch arge dens ity after a p eriod of EM w ave radi a-
tion. These changes cause deformation and aggregation
of RBCs and lead to a n increase of blood den sity. Gene r-
ally speaking, the change in long-short axis ratio reflects
the extent of cells deformation; the change in normalized
factors relates to deformation ability and blood liquidity,
etc. The larger the normalized factors, the weaker the
deformation ability and blood liquidity. The functions of
RBC are generally related to their mechanical shapes. If
the RBCsmorphology is abnormal, th e superficial ener-
gy and mechanical characteristics of RBCs will change
accordingly [14]. If the superficial charge density of RBCs
decreases, cell aggregation and blood density may increase.
The blood density and cell aggregation are positively
correlated. The change in mechanical shape of RBCs will
bring about the change in blood hemorrheology, which
may increase. The resistance of blood flow leads to the
block of capillaries and micro-veins. Due to insufficient
blood flow and oxygen, some tissues may show acidosis,
further red cell aggregation, deformability decrease, even
vicious circle [15].
4. Conclusions
RBC is an important b asic object in cell biology r esearch,
the study on biological effects of EM wave irradiation on
RBCs will help understanding the biological effects of
the cells with complex structure under irradiation. Many
studies on the effect of EM wave on organisms are also
targeted at cells, through which we can explore the role
of the EM wave to individual organisms and then under-
stand the EM radiation hazards and protection [16,17],
also it would be helpful for us to develop standards of en-
vironmental EM radiation.
In this work, self-developed multi-dimensional micro-
scopic imaging technique was used to monitor the imme-
diate effects of the radio-frequency EM waves on the li-
ving RBCs. The different morphology parameters of
RBCs were measured. It has been found that the effects
of low-power density of EM irradiation on the the RBCs
wer e dependent not only on the irradiation dose, but also
on the irradiation time. Relevant effects happen only
when the irradiation time is longer than a certain value, a
time threshold. That indicates the EM effect on the cell
could be cumulative. This study enriches the information
of physical, biochemical and biological effects of radio-
frequency EM waves on the RBC, and provides a new
approach to study the bio-physical response of s ingle liv-
ing cell to EM radiation.
5. Acknowledgments
This work was supported by Science and Technology
Program of Guan gdo ng Prov inc e ( NO:2011B031700061),
Natural Science Foundation of Guangdong Province
(NO:S20110 10004873), Scientific research project of
Guangdong Pharmaceutical University (NO: 2007YGY02),
and partially supported by Natural Science Foundation of
Guangxi P rovince ( N O: 2012GXNSFBA053001).
REFERENCES
[1] S. Velizarov, P. Raskmark and S. Kwee, “The Effects Ra-
diofrequency Fields on Cell Proliferation Are Non-Ther-
mal,” Bioelectrochem Bioenergetics, Vol. 48, 1999, pp.
177-180.
http://dx.doi.org/10.1016/S0302-4598(98)00238-4
[2] M. Donnellan, D. R. McKenzie and P. W. French, “Ef-
fects of Exposure to Electromagnetic Radiation at 835
MHz on Growth, Morphology and Secretory Characteris-
tics of a Mast Cell Analogue, RBL-2H3,” Cell Biology
International, Vol. 21, 1997, pp. 427-439.
http://dx.doi.org/10.1006/cbir.1997.0162
[3] S. Pacini, M. Ruggiero, I. Sardi, S. Aterini, F. Gulisano
and M. Gulisano, “Exposure to Gloal System for Mobile
Communication(GSM) Cellular Phone Radiofrequency
Alters Gene Expression, Proliferation and Morphology of
Human Skin Fibroblasts,” Oncology Research, Vol. 13,
2002, pp. 19-24.
[4] M. Mashevich, D. Folkman, A. Kesar, A. Barbul, R. Ko-
renstein, E. Jerby and L. Avivi,Exposure to Human Pe-
ripheral Blood Lymphocytes to Electromagnetic Fields
Associated with Cellular Phones Leads to Chromosomal
Instability,” Bioelectromagnetics, Vol. 24, 2003, pp. 82-
90. http://dx.doi.org/10.1002/bem.10086
[5] D. Weisbrot, H. Lin, L. Ye, M. Blank and R. Goodman,
Effects of Mobile Phone Radiation on Reproduction and
Development in Drosophila Melanogaster,” Journal of
Cellular Biochem is try, Vol. 89, 2003, pp. 48-55.
http://dx.doi.org/10.1002/jcb.10480
[6] J. Czyz, K. Gua n, Q. Zeng, T. Nikolova, A. Meister, F.
Schonborn, J. Schuderer, N. Kuster and S. M. Wobus,
“High Frequency Electromagnetic Fields (GSM Signals)
Affect Gene Expression Levels in Tumour Suppressor
p53-Deficient Embryonic Stem Cells,” Bioelectromag-
netics, Vol. 25, 2004, pp. 296-307.
http://dx.doi.org/10.1002/bem.10199
[7] Z. Niu, H. B. Wa ng, J. Q. Hou, J. Yan and Z. Y. Lu, “Ba-
sic Theory Effects of Electromagnetic Wave on Ion Con-
centration in Cells,” Chinese Journal of Biomedical En-
gineering, Vol. 21, 2002, pp. 552-556.
[8] M. Mashevich, D. Folkman, A. Kesar, A. Barbul, R. Ko-
renstein, E. Jerby and L. Avivi, Exposure of Human Peri -
J. G. YONG ET AL.
Copyright © 2013 SciRes. ENG
454
pheral Blood Lymphocytes to Ele ctromagnet ic Fields As-
sociated with Cellular Phones Leads to Chromosomal In-
stability,” Bioelectromagnetics, Vol. 24, 2003, pp. 82-90.
http://dx.doi.org/10.1002/bem.10086
[9] J. Tao, “Micro-Spectrophotometry & Image Analysis
with Applications in Structure & Function Simultaneous
Measurement on Single Intact Cell [D],” Sun Yat-sen
University of Medical Sciences, Guangzhou, 2001, pp.
42-57 (in Chinese).
[10] L. L. Kang, Y. X. Huang, M. Luo, X. E. Yu and Z. J.
Yuan, “Confocal Raman Micro-Spectroscopy of Lympho-
cyte Under Exposure to 900 MHz Electromagnetic Fields,”
Journal of the Fourth Military Medical University, Vol.
28, No. 20, 2007, pp. 1862-1864 (in Chinese).
[11] C. S. Yao, “Instant Effects of 900 MHz Electromagnetic
Wave Radiation and Some Physic a l and Chemical Factors
on Human Red Blood Cell. [D],” Sun Yat-sen University
of MedicalSciences, Guangzhou, 2004 (in Chinese).
[12] C. C. Yao, Y. X. Huang, X. K. Li and P. Ruan, Effects
of pH on Structure and Function of Single Living Eryt-
hrocyte,” Chinese Science Bulletin, Vol. 48, 2003, pp.
1342-1346.
[13] C. C. Yao, P. Yao, G. H. Tang, Q. Zheng, X. K. Li and Y.
X. Huang, Effects of Radio -Frequency Electromagnetic
Wave and Environmental Temperature on Membrane Me-
chanical Properties of Single Living Intact Human Red
Blood Cell,” Chinas Occupational Medicine, Vol. 32,
2005, pp. 11-13.
[14] P. Ruan, Y. X. Huang, M. Tu and S. H. Lin, Change of
the Dynamic Characteristics of Membrane and Oxygen
Carrying Ability of the Erythrocyte in Different pH,”
Journal of the Fourth Military Medical University, Vol.
24, 2003, pp. 2119-2121.
[15] P. Ruan, Y. X. Huang and D. Li, Spectrum Analysis of
Erythrocyte Intracellular Hemoglobin with a Novel Fast
Multi-Channel Micro-Spectrophotometry,” Spectroscopy
and Spectral Analysis, Vol. 25, 2005, pp. 1121-1124.
[16] J. Fang, X. G. Huang, L. Ma, Y. Li and Y. J. Cao, “Ef-
fects of 900 MHz Electromagnetic Field on DNA and the
Protein Expression of p53 Gene in Human Embryonic
Lung Cells,” Journal of Environment and Health, Vol. 24,
2007, pp. 251-253.
[17] Y. J. Zhou and Z. Q. Niu, Mechanism of Biological Ef-
fects of ELF Pulsed Electromagnetic Wave on Cells,”
Space Medicine & Medical Engineering, Vol. 21, 2008,
pp. 121-125.