 Vol.3, No.2, 109-119 (2011) Natural Science http://dx.doi.org/10.4236/ns.2011.32016 Copyright © 2011 SciRes. OPEN ACCESS Seismic activity of the earth, the cosmological vectorial potential and method of a short-term earthquakes forecasting Baurov Yury Alexeevich*, Baurov Alexey Yur’evich, Baurov Alexandr Yur’evich (Jr.), Spitalnaya Alexandra Alfredovna, Abramyan Ara Arshavirovich, Solodovnikov Vladimir Alexandrovich Closed Joint Stock Company Research Institute of Cosmic Physics, Korolev, Russia; *Corresponding Author: baurov@mail.ru Received 10 October 2010; revised 12 November 2010; accepted 15 November 2010. ABSTRACT To the foundation of a principally new short-term forecasting method there has been laid down a theory of surrounding us world’s creation and of physical vacuum as a result of interaction of byuons-discrete objects. The definition of the byuon contains the cosmological vector-potential Ag - a novel fundamental vector constant. This theory predicts a new anisotropic interaction of nature objects with the physical vacuum. A pe- culiar “tap” to gain new energy (giving rise to an earthquake) are elementary particles because their masses are proportional to the modulus of some summary potential A that contains po- tentials of all known fields. The value of A cannot be larger than the modulus of Ag. In ac- cordance with the experimental results a new force associated with A ejects substance from the area of the weakened A along a conical formation with the opening of 100о ± 10о and the axis directed along the vector A. This vector has the following coordinates in the second equatorial coordinate system: right ascension 293 ± 10, declination 36 ± 10. The 100% probability of an earthquake (earthquakes of 6 points strong and more by the Richter scale) arises when in the process of the earth rotation the zenith vector of a seismically dangerous region and/or the vectorial potential of Earth’s magnetic fields are in a certain way oriented relative to the vector Ag. In the work, basic models and standard mechanisms of earth- quakes are briefly considered, results of proc- essing of information on the earthquakes in the context of global spatial anisotropy caused by the existence of the vector Ag, are presented, and an analysis of them is given. Keywords: Earthquake; New Anisotropic Interaction 1. INTRODUCTION In References [1-3] theory of surrounding us world’s creation and of physical space (vacuum) as a result of interaction of byuons-discrete objects, is given. The definition of the byuon contains the cosmological vec- tor-potential Ag - a novel fundamental vector constant. This theory predicts a new anisotropic interaction of nature objects with physical vacuum. Peculiar “tap” to gain new energy (giving rise to an earthquake) are elementary particles because their masses are proportional to the modulus of some summary po- tential A that contains potentials of all known fields. The value of A cannot be larger than the modulus of Ag. In accordance with the experimental results shown in [1-9], this force ejects substance from the area of the weakened A along a conical formation with the open- ing of 100о 10о and the axis directed along the vector A. This vector has the following coor- dinates in the second equatorial coordinate system: right ascension 293 10, declination 36 10 [3,4]. In the present paper, the hypothesis for connection of the Earth’s seismic activity with fluctuations in the structure of physical space (vacuum) is considered. That is, our planet, the Earth, will be treated as a peculiar large-scale probe in the physical space the seismic activ- ity of which allows to judge the fluctuations of physical space itself and in so doing to refine its structure and direction of the vector Ag. And vice versa, with a knowledge of space structure and of its fluctuations one would be able to predict more accurately the most dan- gerous day time for Earth’s inhabitants at one or another place of our planet. The urgency of this problem has no need of much to talk because earthquakes lead to many- thousand victims and catastrophic destructions.  Y. A. Baurov et al. / Natural Science 3 (2011) 109-119 Copyright © 2011 SciRes. OPEN ACCESS 110 In the work, basic models and standard mechanisms of earthquakes are briefly considered, results of proc- essing of information on the earthquakes in the context of global spatial anisotropy caused by the existence of the vector Ag, are presented, and an analysis of them is given. A method of short-term earthquakes forecasting (1-2 days in advance) is advanced. 2. EARTHQUAKES AND THEIR MECHANISMS OF GENERATION An earthquake is the sudden release of potential en- ergy of bowels of the earth in the form of shock waves and elastic vibrations propagating every which way from the center (hypocenter), as well as in the form of shifts of the Earth’s surface such as warpings of crust, dis- placements along fault lines, compactions of granular or not grouted precipitations, soil slips and mudflows, soil dilution, snow avalanches, new fracture formation in rocks [10]. The mechanism of release of potential energy is not yet sufficiently studied for earthquakes at depths from 60 km to 720 km [11]. The Earth is never quiescent. Sensible seismographs constantly detect weak oscillations, microseisms, with periods from 4 to 6 seconds and variable amplitudes. Even “microseismic storms” take place, they are connected mainly with sharp changes in weather. During powerful earthquakes almost total seismic energy is released. An energy characteristic of earthquakes is the magni- tude. A scale of magnitudes was elaborated by Karl Richter, a professor of Californian Technological Insti- tute. The magnitude of an earthquake is a measure of the total energy quantity released in the form of elastic waves, and that is not equal to the total energy of earth- quake. Part of elastic energy accumulated in the center of earthquake is turned into heat. The magnitude is characterized by the maximum am- plitude of record by a seismograph of standard type at a fixed distance from the hypocenter of earthquake. The most potent disastrous earthquakes have amplitude M = 9. As an example of earthquakes with M = 9, that in Lissabon at November 1, 1755, may be considered. Any earthquake with M 7 is the great disaster, par- ticularly if that happens in the neighbourhood of popu- lated area. The energy released during such earthquakes ranges from 2.1̣·1022 to 1.6·1025 erg. Very strong earthquakes lead to torsion and spheroidal oscillations of the Earth as a whole. For very weak shocks, negative values of the magnitude are used [10]. As to depth of occurrence (h) of earthquake centers, those are classified into three categories: crustal (0 h 70 km), middle focal (intermediate) (70 < h 300 km), and deep focal h > 300 km earthquakes. The most deep focal shocks were recorded only in the southern hemisphere of the Earth: 1) in the vicinity of Kermadec runner (10047 m in depth, interval of latitudes 35S 25S): 2) in the neighbourhood of Tonga runner (10882 m in depth, interval of latitudes 25S 15S) (both run- ners are located to the north-west from New Zealand); 3) in the latitude 6 to the south from Sulawesi is- land (Indonesia). The centers of those earthquakes were up to 720 km deep from the surface. In Table 1 are listed distributions of earthquakes of all types (from deep focal to crustal ones) registered at a period from 1904 till 19881 and having magnitudes M = 7 and more except for the deep focal earthquakes for which, to magnify the sample, we had to use those be- ginning with М 5.9. The data were chosen from cata- logues [10-15]. It follows from Table 1 that great majority of earth- quakes of all type occurs at latitudes 35-45 north as well as in southern latitudes of equatorial region and at 25S. Therewith the crustal earthquakes are prevalent in the northern hemisphere, whereas deep focal earth- quakes are in the southern one as evidenced by confi- dence intervals L obtained with the use of Student t-test for random values of the average with the level of sig- nificance of 0.01 and 0.001 (see Figure 1). The first fact was known as early as the beginning of 20-th century [16-19] and even earlier [20] in the context of the question of how and where the stresses accumu- late in the Earth’s crust. The question of a particular role of 35-th parallel in the tectonic life of the Earth was repeatedly posed by geographers and geologists as in the Russian so in for- eign literature. The first work along this line was proba- bly that by A. A. Tillo [20] which has pointed out all the most high peaks and mountain chains as well as the most great depths in the northern hemisphere to gravitate to- wards the latitudes of 30-40. All researches of this sort persued prior 1962 (with voluminous list of literature) may be acquainted with in the articles of M. V. Stovas, an astronomer-geodesist [16,17], and V. A. Tsaregradsky, an astrogeologist [18]. One of important conclusions of those studies was that all processes connected with the most potent earthquakes have a common mechanism for the whole Globe. Following German geologists, the authors of Refs. [16-18] considered the periodic variation of the Earth’s rotation velocity due to tide influence of Moon and Sun as one of the sources of energy for tectonic processes. The smaller is the angular velocity of rotation, the more 1In Precisely this period of time will be analyzed further without refer- ence to dates.  Y. A. Baurov et al. / Natural Science 3 (2011) 109-119 Copyright © 2011 SciRes. OPEN ACCESS 111 Table 1. The dependence of number of earthquakes (ni) from the latitude (or declination) of their epicenters and hypocenters. h > 300 км 70 < h 300 км 0 h 70 км Все = ni ni/n ni ni/n ni ni/n ni ni/n +85 0 0,00 0 0,00 0 0,00 0 0,00 +75 0 0,00 0 0,00 1 0,02 1 0,01 +65 0 0,00 2 0,12 14 0,25 16 0,15 +55 26 0,78 17 1,05 92 1,64 135 1,28 +45 69 2,06 20 1,23 120 2,14 209 1,98 +35 70 2,09 30 1,85 122 2,18 222 2,10 +25 45 1,34 16 0,99 75 1,34 136 1,29 +15 13 0,39 33 2,04 92 1,64 138 1,31 +5 23 0,69 19 1,17 85 1,52 127 1,20 −5 −99 2,96 42 2,59 137 2,45 278 2,63 −15 70 2,09 49 3,02 99 1,77 218 2,06 −25 168 5,01 48 2,96 68 1,22 284 2,69 −35 20 0,60 9 0,56 42 0,75 71 0,67 −45 0 0,00 1 0,06 25 0,45 26 0,25 −55 0 0,00 5 0,31 20 0,36 25 0,24 −65 0 0,00 0 0,00 15 0,27 15 0,14 −75 0 0,00 0 0,00 0 0,00 0 0,00 −85 0 0,00 0 0,00 0 0,00 0 0,00 603 291 1007 1901 n 33,5 16,2 55,9 105,6 nS nN 357 246 4,5 154 137 406 601 −6,1 917 984 1,5 – is the total number of earthquakes with M 7 over the period from 1904 till 1988; n –is the average number of earthquakes in 10-interval of latitudes; –is the standard deviation characterizing the anisotropy of Northern and Southern hemispheres relative to the number of the most strong earthquakes; ns–is the number of earthquakes in the southern hemisphere; nN–is that in the Northern hemisphere. globe-shaped becomes the form of the Earth. And vice versa, with the growth of angular velocity the planet becomes more ellipsoid-shaped. The reconstruction of superficial form of the Earth will be the most considera- bly reflected in the regions of 35-th parallels of north- ern and southern hemispheres. Those regions are named critical. Said parallels are also associated with compres- sive and tensile strains originated under the action of precession (slow motion of the Earth’s axis of rotation over a circular cone around an axis orthogonal to the plane of ecliptic. Many epicenters of earthquakes con- centrate near the critical parallels, too. To explain large number of meridionally extending structures, supporters of rotational hypothesis admitted the possibility of time variations of the Earth’s axis of rotation. As the form of the Earth changes, all tectonic proc- esses are to be symmetric about the equator. But from Figure 1, it is clearly seen that at southern latitudes of 30-40S the number of the strongest earthquakes is lesser than the average, and there is no symmetry in their distribution about the equator. 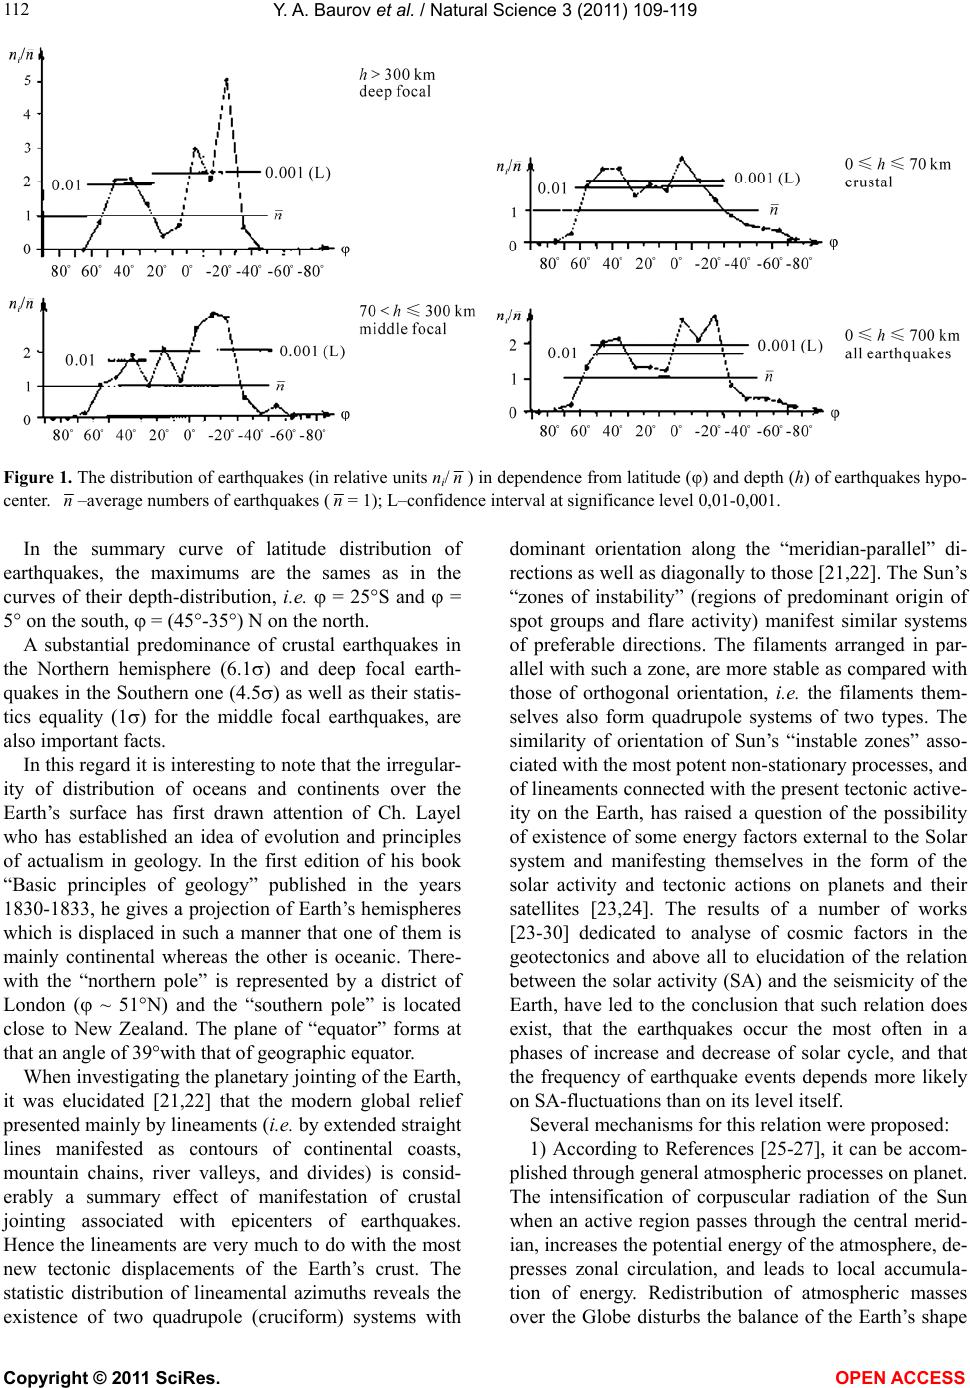 Y. A. Baurov et al. / Natural Science 3 (2011) 109-119 Copyright © 2011 SciRes. OPEN ACCESS 112 Figure 1. The distribution of earthquakes (in relative units ni/n) in dependence from latitude (φ) and depth (h) of earthquakes hypo- center. n–average numbers of earthquakes (n= 1); L–confidence interval at significance level 0,01-0,001. In the summary curve of latitude distribution of earthquakes, the maximums are the sames as in the curves of their depth-distribution, i.e. = 25S and = 5 on the south, = (45-35) N on the north. A substantial predominance of crustal earthquakes in the Northern hemisphere (6.1) and deep focal earth- quakes in the Southern one (4.5) as well as their statis- tics equality (1) for the middle focal earthquakes, are also important facts. In this regard it is interesting to note that the irregular- ity of distribution of oceans and continents over the Earth’s surface has first drawn attention of Ch. Layel who has established an idea of evolution and principles of actualism in geology. In the first edition of his book “Basic principles of geology” published in the years 1830-1833, he gives a projection of Earth’s hemispheres which is displaced in such a manner that one of them is mainly continental whereas the other is oceanic. There- with the “northern pole” is represented by a district of London ( ~ 51N) and the “southern pole” is located close to New Zealand. The plane of “equator” forms at that an angle of 39with that of geographic equator. When investigating the planetary jointing of the Earth, it was elucidated [21,22] that the modern global relief presented mainly by lineaments (i.e. by extended straight lines manifested as contours of continental coasts, mountain chains, river valleys, and divides) is consid- erably a summary effect of manifestation of crustal jointing associated with epicenters of earthquakes. Hence the lineaments are very much to do with the most new tectonic displacements of the Earth’s crust. The statistic distribution of lineamental azimuths reveals the existence of two quadrupole (cruciform) systems with dominant orientation along the “meridian-parallel” di- rections as well as diagonally to those [21,22]. The Sun’s “zones of instability” (regions of predominant origin of spot groups and flare activity) manifest similar systems of preferable directions. The filaments arranged in par- allel with such a zone, are more stable as compared with those of orthogonal orientation, i.e. the filaments them- selves also form quadrupole systems of two types. The similarity of orientation of Sun’s “instable zones” asso- ciated with the most potent non-stationary processes, and of lineaments connected with the present tectonic active- ity on the Earth, has raised a question of the possibility of existence of some energy factors external to the Solar system and manifesting themselves in the form of the solar activity and tectonic actions on planets and their satellites [23,24]. The results of a number of works [23-30] dedicated to analyse of cosmic factors in the geotectonics and above all to elucidation of the relation between the solar activity (SA) and the seismicity of the Earth, have led to the conclusion that such relation does exist, that the earthquakes occur the most often in a phases of increase and decrease of solar cycle, and that the frequency of earthquake events depends more likely on SA-fluctuations than on its level itself. Several mechanisms for this relation were proposed: 1) According to References [25-27], it can be accom- plished through general atmospheric processes on planet. The intensification of corpuscular radiation of the Sun when an active region passes through the central merid- ian, increases the potential energy of the atmosphere, de- presses zonal circulation, and leads to local accumula- tion of energy. Redistribution of atmospheric masses over the Globe disturbs the balance of the Earth’s shape 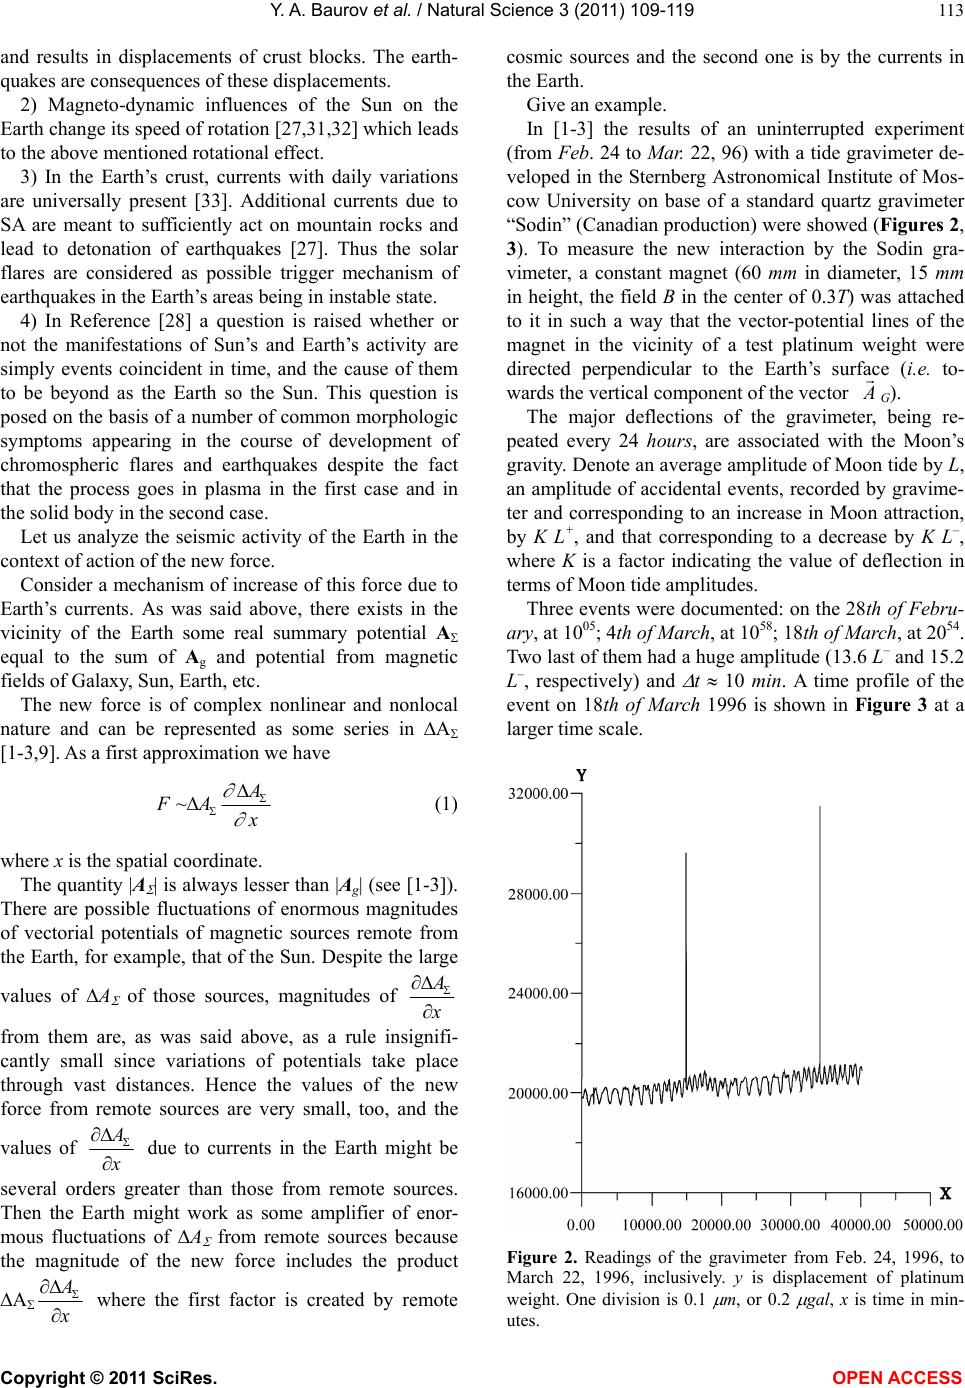 Y. A. Baurov et al. / Natural Science 3 (2011) 109-119 Copyright © 2011 SciRes. OPEN ACCESS 113 and results in displacements of crust blocks. The earth- quakes are consequences of these displacements. 2) Magneto-dynamic influences of the Sun on the Earth change its speed of rotation [27,31,32] which leads to the above mentioned rotational effect. 3) In the Earth’s crust, currents with daily variations are universally present [33]. Additional currents due to SA are meant to sufficiently act on mountain rocks and lead to detonation of earthquakes [27]. Thus the solar flares are considered as possible trigger mechanism of earthquakes in the Earth’s areas being in instable state. 4) In Reference [28] a question is raised whether or not the manifestations of Sun’s and Earth’s activity are simply events coincident in time, and the cause of them to be beyond as the Earth so the Sun. This question is posed on the basis of a number of common morphologic symptoms appearing in the course of development of chromospheric flares and earthquakes despite the fact that the process goes in plasma in the first case and in the solid body in the second case. Let us analyze the seismic activity of the Earth in the context of action of the new force. Consider a mechanism of increase of this force due to Earth’s currents. As was said above, there exists in the vicinity of the Earth some real summary potential A equal to the sum of Ag and potential from magnetic fields of Galaxy, Sun, Earth, etc. The new force is of complex nonlinear and nonlocal nature and can be represented as some series in A [1-3,9]. As a first approximation we have ~ FA (1) where x is the spatial coordinate. The quantity |A | is always lesser than |Ag| (see [1-3]). There are possible fluctuations of enormous magnitudes of vectorial potentials of magnetic sources remote from the Earth, for example, that of the Sun. Despite the large values of А of those sources, magnitudes of from them are, as was said above, as a rule insignifi- cantly small since variations of potentials take place through vast distances. Hence the values of the new force from remote sources are very small, too, and the values of due to currents in the Earth might be several orders greater than those from remote sources. Then the Earth might work as some amplifier of enor- mous fluctuations of А from remote sources because the magnitude of the new force includes the product А where the first factor is created by remote cosmic sources and the second one is by the currents in the Earth. Give an example. In [1-3] the results of an uninterrupted experiment (from Feb. 24 to Mar. 22, 96) with a tide gravimeter de- veloped in the Sternberg Astronomical Institute of Mos- cow University on base of a standard quartz gravimeter “Sodin” (Canadian production) were showed (Figures 2, 3). To measure the new interaction by the Sodin gra- vimeter, a constant magnet (60 mm in diameter, 15 mm in height, the field B in the center of 0.3T) was attached to it in such a way that the vector-potential lines of the magnet in the vicinity of a test platinum weight were directed perpendicular to the Earth’s surface (i.e. to- wards the vertical component of the vector G). The major deflections of the gravimeter, being re- peated every 24 hours, are associated with the Moon’s gravity. Denote an average amplitude of Moon tide by L, an amplitude of accidental events, recorded by gravime- ter and corresponding to an increase in Moon attraction, by K L+, and that corresponding to a decrease by K L–, where K is a factor indicating the value of deflection in terms of Moon tide amplitudes. Three events were documented: on the 28th of Febru- ary, at 1005; 4th of March, at 1058; 18th of March, at 2054. Two last of them had a huge amplitude (13.6 L– and 15.2 L–, respectively) and t 10 min. A time profile of the event on 18th of March 1996 is shown in Figure 3 at a larger time scale. Figure 2. Readings of the gravimeter from Feb. 24, 1996, to March 22, 1996, inclusively. y is displacement of platinum weight. One division is 0.1 m, or 0.2 gal, x is time in min- utes. 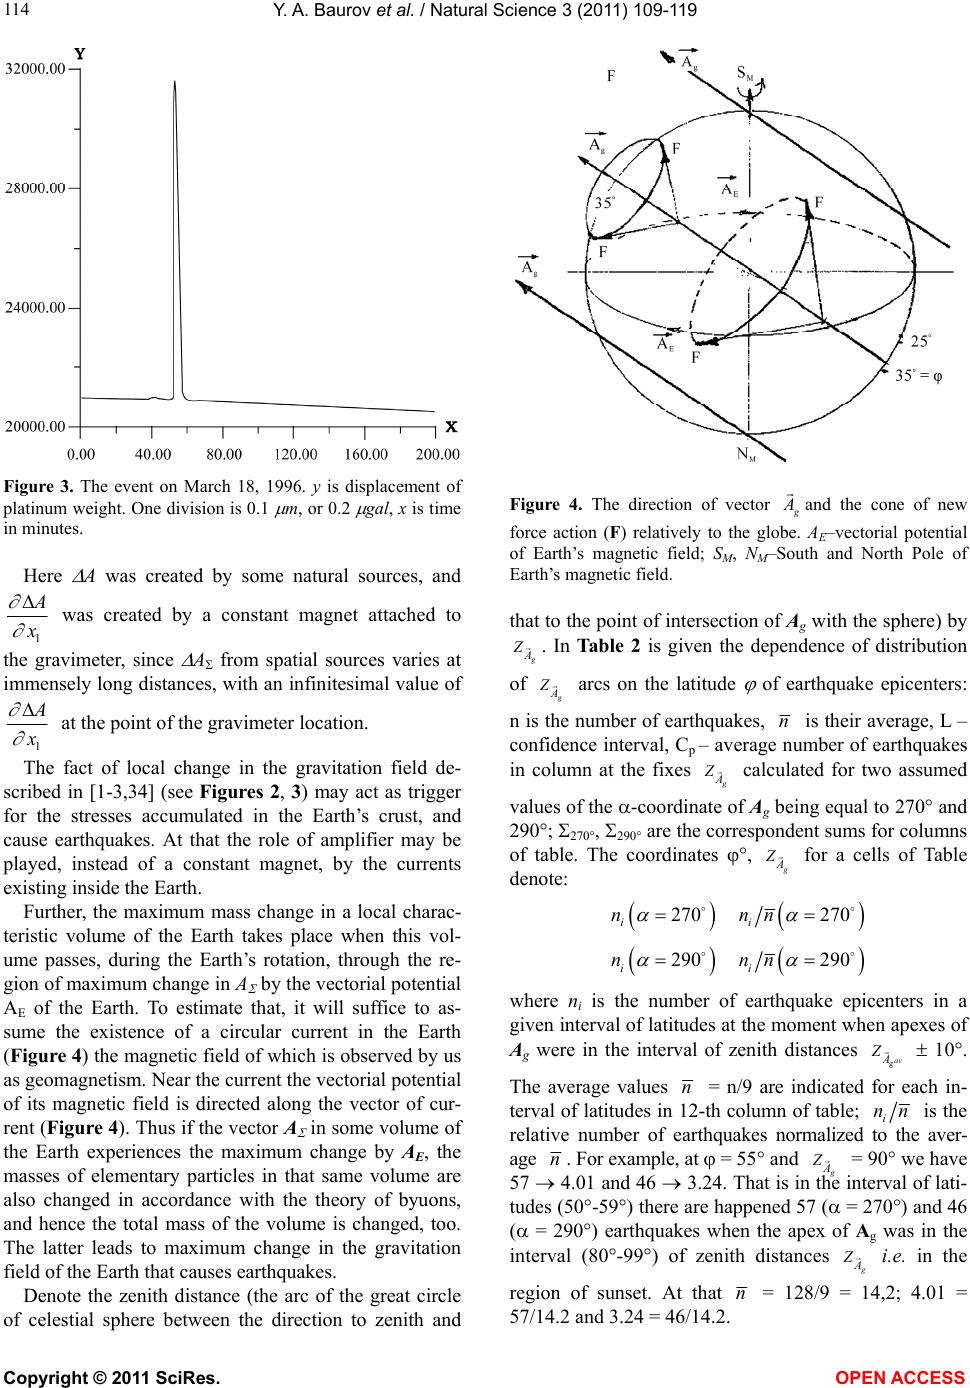 Y. A. Baurov et al. / Natural Science 3 (2011) 109-119 Copyright © 2011 SciRes. OPEN ACCESS 114 Figure 3. The event on March 18, 1996. y is displacement of platinum weight. One division is 0.1 m, or 0.2 gal, x is time in minutes. Here A was created by some natural sources, and 1 was created by a constant magnet attached to the gravimeter, since A from spatial sources varies at immensely long distances, with an infinitesimal value of 1 at the point of the gravimeter location. The fact of local change in the gravitation field de- scribed in [1-3,34] (see Figures 2, 3) may act as trigger for the stresses accumulated in the Earth’s crust, and cause earthquakes. At that the role of amplifier may be played, instead of a constant magnet, by the currents existing inside the Earth. Further, the maximum mass change in a local charac- teristic volume of the Earth takes place when this vol- ume passes, during the Earth’s rotation, through the re- gion of maximum change in A by the vectorial potential AE of the Earth. To estimate that, it will suffice to as- sume the existence of a circular current in the Earth (Figure 4) the magnetic field of which is observed by us as geomagnetism. Near the current the vectorial potential of its magnetic field is directed along the vector of cur- rent (Figure 4). Thus if the vector A in some volume of the Earth experiences the maximum change by AE, the masses of elementary particles in that same volume are also changed in accordance with the theory of byuons, and hence the total mass of the volume is changed, too. The latter leads to maximum change in the gravitation field of the Earth that causes earthquakes. Denote the zenith distance (the arc of the great circle of celestial sphere between the direction to zenith and Figure 4. The direction of vector and the cone of new force action (F) relatively to the globe. AE–vectorial potential of Earth’s magnetic field; SM, NM–South and North Pole of Earth’s magnetic field. that to the point of intersection of Ag with the sphere) by А . In Table 2 is given the dependence of distribution of А arcs on the latitude of earthquake epicenters: n is the number of earthquakes, n is their average, L – confidence interval, Cp – average number of earthquakes in column at the fixes А calculated for two assumed values of the -coordinate of Ag being equal to 270 and 290; 270, 290 are the correspondent sums for columns of table. The coordinates , А for a cells of Table denote: 270 270 ii nnn 290 290 ii nnn where ni is the number of earthquake epicenters in a given interval of latitudes at the moment when apexes of Ag were in the interval of zenith distances gavА Z 10. The average values n = n/9 are indicated for each in- terval of latitudes in 12-th column of table; i nn is the relative number of earthquakes normalized to the aver- age n. For example, at = 55 and А = 90 we have 57 4.01 and 46 3.24. That is in the interval of lati- tudes (50-59) there are happened 57 ( = 270) and 46 ( = 290) earthquakes when the apex of Ag was in the interval (80-99) of zenith distances А i.e. in the region of sunset. At that n = 128/9 = 14,2; 4.01 = 57/14.2 and 3.24 = 46/14.2. 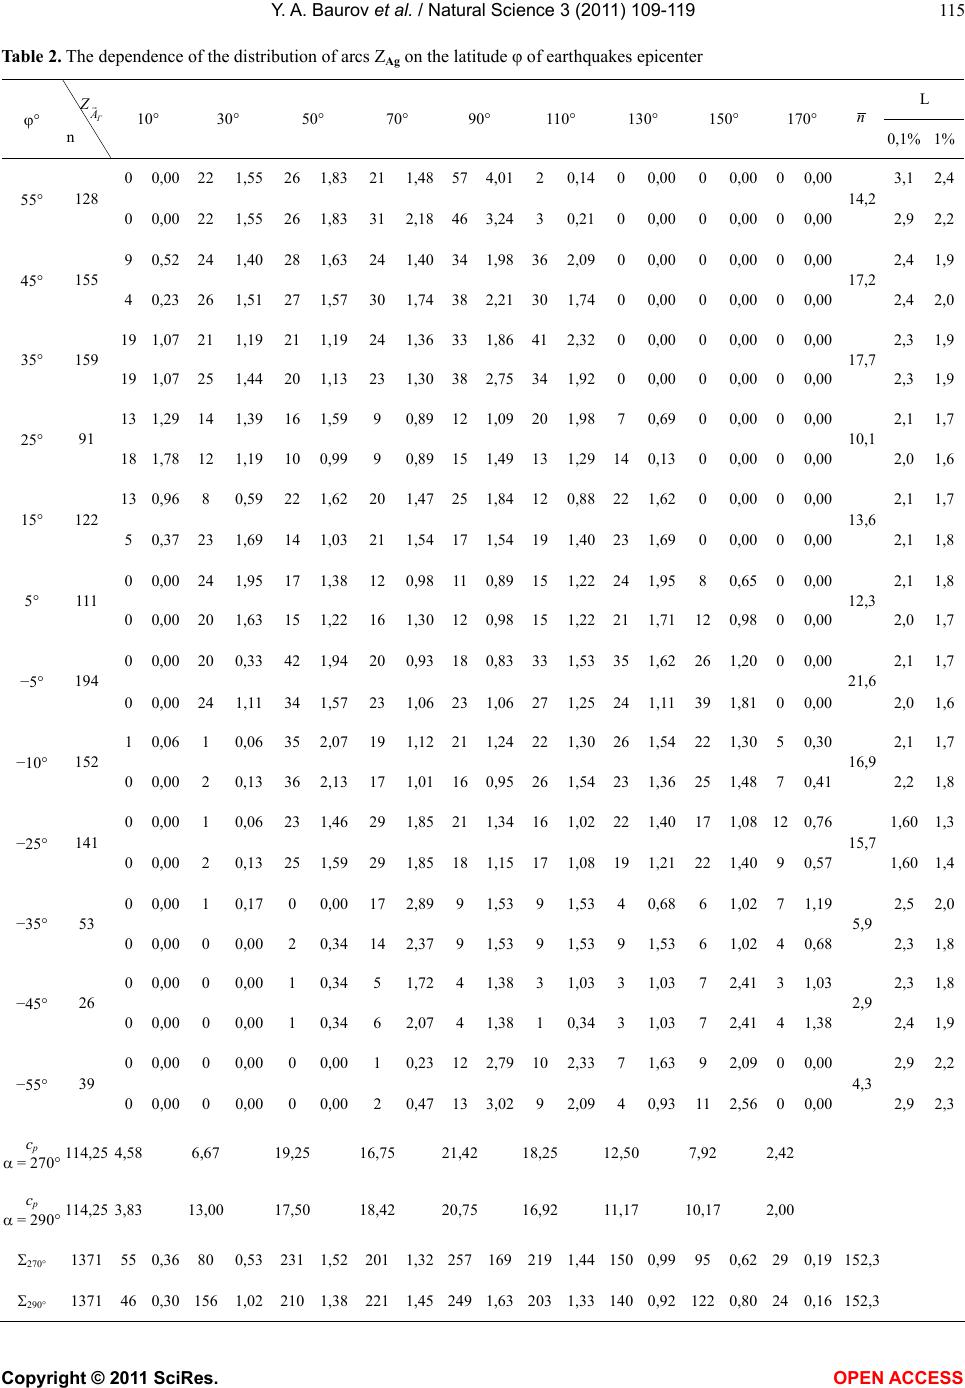 Y. A. Baurov et al. / Natural Science 3 (2011) 109-119 Copyright © 2011 SciRes. OPEN ACCESS 115 Table 2. The dependence of the distribution of arcs ZAg on the latitude φ of earthquakes epicenter L А n 10 30 50 70 90 110 130 150 170 n 0,1% 1% 0 0,00 22 1,55 26 1,83 211,48574,0120,1400,0000,00 0 0,00 3,12,4 55 128 0 0,00 22 1,55 26 1,83 312,18463,2430,2100,0000,00 0 0,00 14,2 2,9 2,2 9 0,52 24 1,40 28 1,63 241,40341,98362,0900,0000,00 0 0,00 2,41,9 45 155 4 0,23 26 1,51 27 1,57 301,74382,21301,7400,0000,00 0 0,00 17,2 2,4 2,0 19 1,07 21 1,19 21 1,19 241,36331,86412,3200,0000,00 0 0,00 2,31,9 35 159 19 1,07 25 1,44 20 1,13 231,30382,75341,9200,0000,00 0 0,00 17,7 2,3 1,9 13 1,29 14 1,39 16 1,59 9 0,89121,09201,9870,6900,00 0 0,00 2,11,7 25 91 18 1,78 12 1,19 10 0,99 9 0,89151,49131,29140,1300,00 0 0,00 10,1 2,0 1,6 13 0,96 8 0,59 22 1,62 201,47251,84120,88221,6200,00 0 0,00 2,11,7 15 122 5 0,37 23 1,69 14 1,03 211,54171,54191,4023 1,6900,00 0 0,00 13,6 2,1 1,8 0 0,00 24 1,95 17 1,38 120,98110,89151,2224 1,9580,65 0 0,00 2,11,8 5 111 0 0,00 20 1,63 15 1,22 161,30120,98151,2221 1,71 120,98 0 0,00 12,3 2,0 1,7 0 0,00 20 0,33 42 1,94 200,93180,83331,5335 1,62 261,20 0 0,00 2,11,7 −5 194 0 0,00 24 1,11 34 1,57 231,06231,06271,25241,11391,81 0 0,00 21,6 2,0 1,6 1 0,06 1 0,06 35 2,07 191,12211,2422 1,3026 1,54 22 1,30 5 0,30 2,11,7 −10 152 0 0,00 2 0,13 36 2,13 171,01160,9526 1,5423 1,36 25 1,48 7 0,41 16,9 2,2 1,8 0 0,00 1 0,06 23 1,46 291,85211,3416 1,0222 1,40 17 1,08 12 0,76 1,601,3 −25 141 0 0,00 2 0,13 25 1,59 291,85181,1517 1,0819 1,21 22 1,40 9 0,57 15,7 1,60 1,4 0 0,00 1 0,17 0 0,00 172,8991,5391,5340,6861,02 7 1,19 2,52,0 −35 53 0 0,00 0 0,00 2 0,34 142,3791,5391,5391,5361,02 4 0,68 5,9 2,3 1,8 0 0,00 0 0,00 1 0,34 5 1,7241,3831,0331,0372,41 3 1,03 2,31,8 −45 26 0 0,00 0 0,00 1 0,34 6 2,0741,3810,3431,0372,41 4 1,38 2,9 2,4 1,9 0 0,00 0 0,00 0 0,00 1 0,23122,7910 2,3371,6392,09 0 0,00 2,92,2 −55 39 0 0,00 0 0,00 0 0,00 2 0,47133,0292,0940,93 11 2,56 0 0,00 4,3 2,9 2,3 cp = 270 114,25 4,58 6,67 19,25 16,75 21,42 18,25 12,50 7,92 2,42 cp = 290 114,25 3,83 13,00 17,50 18,42 20,75 16,92 11,17 10,17 2,00 270 1371 55 0,36 80 0,53 231 1,52 2011,32257 169219 1,441500,99950,62 29 0,19 152,3 290 1371 46 0,30 156 1,02 210 1,38 2211,452491,632031,331400,921220,80 24 0,16 152,3 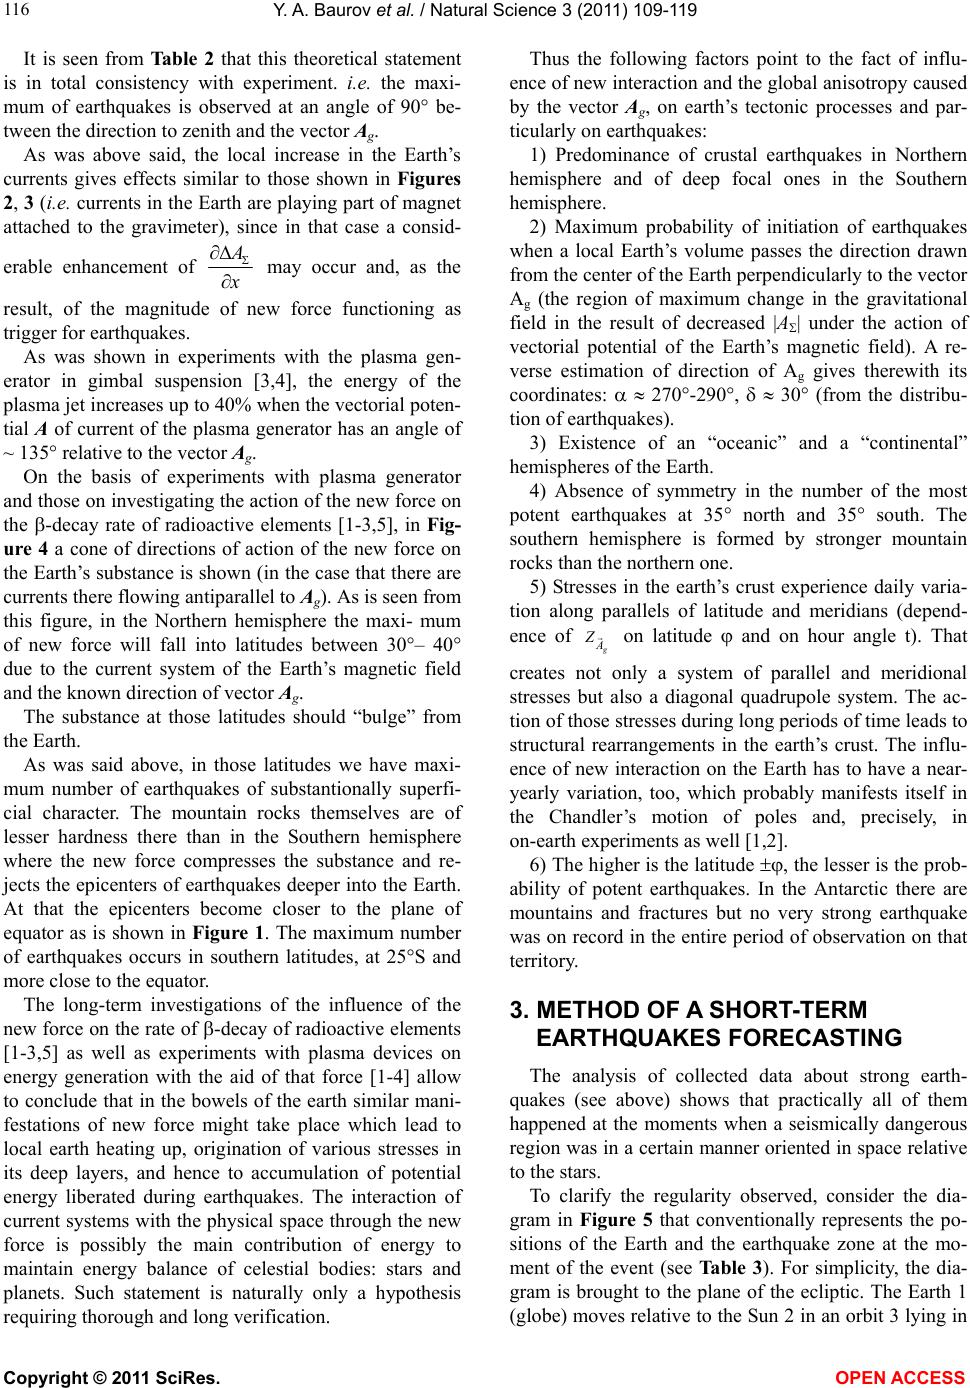 Y. A. Baurov et al. / Natural Science 3 (2011) 109-119 Copyright © 2011 SciRes. OPEN ACCESS 116 It is seen from Table 2 that this theoretical statement is in total consistency with experiment. i.e. the maxi- mum of earthquakes is observed at an angle of 90 be- tween the direction to zenith and the vector Ag. As was above said, the local increase in the Earth’s currents gives effects similar to those shown in Figures 2, 3 (i.e. currents in the Earth are playing part of magnet attached to the gravimeter), since in that case a consid- erable enhancement of may occur and, as the result, of the magnitude of new force functioning as trigger for earthquakes. As was shown in experiments with the plasma gen- erator in gimbal suspension [3,4], the energy of the plasma jet increases up to 40% when the vectorial poten- tial A of current of the plasma generator has an angle of ~ 135 relative to the vector Ag. On the basis of experiments with plasma generator and those on investigating the action of the new force on the -decay rate of radioactive elements [1-3,5], in Fig- ure 4 a cone of directions of action of the new force on the Earth’s substance is shown (in the case that there are currents there flowing antiparallel to Ag). As is seen from this figure, in the Northern hemisphere the maxi- mum of new force will fall into latitudes between 30– 40 due to the current system of the Earth’s magnetic field and the known direction of vector Ag. The substance at those latitudes should “bulge” from the Earth. As was said above, in those latitudes we have maxi- mum number of earthquakes of substantionally superfi- cial character. The mountain rocks themselves are of lesser hardness there than in the Southern hemisphere where the new force compresses the substance and re- jects the epicenters of earthquakes deeper into the Earth. At that the epicenters become closer to the plane of equator as is shown in Figure 1. The maximum number of earthquakes occurs in southern latitudes, at 25S and more close to the equator. The long-term investigations of the influence of the new force on the rate of -decay of radioactive elements [1-3,5] as well as experiments with plasma devices on energy generation with the aid of that force [1-4] allow to conclude that in the bowels of the earth similar mani- festations of new force might take place which lead to local earth heating up, origination of various stresses in its deep layers, and hence to accumulation of potential energy liberated during earthquakes. The interaction of current systems with the physical space through the new force is possibly the main contribution of energy to maintain energy balance of celestial bodies: stars and planets. Such statement is naturally only a hypothesis requiring thorough and long verification. Thus the following factors point to the fact of influ- ence of new interaction and the global anisotropy caused by the vector Ag, on earth’s tectonic processes and par- ticularly on earthquakes: 1) Predominance of crustal earthquakes in Northern hemisphere and of deep focal ones in the Southern hemisphere. 2) Maximum probability of initiation of earthquakes when a local Earth’s volume passes the direction drawn from the center of the Earth perpendicularly to the vector Ag (the region of maximum change in the gravitational field in the result of decreased |А| under the action of vectorial potential of the Earth’s magnetic field). A re- verse estimation of direction of Ag gives therewith its coordinates: 270-290, 30 (from the distribu- tion of earthquakes). 3) Existence of an “oceanic” and a “continental” hemispheres of the Earth. 4) Absence of symmetry in the number of the most potent earthquakes at 35 north and 35 south. The southern hemisphere is formed by stronger mountain rocks than the northern one. 5) Stresses in the earth’s crust experience daily varia- tion along parallels of latitude and meridians (depend- ence of А on latitude and on hour angle t). That creates not only a system of parallel and meridional stresses but also a diagonal quadrupole system. The ac- tion of those stresses during long periods of time leads to structural rearrangements in the earth’s crust. The influ- ence of new interaction on the Earth has to have a near- yearly variation, too, which probably manifests itself in the Chandler’s motion of poles and, precisely, in on-earth experiments as well [1,2]. 6) The higher is the latitude , the lesser is the prob- ability of potent earthquakes. In the Antarctic there are mountains and fractures but no very strong earthquake was on record in the entire period of observation on that territory. 3. METHOD OF A SHORT-TERM EARTHQUAKES FORECASTING The analysis of collected data about strong earth- quakes (see above) shows that practically all of them happened at the moments when a seismically dangerous region was in a certain manner oriented in space relative to the stars. To clarify the regularity observed, consider the dia- gram in Figure 5 that conventionally represents the po- sitions of the Earth and the earthquake zone at the mo- ment of the event (see Table 3). For simplicity, the dia- gram is brought to the plane of the ecliptic. The Earth 1 (globe) moves relative to the Sun 2 in an orbit 3 lying in 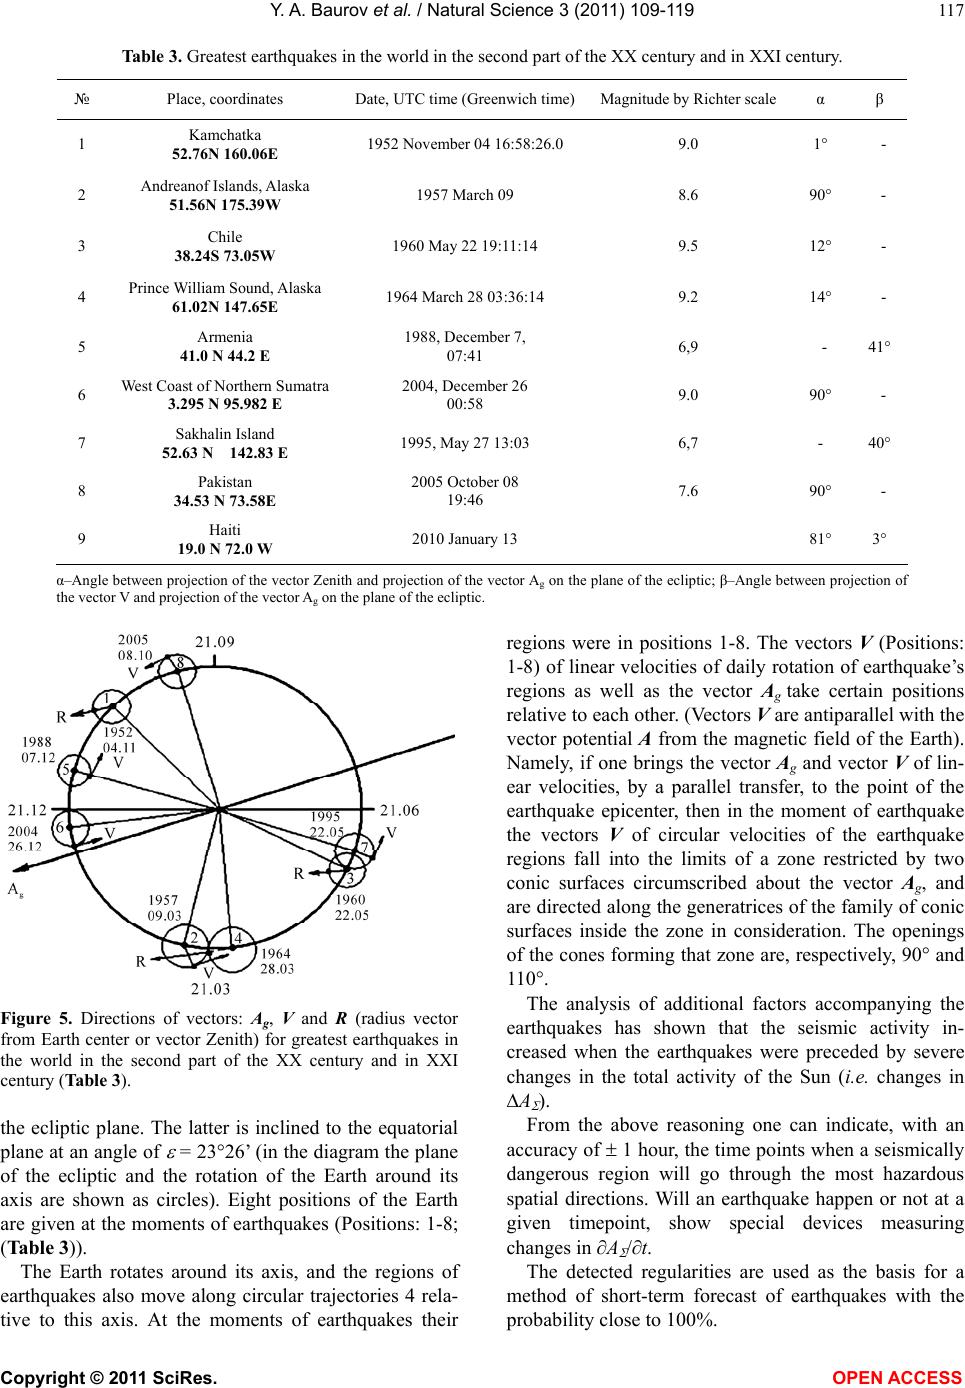 Y. A. Baurov et al. / Natural Science 3 (2011) 109-119 Copyright © 2011 SciRes. OPEN ACCESS 117 Table 3. Greatest earthquakes in the world in the second part of the XX century and in XXI century. № Place, coordinates Date, UTC time (Greenwich time)Magnitude by Richter scale α β 1 Kamchatka 52.76N 160.06E 1952 November 04 16:58:26.0 9.0 1° - 2 Andreanof Islands, Alaska 51.56N 175.39W 1957 March 09 8.6 90° - 3 Chile 38.24S 73.05W 1960 May 22 19:11:14 9.5 12° - 4 Prince William Sound, Alaska 61.02N 147.65E 1964 March 28 03:36:14 9.2 14° - 5 Armenia 41.0 N 44.2 E 1988, December 7, 07:41 6,9 - 41° 6 West Coast of Northern Sumatra 3.295 N 95.982 E 2004, December 26 00:58 9.0 90° - 7 Sakhalin Island 52.63 N 142.83 E 1995, May 27 13:03 6,7 - 40° 8 Pakistan 34.53 N 73.58E 2005 October 08 19:46 7.6 90° - 9 Haiti 19.0 N 72.0 W 2010 January 13 81° 3° α–Angle between projection of the vector Zenith and projection of the vector Ag on the plane of the ecliptic; β–Angle between projection of the vector V and projection of the vector Ag on the plane of the ecliptic. Figure 5. Directions of vectors: Ag, V and R (radius vector from Earth center or vector Zenith) for greatest earthquakes in the world in the second part of the XX century and in XXI century (Table 3). the ecliptic plane. The latter is inclined to the equatorial plane at an angle of = 2326’ (in the diagram the plane of the ecliptic and the rotation of the Earth around its axis are shown as circles). Eight positions of the Earth are given at the moments of earthquakes (Positions: 1-8; (Table 3)). The Earth rotates around its axis, and the regions of earthquakes also move along circular trajectories 4 rela- tive to this axis. At the moments of earthquakes their regions were in positions 1-8. The vectors V (Positions: 1-8) of linear velocities of daily rotation of earthquake’s regions as well as the vector Ag take certain positions relative to each other. (Vectors V are antiparallel with the vector potential A from the magnetic field of the Earth). Namely, if one brings the vector Ag and vector V of lin- ear velocities, by a parallel transfer, to the point of the earthquake epicenter, then in the moment of earthquake the vectors V of circular velocities of the earthquake regions fall into the limits of a zone restricted by two conic surfaces circumscribed about the vector Ag, and are directed along the generatrices of the family of conic surfaces inside the zone in consideration. The openings of the cones forming that zone are, respectively, 90 and 110. The analysis of additional factors accompanying the earthquakes has shown that the seismic activity in- creased when the earthquakes were preceded by severe changes in the total activity of the Sun (i.e. changes in A ). From the above reasoning one can indicate, with an accuracy of 1 hour, the time points when a seismically dangerous region will go through the most hazardous spatial directions. Will an earthquake happen or not at a given timepoint, show special devices measuring changes in A /t. The detected regularities are used as the basis for a method of short-term forecast of earthquakes with the probability close to 100%. 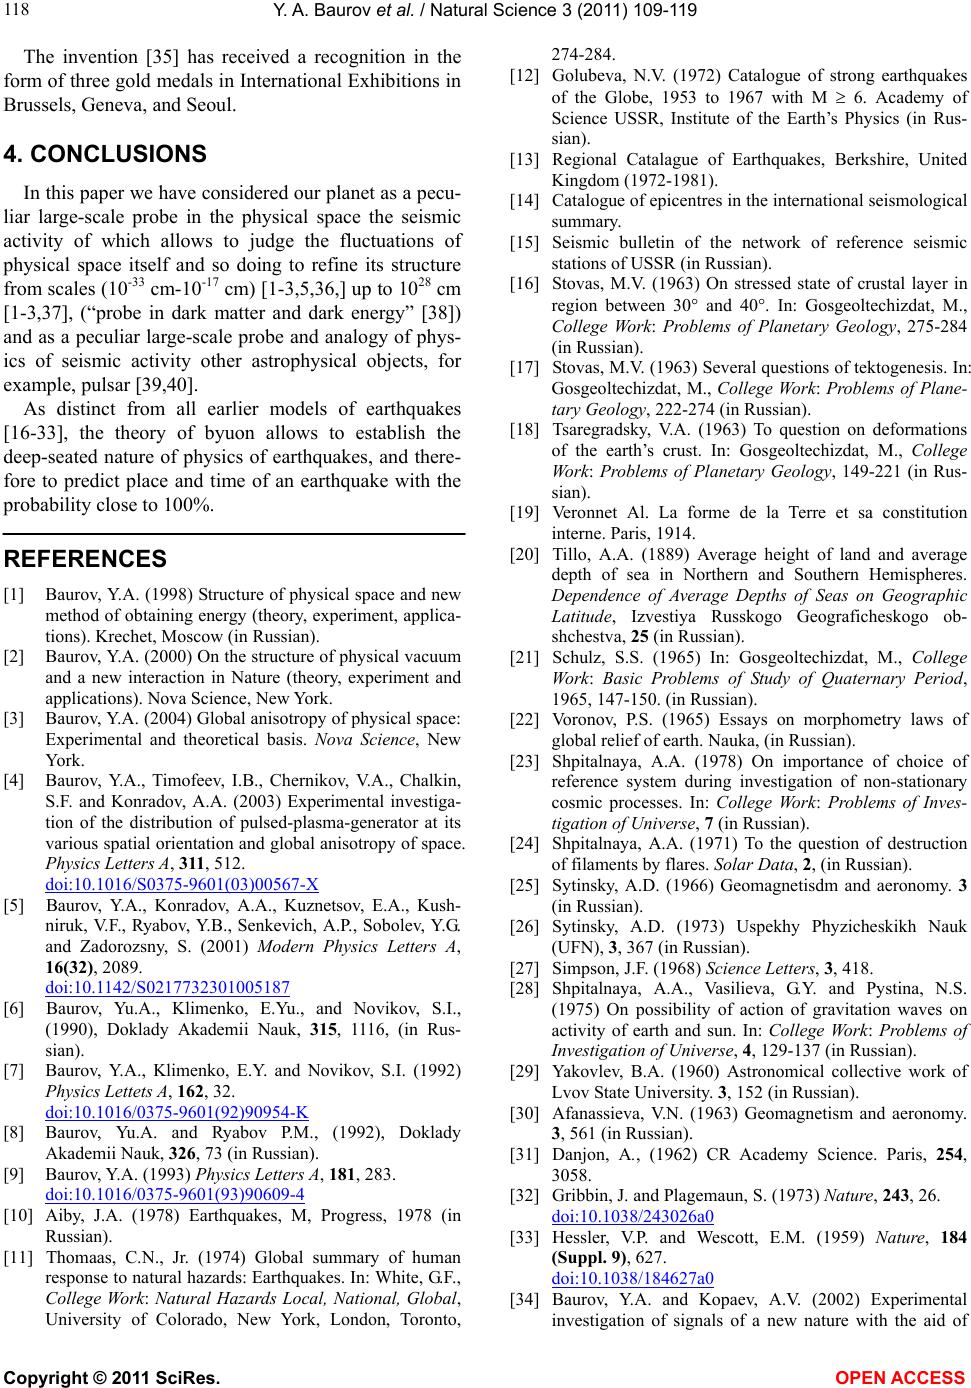 Y. A. Baurov et al. / Natural Science 3 (2011) 109-119 Copyright © 2011 SciRes. OPEN ACCESS 118 The invention [35] has received a recognition in the form of three gold medals in International Exhibitions in Brussels, Geneva, and Seoul. 4. CONCLUSIONS In this paper we have considered our planet as a pecu- liar large-scale probe in the physical space the seismic activity of which allows to judge the fluctuations of physical space itself and so doing to refine its structure from scales (10-33 cm-10-17 cm) [1-3,5,36,] up to 1028 cm [1-3,37], (“probe in dark matter and dark energy” [38]) and as a peculiar large-scale probe and analogy of phys- ics of seismic activity other astrophysical objects, for example, pulsar [39,40]. As distinct from all earlier models of earthquakes [16-33], the theory of byuon allows to establish the deep-seated nature of physics of earthquakes, and there- fore to predict place and time of an earthquake with the probability close to 100%. REFERENCES [1] Baurov, Y.A. (1998) Structure of physical space and new method of obtaining energy (theory, experiment, applica- tions). Krechet, Moscow (in Russian). [2] Baurov, Y.A. (2000) On the structure of physical vacuum and a new interaction in Nature (theory, experiment and applications). Nova Science, New York. [3] Baurov, Y.A. (2004) Global anisotropy of physical space: Experimental and theoretical basis. Nova Science, New York. [4] Baurov, Y.A., Timofeev, I.B., Chernikov, V.A., Chalkin, S.F. and Konradov, A.A. (2003) Experimental investiga- tion of the distribution of pulsed-plasma-generator at its various spatial orientation and global anisotropy of space. Physics Letters A, 311, 512. doi:10.1016/S0375-9601(03)00567-X [5] Baurov, Y.A., Konradov, A.A., Kuznetsov, E.A., Kush- niruk, V.F., Ryabov, Y.B., Senkevich, A.P., Sobolev, Y.G. and Zadorozsny, S. (2001) Modern Physics Letters A, 16(32), 2089. doi:10.1142/S0217732301005187 [6] Baurov, Yu.A., Klimenko, E.Yu., and Novikov, S.I., (1990), Doklady Akademii Nauk, 315, 1116, (in Rus- sian). [7] Baurov, Y.A., Klimenko, E.Y. and Novikov, S.I. (1992) Physics Lettets A, 162, 32. doi:10.1016/0375-9601(92)90954-K [8] Baurov, Yu.A. and Ryabov P.M., (1992), Doklady Akademii Nauk, 326, 73 (in Russian). [9] Baurov, Y.A. (1993) Physics Letters A, 181, 283. doi:10.1016/0375-9601(93)90609-4 [10] Aiby, J.A. (1978) Earthquakes, M, Progress, 1978 (in Russian). [11] Thomaas, C.N., Jr. (1974) Global summary of human response to natural hazards: Earthquakes. In: White, G.F., College Work: Natural Hazards Local, National, Global, University of Colorado, New York, London, Toronto, 274-284. [12] Golubeva, N.V. (1972) Catalogue of strong earthquakes of the Globe, 1953 to 1967 with M 6. Academy of Science USSR, Institute of the Earth’s Physics (in Rus- sian). [13] Regional Catalague of Earthquakes, Berkshire, United Kingdom (1972-1981). [14] Catalogue of epicentres in the international seismological summary. [15] Seismic bulletin of the network of reference seismic stations of USSR (in Russian). [16] Stovas, M.V. (1963) On stressed state of crustal layer in region between 30 and 40. In: Gosgeoltechizdat, M., College Work: Problems of Planetary Geology, 275-284 (in Russian). [17] Stovas, M.V. (1963) Several questions of tektogenesis. In: Gosgeoltechizdat, M., College Work: Problems of Plane- tary Geology, 222-274 (in Russian). [18] Tsaregradsky, V.A. (1963) To question on deformations of the earth’s crust. In: Gosgeoltechizdat, M., College Work: Problems of Planetary Geology, 149-221 (in Rus- sian). [19] Veronnet Al. La forme de la Terre et sa constitution interne. Paris, 1914. [20] Tillo, A.A. (1889) Average height of land and average depth of sea in Northern and Southern Hemispheres. Dependence of Average Depths of Seas on Geographic Latitude, Izvestiya Russkogo Geograficheskogo ob- shchestva, 25 (in Russian). [21] Schulz, S.S. (1965) In: Gosgeoltechizdat, M., College Work: Basic Problems of Study of Quaternary Period, 1965, 147-150. (in Russian). [22] Voronov, P.S. (1965) Essays on morphometry laws of global relief of earth. Nauka, (in Russian). [23] Shpitalnaya, A.A. (1978) On importance of choice of reference system during investigation of non-stationary cosmic processes. In: College Work: Problems of Inves- tigation of Universe, 7 (in Russian). [24] Shpitalnaya, A.A. (1971) To the question of destruction of filaments by flares. Solar Data, 2, (in Russian). [25] Sytinsky, A.D. (1966) Geomagnetisdm and aeronomy. 3 (in Russian). [26] Sytinsky, A.D. (1973) Uspekhy Phyzicheskikh Nauk (UFN), 3, 367 (in Russian). [27] Simpson, J.F. (1968) Science Letters, 3, 418. [28] Shpitalnaya, A.A., Vasilieva, G.Y. and Pystina, N.S. (1975) On possibility of action of gravitation waves on activity of earth and sun. In: College Work: Problems of Investigation of Universe, 4, 129-137 (in Russian). [29] Yakovlev, B.A. (1960) Astronomical collective work of Lvov State University. 3, 152 (in Russian). [30] Afanassieva, V.N. (1963) Geomagnetism and aeronomy. 3, 561 (in Russian). [31] Danjon, A., (1962) CR Academy Science. Paris, 254, 3058. [32] Gribbin, J. and Plagemaun, S. (1973) Nature, 243, 26. doi:10.1038/243026a0 [33] Hessler, V.P. and Wescott, E.M. (1959) Nature, 184 (Suppl. 9), 627. doi:10.1038/184627a0 [34] Baurov, Y.A. and Kopaev, A.V. (2002) Experimental investigation of signals of a new nature with the aid of  Y. A. Baurov et al. / Natural Science 3 (2011) 109-119 Copyright © 2011 SciRes. OPEN ACCESS 119 two high precision stationary quartz gravimeters. Had- ronic Journal, 25, 697. [35] Baurov, Y.A., Baurov, A.Y., Baurov, A.Y., Shpitalnaya, A.A., Abramyan, A.A. and Solodovnikov, V.A. (2006) Method of short-term forecasting heightened seismic danger of seismically dangerous regions. Invention, 2006110310 RF. [36] Baurov, Y.A., et al. (2007) Physics of atomic nuclei. 70, 1825; Yadernaya fizika, 70, 1875. [37] Baurov, Y.A. (2009) La Trama Svelata, La Teoria Byuon: dall’origine dell’ Universo alla tecnlogia del futuro, pas- sando per I’Uomo. Edizioni Polistampa. [38] Baurov, Y.A. and Malov, I.F. (2010) Journal of Modern Physics, 1, 17. doi:10.4236/jmp.2010.11003 [39] Baurov, Y.A., Shpitalnaya, A.A. and Malov, I.F. (2005) International Journal of Pure & applied Physics, 1, 71. [40] Malov, I.F. and Baurov Y.A. (2007) Astronomy Reports, 51, 830. doi:10.1134/S1063772907100071
|