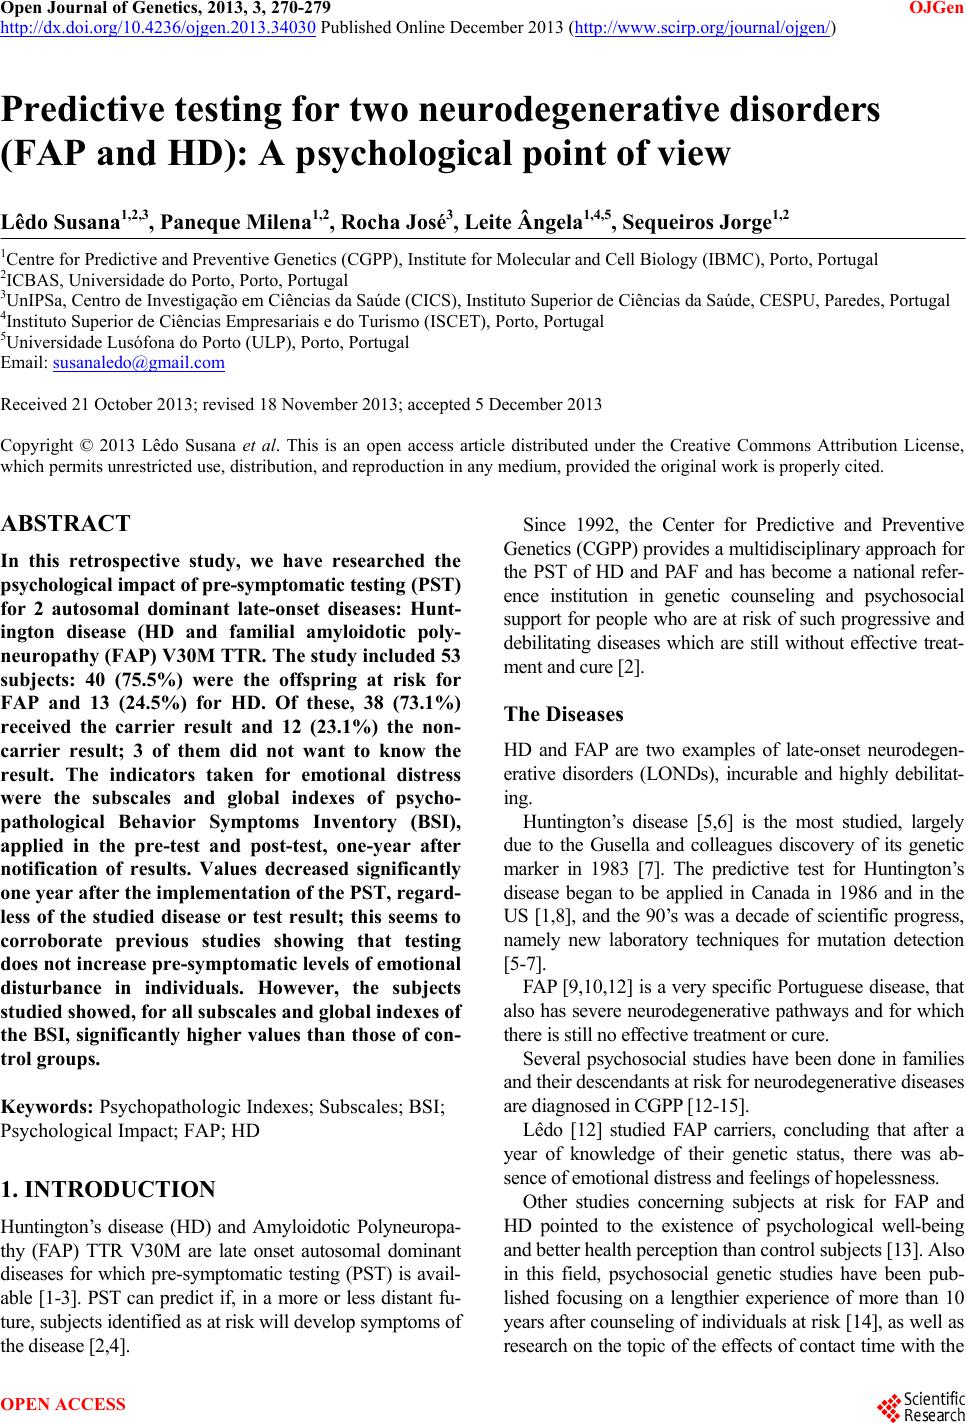
 Open Journal of Genetics, 2013, 3, 270-279 OJGen http://dx.doi.org/10.4236/ojgen.2013.34030 Published Online December 2013 (http://www.scirp.org/journal/ojgen/) Predictive testing for two neurodegenerative disorders (FAP and HD): A psychological point of view Lêdo Susana1,2,3, Paneque Milena1,2, Rocha José3, Leite Ângela1,4,5, Sequeiros Jorge1,2 1Centre for Predictive and Preventive Genetics (CGPP), Institute for Molecular and Cell Biology (IBMC), Porto, Portugal 2ICBAS, Universidade do Porto, Porto, Portugal 3UnIPSa, Centro de Investigação em Ciências da Saúde (CICS), Instituto Superior de Ciências da Saúde, CESPU, Paredes, Portugal 4Instituto Superior de Ciências Empresariais e do Turismo (ISCET), Porto, Portugal 5Universidade Lusófona do Porto (ULP), Porto, Portugal Email: susanaledo@gmail.com Received 21 October 2013; revised 18 November 2013; accepted 5 December 2013 Copyright © 2013 Lêdo Susana et al. This is an open access article distributed under the Creative Commons Attribution License, which permits unrestricted use, distribution, and reproduction in any medium, provided the original work is properly cited. ABSTRACT In this retrospective study, we have researched the psychological impact of pre-symptomatic testing ( P S T ) for 2 autosomal dominant late-onset diseases: Hunt- ington disease (HD and familial amyloidotic poly- neuropathy (FAP) V30M TTR. The study included 53 subjects: 40 (75.5%) were the offspring at risk for FAP and 13 (24.5%) for HD. Of these, 38 (73.1%) received the carrier result and 12 (23.1%) the non- carrier result; 3 of them did not want to know the result. The indicators taken for emotional distress were the subscales and global indexes of psycho- pathological Behavior Symptoms Inventory (BSI), applied in the pre-test and post-test, one-year after notification of results. Values decreased significantly one year after the implementation of the PST, regard- less of the studied disease or test result; this seems to corroborate previous studies showing that testing does not increase pre-symptomatic levels of emotional disturbance in individuals. However, the subjects studied showed, for all subscales and global indexes of the BSI, significantly higher values than those of con- trol groups. Keywords: Psychopathologic Indexes; Subscales; BSI; Psychological Impact; FAP; HD 1. INTRODUCTION Huntington’s disease (HD) and Amyloidotic Polyneuropa- thy (FAP) TTR V30M are late onset autosomal dominant diseases for which pre-symptomatic testing (PST) is avail- able [1-3]. PST can predict if, in a more or less distant fu- ture, subjects identified as at risk will develop symptoms of the disease [2,4]. Since 1992, the Center for Predictive and Preventive Genetics (CGPP) provides a multidisciplinary approach for the PST of HD and PAF and has become a national refer- ence institution in genetic counseling and psychosocial support for people who are at risk of such progressive and debilitating diseases which are still without effective treat- ment and cure [2]. The Diseases HD and FAP are two examples of late-onset neurodegen- erative disorders (LONDs), incurable and highly debilitat- ing. Huntington’s disease [5,6] is the most studied, largely due to the Gusella and colleagues discovery of its genetic marker in 1983 [7]. The predictive test for Huntington’s disease began to be applied in Canada in 1986 and in the US [1,8], and the 90’s was a decade of scientific progress, namely new laboratory techniques for mutation detection [5-7]. FAP [9,10,12] is a very specific Portuguese disease, that also has severe neurodegenerative pathways and for which there is still no effective treatment or cure. Several psychosocial studies have been done in families and their descendants at risk for neurodegenerative diseases are diagnosed in CGPP [12-15]. Lêdo [12] studied FAP carriers, concluding that after a year of knowledge of their genetic status, there was ab- sence of emotional distress and feelings of hopelessness. Other studies concerning subjects at risk for FAP and HD pointed to the existence of psychological well-being and better health perception than control subjects [13]. Also in this field, psychosocial genetic studies have been pub- lished focusing on a lengthier experience of more than 10 years after counseling of individuals at risk [14], as well as research on the topic of the effects of contact time with the OPEN ACCESS  L. Susana et al. / Open Journal of Genetics 3 (2013) 270-279 271 disease or the parent affected in the psychological outcome of PST [15]. Despite the different approaches, there are still issues regarding the impact of the application of PST to diseases with similar first symptoms at the early adulthood and a degenerative path, but with different treatment options and clinical outcomes (e.g. the psychiatric disorders, unique to Huntington’s disease). It continues to be relevant to re- search to correlate the psychological impact of the test re- sults with other variables such as cultural and socio-demo- graphic profile of this population. Hence, the following was established as objectives of this research: 1) to com- pare the BSI psychopathological indices observed before and one year after completion of the PST and 2) to differ- entiate psychological impact related to a type of risk dis- ease, carrier or non-carrier status and demographic vari- ables (age, gender, marital status) included in the general protocol. 2. MATERIAL AND METHODS A retrospective study of clinical files was designed based on subjects who underwent pre-symptomatic testing for genetic autosomal dominant diseases with late onset (HD and FAP), in CGPP, between 2000 and 2010. These files contained data regarding the psychological evaluations conducted along the four moments of the general psy- chological evaluation protocol: 1) 1st moment, pre-test, prior to the genetic test; 2) 2nd moment, three weeks after receiving the test result and knowing the genetic status; 3) 3rd moment, six months after disclosure; 4) 4th moment, one year after disclosure. In the present study only two specific moments were considered, corresponding to the psychopathological inventory here applied: pre-test, 1st moment a, and one year after disclosure (post-test or 4th moment d). 2.1. Subjects The initial sample (Table 1) comprised 686 subjects at baseline: 586 (85.4%) came in to undertake the pre- symptomatic test for FAP, 92 (13.4%) for HD and 8 (1.2%) for MJD (Machado Joseph Disease). 58.6% of the subjects were female. It was found that 51.3% of the participants were single, 44.7% were married. From the initial total, 29 did not appear to receive the test result, 352 (51.6%) were given a positive result as carriers and 305 (44.7%) received the result of non-carriers for the tested condition. At any of the given four moments of the general protocol some participants abandoned the intended follow-ups. The presumed causes for this out- come are either being given the result of non-carriers, hence no recognition of need to stay in the study or being given the result of carrier, unwillingness to follow protocol. This is why there was a sharp decline in the subject number at the post-test one year later. Men and women have proven to be equivalent in their distribution regarding the criteria age (X2 = 636.939, df = 625, p = 0.362), marital status (X2 = 5.733, df = 2, p = 0.057), and the outcome of test result (X2 = 2.446, df = 2, p = 0.294). However, we found that from initial 686 subjects, only 53 attended the 4th moment. Thus, we decided to compare only the BSI values of these 53 subjects who were present in the 1st and 4th moment of evaluation and considered solely FAP and HD subjects since there were just one subject at 4th moment for MJD (Table 2). Then the sample comprises 53 subjects with an aver- age age of 35.19 years (SD = 10.11 years, between 21 and 60 years) (Table 2): 40 (75.5%) came in to under- take the pre-symptomatic test for FAP and 13 (24.5%) for HD. 60.4% (32) of the subjects were female. It was found that 46.2% (24) of the participants were single, Table 1. Sample Characteristics along the four moments of the general psychological evaluation protocol. Pre Test a (N = 686) Post Test b (N = 290) Post Test c (N = 143) Post Test d (N = 54) FAP HD MJD FAP HD MJD FAP HD MJD FAP HD MJD N 586 92 8 248 38 4 114 25 4 40 13 1 Gender F 340 M 246 F 54 M 38 F 8 M 0 F 146 M 102 F 20 M 18 F 4 M 0 F 64 M 50 F 14 M 11 F 4 M 0 F 25 M 15 F 7 M 6 F 1 M 0 Mean Age 35.09 43.69 38.75 34.83 46.45 48.00 34.68 45.24 48.00 31.85 45.46 37.00 Marital Status S 320 M 239 D 10 W 8 S 27 M 59 D 0 W 0 S 2 M 6 D 0 W 0 S 134 M 104 D 3 W 3 S 13 M 23 D 1 W 1 S 1 M 3 D 0 W 0 S 59 M 52 D 0 W 1 S 9 M 14 D 1 W 1 S 1 M 3 D 0 W 0 S 22 M 17 D 0 W 0 S 2 M 11 D 0 W 0 S 0 M 1 D 0 W 0 Test Result NC 311 C 254 DK 17 NC 39 C 45 DK 8 NC 2 C 6 DK 0 NC 124 C 117 DK 5 NC 16 C 21 DK 1 NC 0 C 4 DK 0 NC 47 C 62 DK 3 NC 5 C19 DK 1 NC 0 C 4 DK 0 NC 10 C 29 DK 0 NC 2 C 9 DK 2 NC 0 C 1 DK 0 Gender (Female; Male); Marital Status (Single; Married; Divorced; Widow); Test Result (Non-Carrier; Carrier; Don’t know). Copyright © 2013 SciRes. OPEN ACCESS  L. Susana et al. / Open Journal of Genetics 3 (2013) 270-279 272 Table 2. Sample characteristics of the 53 subjects that finished the general psychological evaluation protocol. Total Pre-Test N 53 100% Gender F-32 M-21 F-60.4% M-39.6% Age 35.19 10.1 Marital Status S-24 M-29 S-46.2% M-53.8% Gender (Female; Male); Marital Status (Single; Married; Divorced; Widow); Test Result (Non-Carrier; Carrier; Don’t know). 53.8% (28) were married. 38 (73.1%) were given a posi- tive result as carriers and 12 (23.1%) received the result of non-carriers for the tested condition; 3 (5.7%) subjects decided not to know their genetic result (this result can- not be known by us, until the subject know it). 2.2. Procedure The PST protocol queries for neurodegenerative dis- eases in CGPP have been published elsewhere [2]. In the context of the protocol, each subject answered the BSI inventory at two stages: 1) pre-test, the first psychological evaluation—comprises a survey and eva- luation of the motivations that led the person to pre- symptomatic testing, exploring his/her own decision making processes and detection of emotional distress that might jeopardize a good adjustment to the predictive test result, 2) post-test, one year after reporting the genetic test result. The socio-demographic variables (gender, age and marital status) and medical history were collected at the first psychological evaluation. The psychological variables were collected by ap- plying the Brief Symptom Inventory—BSI [16]—adap- ted for the Portuguese population by Canavarro [17,18]. The above mentioned inventory has 53 items rated on a Likert scale of five grades (0 “rarely” to 4 “very of- ten”). It evaluates the psychopathological symptoms considering nine dimensions and three global indices [16], which translate psychometric ratings of emotional distress and its dimensions are: somatization (items 2, 7, 23, 29, 30, 33, 37), obsessive-compulsive (items 5, 15, 26, 27, 32, 36), interpersonal sensitivity (items 20, 21, 22, 42), depression (items 9, 16, 17, 18, 35, 50), anxiety (items 1, 12, 19, 38, 45, 49), hostility (items 6, 13, 40, 31, 46), phobic anxiety (items 8, 28, 31, 43, 47), para- noid ideation (items 4, 10, 24, 48, 51), and psychosis (or psychoticism) (items 3, 14, 34, 44, and 53). In addition to the subscales, this inventory includes three indices that capture global psychological distress: 1) global severity index (GSI), which is the average of all subscale scores (e.g., 53, if there are no answers blank), 2) positive symptoms total (PST), which is the number of items endorsed at a level higher than zero, 3) positive symptom distress index (PSD), which corre- sponds to the sum of all item values divided by the PST. A PSD index ≥ 1.7 reflects the possible presence of emotional disturbance and “a lower value is present in the general population” [18]. 2.3. Data Analysis Statistical analysis was performed using the Statistical Program for Social Sciences (SPSS), version 18.0 for Windows. The differences between groups, regarding the psy- chological measurements, were tested with the Student’s t test and ANOVA; we also use regression analysis in order to make predictions of some variables. 3. RESULTS 3.1. Pre-Test At this stage, the average values of the BSI subscales, as well as the average indices of the inventory, basically revealed the absence of emotional pathology. If the val- ues presented by Canavarro [17] for the general popula- tion are taken as reference, the values of the BSI, at the pre-test stage, are higher. However, they are still lower than the portuguese population considered to be suffering from emotional disturbance [17], as can be seen in Table 3. When compared the BSI variables with some socio- demographic variable, no significantly different values in all subscales were found at the pre-test stage for the gender and age variables. A socio-demographic variable that showed some sta- tistically significant results was marital status. The soma- tization subscale revealed statistically significant differ- ent values in relation to marital status: single had lower average scores of somatization than married (Table 4). Another socio-demographic variable that showed sta- tistically significant results was type of disease. The somatization subscale revealed statistically significant different values in relation to type of disease: subjects at risk for FAP had lower average scores of somatization than subjects at risk for HD (Table 5). 3.2. Post-Test Regarding the post-test BSI (BSId) implementation, the average scores obtained on the subscales and indixes decreased when compared to pre-test BSI (BSIa) (Table 6). With respect to the subjects at risk for FAP, the values Copyright © 2013 SciRes. OPEN ACCESS  L. Susana et al. / Open Journal of Genetics 3 (2013) 270-279 273 Table 3. Comparison of the average values for the subscales and indices of the BSI at pre-test with normalization references for the Portuguese general population and disturbed population (Canavarro, 1999). Averages and indexes of the subscales at pre-test General Population Canavarro (1999) Emotional Disturbed Population. Canavarro (1999) Subscales N Mean SD Mean SD Mean SD Somatization 53 4.226 4.734 0.573 0.916 9.445 7.032 Obs. compulsive 53 5.906 4.143 1.290 0.878 11.534 5.567 Interp. sensitivity 53 3.094 2.870 0.958 0.727 6.404 4.143 Depression 53 4.094 4.221 0.893 0.722 11.034 6.275 Anxiety 53 4.415 3.734 0.942 0.766 10.521 5.658 Hostility 53 3.877 3.238 0.894 0.784 7.034 4.529 Phobic anxiety 53 2.038 2.572 0.418 0.663 5.082 4.656 Paranoid ideat 53 4.472 3.195 1.063 0.789 7.651 4.263 Psychosis 53 2.717 3.066 0.668 0.614 7.021 4.140 Indexes N Mean SD GSI 53 0.703 0.526 0.835 0.480 1.430 0.705 PST 53 23.132 12.862 26.993 11.724 37.349 12.166 PSD 53 1.506 0.382 1.561 0.385 2.111 0.595 Table 4. Comparison between average values of the subscales and indexes of the BSI in relation to the variable marital status at pre-test. Subscales BSIa Mean N F Sig. Single 2.750 24 Somatization Married 5.321 29 4.044 0.050 Table 5. Comparison between average values of the subscales and indexes of the BSI in relation to the type of disease at pre- test. Subscales BSIa Mean N F Sig. FAP 3.450 40 Somatization HD 6.615 13 4.699 0.035 of the BSI subscales and indexes are also lower at post- test moment than at the pre-test. The same applies to sub- jects at risk for HD. When comparing samples for FAP and HD, we found that in the pre-test subjects at risk for HD present higher values for all BSI subscales and in- dexes, except for phobic anxiety and paranoid ideation subscales. The subjects who transitioned from pre-test moment to post-test are mainly carriers (Table 7). When comparing carriers and non carriers samples, at post-test, we found that carriers present higher values for all BSI subscales and indexes, except for hostility, para- noid ideation and psychosis subscale and PSD. When comparing samples of FAP and HD carriers, at post-test, we found that HD carriers present higher val- ues for all BSI subscales and indexes, except paranoid ideation subscale and PSD. If we compare samples of FAP and HD non carriers, at post-test, we found that FAP non carriers present higher values for all BSI subscales and indexes; this can be ex- plained by the low number of HD non carriers that re- mained in the protocol. However, the differences between the averages of the subscales and indexes regarding the sociodemographic variables (gender, age, marital status) and type of disease and test result variables are not statistically significant. 3.3. Comparison between the BSI Subscales in the Two Moments It was found that the average values for all subscales of the BSI declined significantly after the year in which the outcome of PST was made (p < 0.05) (Table 8). There was also a decrease in the average values obtained for the scores of GSI (t = 3.837; df = 53; p = 0.00) and PST (t = 4.140, df = 53, p = 0.00). From the PSD it was possible to know the degree of pathology, with reference to the score 1.7 as the cut point from which emotional disturbance is revealed [17] (Ca- navarro et al., 1999) (Table 8). In no time, the PSD value equaled or exceeded the cut point. Copyright © 2013 SciRes. OPEN ACCESS 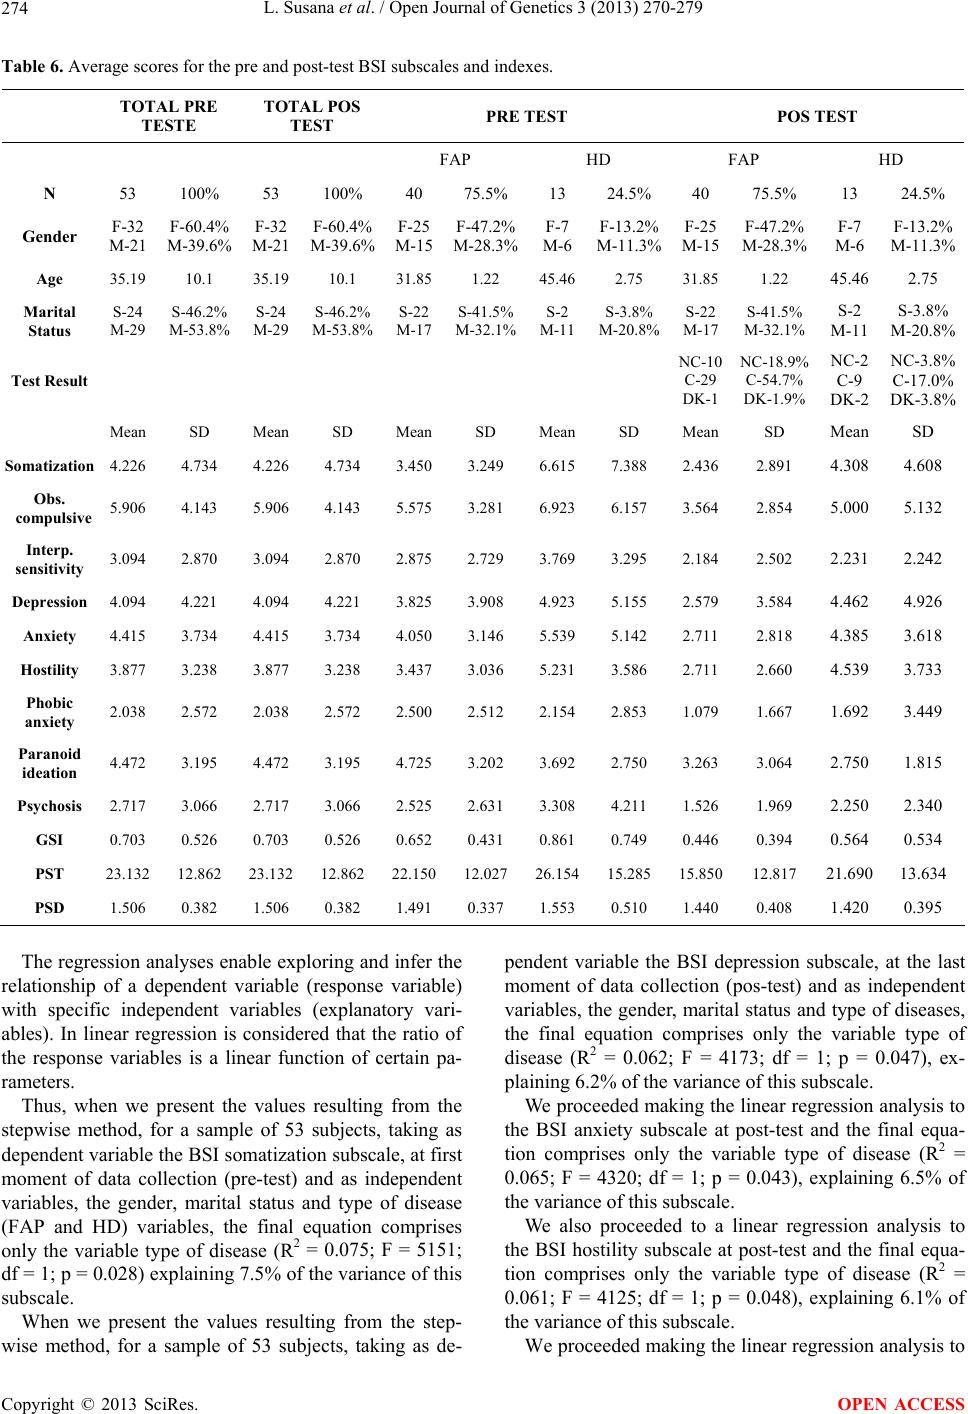 L. Susana et al. / Open Journal of Genetics 3 (2013) 270-279 274 Table 6. Average scores for the pre and post-test BSI subscales and indexes. TOTAL PRE TESTE TOTAL POS TEST PRE TEST POS TEST FAP HD FAP HD N 53 100% 53 100% 40 75.5% 13 24.5% 40 75.5% 13 24.5% Gender F-32 M-21 F-60.4% M-39.6% F-32 M-21 F-60.4% M-39.6% F-25 M-15 F-47.2% M-28.3% F-7 M-6 F-13.2% M-11.3% F-25 M-15 F-47.2% M-28.3% F-7 M-6 F-13.2% M-11.3% Age 35.19 10.1 35.19 10.1 31.85 1.22 45.46 2.75 31.851.22 45.46 2.75 Marital Status S-24 M-29 S-46.2% M-53.8% S-24 M-29 S-46.2% M-53.8% S-22 M-17 S-41.5% M-32.1% S-2 M-11 S-3.8% M-20.8% S-22 M-17 S-41.5% M-32.1% S-2 M-11 S-3.8% M-20.8% Test Result NC-10 C-29 DK-1 NC-18.9% C-54.7% DK-1.9% NC-2 C-9 DK-2 NC-3.8% C-17.0% DK-3.8% Mean SD Mean SD Mean SD Mean SD MeanSD Mean SD Somatization 4.226 4.734 4.226 4.734 3.450 3.249 6.615 7.388 2.4362.891 4.308 4.608 Obs. compulsive 5.906 4.143 5.906 4.143 5.575 3.281 6.923 6.157 3.5642.854 5.000 5.132 Interp. sensitivity 3.094 2.870 3.094 2.870 2.875 2.729 3.769 3.295 2.1842.502 2.231 2.242 Depression 4.094 4.221 4.094 4.221 3.825 3.908 4.923 5.155 2.5793.584 4.462 4.926 Anxiety 4.415 3.734 4.415 3.734 4.050 3.146 5.539 5.142 2.7112.818 4.385 3.618 Hostility 3.877 3.238 3.877 3.238 3.437 3.036 5.231 3.586 2.7112.660 4.539 3.733 Phobic anxiety 2.038 2.572 2.038 2.572 2.500 2.512 2.154 2.853 1.0791.667 1.692 3.449 Paranoid ideation 4.472 3.195 4.472 3.195 4.725 3.202 3.692 2.750 3.2633.064 2.750 1.815 Psychosis 2.717 3.066 2.717 3.066 2.525 2.631 3.308 4.211 1.5261.969 2.250 2.340 GSI 0.703 0.526 0.703 0.526 0.652 0.431 0.861 0.749 0.4460.394 0.564 0.534 PST 23.132 12.862 23.132 12.862 22.15012.027 26.15415.285 15.85012.817 21.69013.634 PSD 1.506 0.382 1.506 0.382 1.491 0.337 1.553 0.510 1.4400.408 1.420 0.395 The regression analyses enable exploring and infer the relationship of a dependent variable (response variable) with specific independent variables (explanatory vari- ables). In linear regression is considered that the ratio of the response variables is a linear function of certain pa- rameters. Thus, when we present the values resulting from the stepwise method, for a sample of 53 subjects, taking as dependent variable the BSI somatization subscale, at first moment of data collection (pre-test) and as independent variables, the gender, marital status and type of disease (FAP and HD) variables, the final equation comprises only the variable type of disease (R2 = 0.075; F = 5151; df = 1; p = 0.028) explaining 7.5% of the variance of this subscale. When we present the values resulting from the step- wise method, for a sample of 53 subjects, taking as de- pendent variable the BSI depression subscale, at the last moment of data collection (pos-test) and as independent variables, the gender, marital status and type of diseases, the final equation comprises only the variable type of disease (R2 = 0.062; F = 4173; df = 1; p = 0.047), ex- plaining 6.2% of the variance of this subscale. We proceeded making the linear regression analysis to the BSI anxiety subscale at post-test and the final equa- tion comprises only the variable type of disease (R2 = 0.065; F = 4320; df = 1; p = 0.043), explaining 6.5% of the variance of this subscale. We also proceeded to a linear regression analysis to the BSI hostility subscale at post-test and the final equa- tion comprises only the variable type of disease (R2 = 0.061; F = 4125; df = 1; p = 0.048), explaining 6.1% of the variance of this subscale. We proceeded making the linear regression analysis to Copyright © 2013 SciRes. OPEN ACCESS 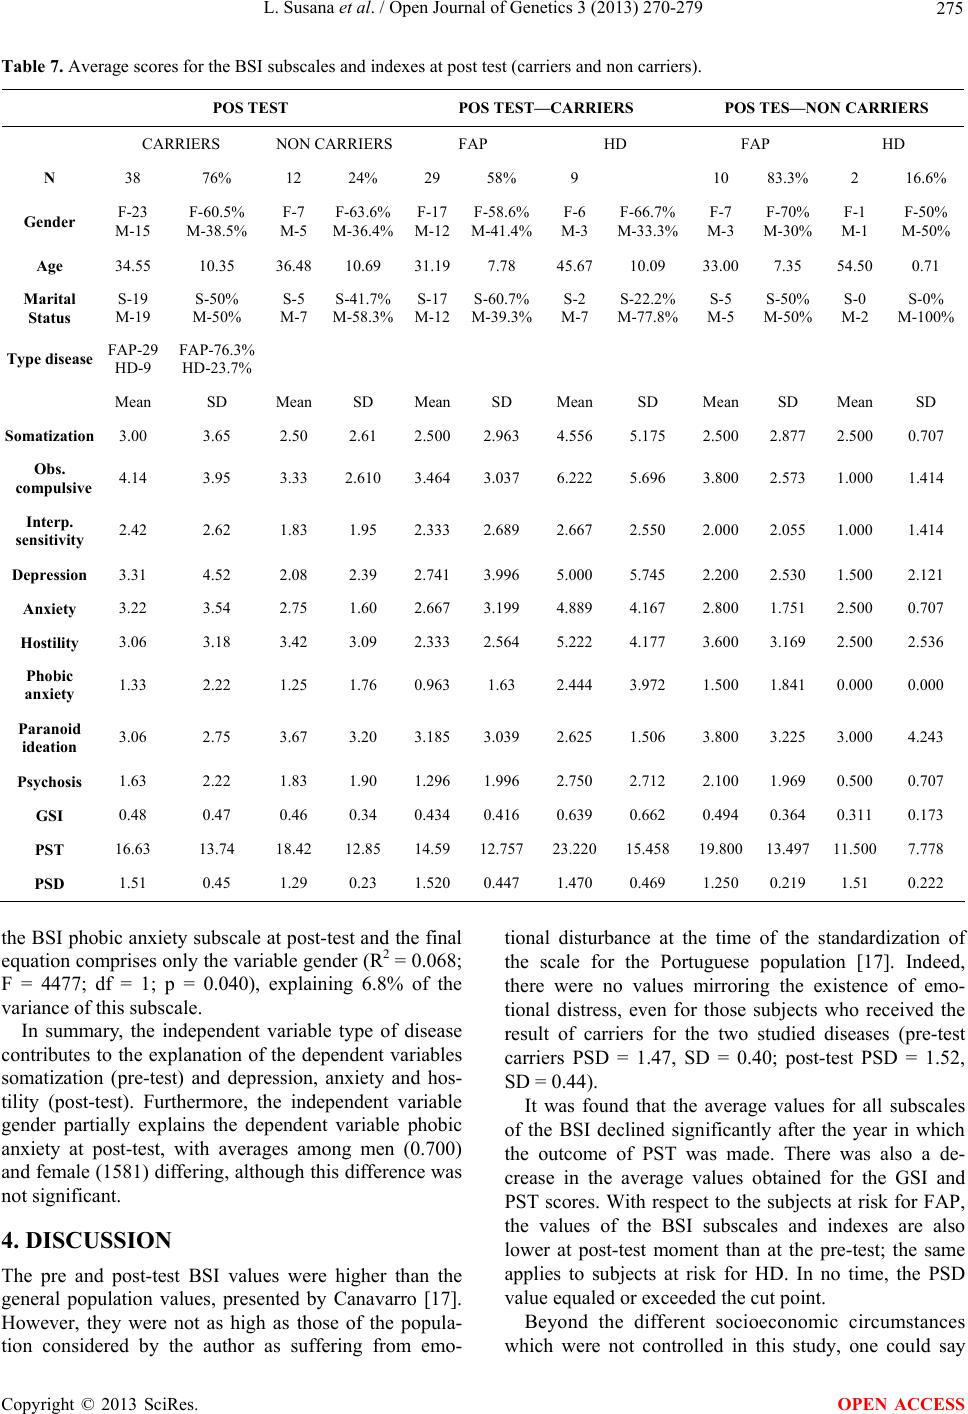 L. Susana et al. / Open Journal of Genetics 3 (2013) 270-279 275 Table 7. Average scores for the BSI subscales and indexes at post test (carriers and non carriers). POS TEST POS TEST—CARRIERS POS TES—NON CARRIERS CARRIERS NON CARRIERSFAP HD FAP HD N 38 76% 12 24% 29 58% 9 10 83.3% 2 16.6% Gender F-23 M-15 F-60.5% M-38.5% F-7 M-5 F-63.6% M-36.4% F-17 M-12 F-58.6% M-41.4% F-6 M-3 F-66.7% M-33.3% F-7 M-3 F-70% M-30% F-1 M-1 F-50% M-50% Age 34.55 10.35 36.48 10.69 31.197.78 45.6710.09 33.00 7.35 54.500.71 Marital Status S-19 M-19 S-50% M-50% S-5 M-7 S-41.7% M-58.3% S-17 M-12 S-60.7% M-39.3% S-2 M-7 S-22.2% M-77.8% S-5 M-5 S-50% M-50% S-0 M-2 S-0% M-100% Type disease FAP-29 HD-9 FAP-76.3% HD-23.7% Mean SD Mean SD Mean SD MeanSD Mean SD MeanSD Somatization 3.00 3.65 2.50 2.61 2.5002.963 4.5565.175 2.500 2.877 2.5000.707 Obs. compulsive 4.14 3.95 3.33 2.610 3.4643.037 6.2225.696 3.800 2.573 1.0001.414 Interp. sensitivity 2.42 2.62 1.83 1.95 2.3332.689 2.6672.550 2.000 2.055 1.0001.414 Depression 3.31 4.52 2.08 2.39 2.7413.996 5.000 5.745 2.200 2.530 1.5002.121 Anxiety 3.22 3.54 2.75 1.60 2.6673.199 4.889 4.167 2.800 1.751 2.5000.707 Hostility 3.06 3.18 3.42 3.09 2.3332.564 5.2224.177 3.600 3.169 2.5002.536 Phobic anxiety 1.33 2.22 1.25 1.76 0.9631.63 2.4443.972 1.500 1.841 0.0000.000 Paranoid ideation 3.06 2.75 3.67 3.20 3.1853.039 2.6251.506 3.800 3.225 3.0004.243 Psychosis 1.63 2.22 1.83 1.90 1.2961.996 2.7502.712 2.100 1.969 0.5000.707 GSI 0.48 0.47 0.46 0.34 0.4340.416 0.6390.662 0.494 0.364 0.3110.173 PST 16.63 13.74 18.42 12.85 14.59 12.757 23.22015.458 19.800 13.497 11.5007.778 PSD 1.51 0.45 1.29 0.23 1.5200.447 1.4700.469 1.250 0.219 1.51 0.222 the BSI phobic anxiety subscale at post-test and the final equation comprises only the variable gender (R2 = 0.068; F = 4477; df = 1; p = 0.040), explaining 6.8% of the variance of this subscale. In summary, the independent variable type of disease contributes to the explanation of the dependent variables somatization (pre-test) and depression, anxiety and hos- tility (post-test). Furthermore, the independent variable gender partially explains the dependent variable phobic anxiety at post-test, with averages among men (0.700) and female (1581) differing, although this difference was not significant. 4. DISCUSSION The pre and post-test BSI values were higher than the general population values, presented by Canavarro [17]. However, they were not as high as those of the popula- tion considered by the author as suffering from emo- tional disturbance at the time of the standardization of the scale for the Portuguese population [17]. Indeed, there were no values mirroring the existence of emo- tional distress, even for those subjects who received the result of carriers for the two studied diseases (pre-test carriers PSD = 1.47, SD = 0.40; post-test PSD = 1.52, SD = 0.44). It was found that the average values for all subscales of the BSI declined significantly after the year in which the outcome of PST was made. There was also a de- crease in the average values obtained for the GSI and PST scores. With respect to the subjects at risk for FAP, the values of the BSI subscales and indexes are also lower at post-test moment than at the pre-test; the same applies to subjects at risk for HD. In no time, the PSD value equaled or exceeded the cut point. Beyond the different socioeconomic circumstances which were not controlled in this study, one could say Copyright © 2013 SciRes. OPEN ACCESS 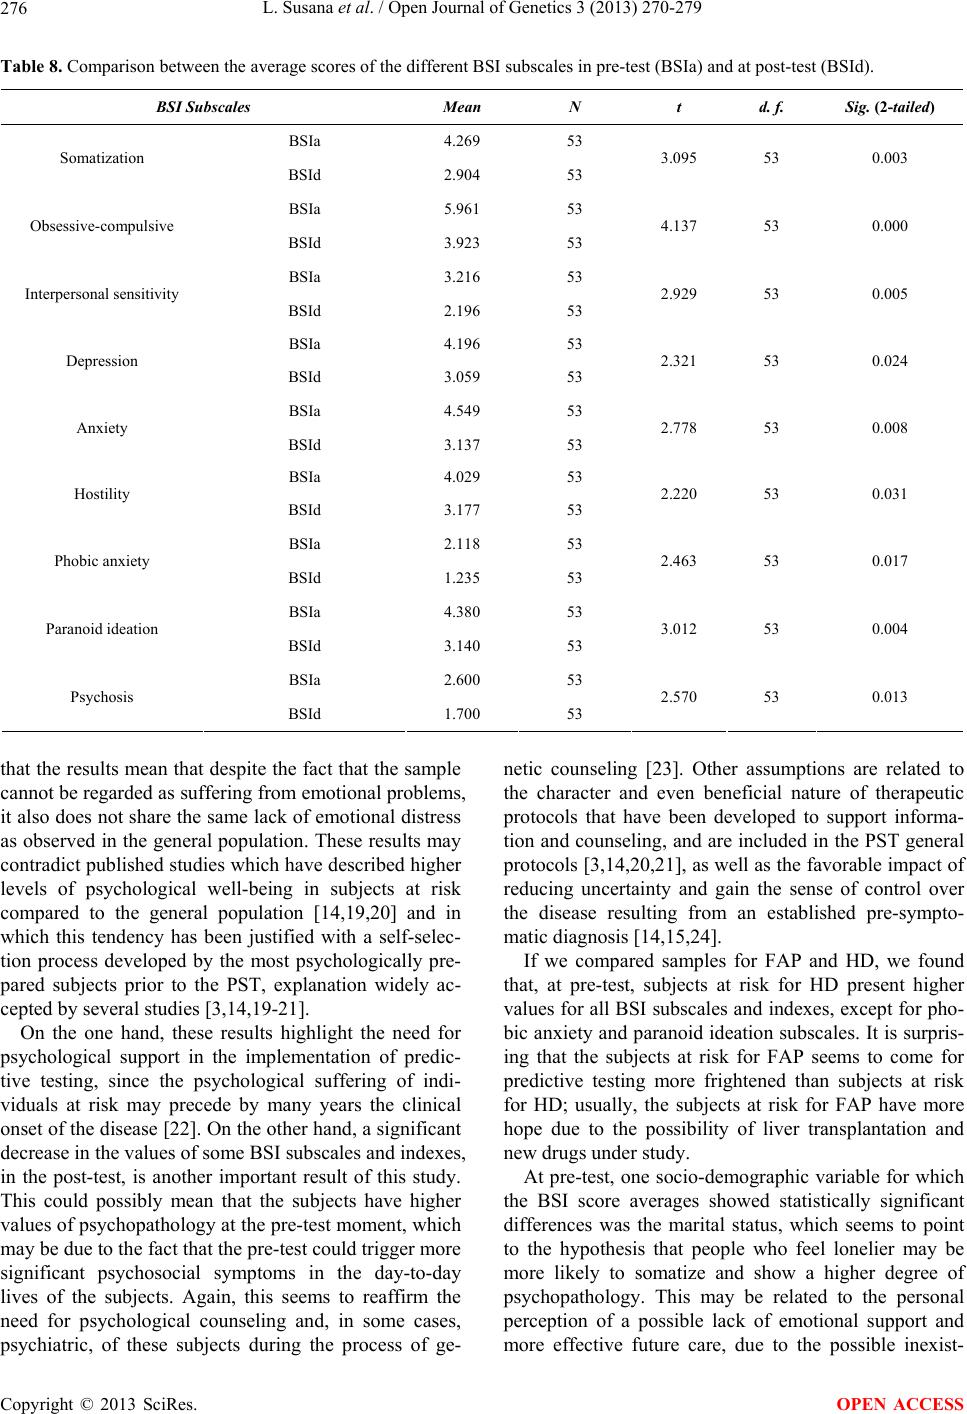 L. Susana et al. / Open Journal of Genetics 3 (2013) 270-279 276 Table 8. Comparison between the average scores of the different BSI subscales in pre-test (BSIa) and at post-test (BSId). BSI Subscales Mean N t d. f. Sig. (2-tailed) BSIa 4.269 53 Somatization BSId 2.904 53 3.095 53 0.003 BSIa 5.961 53 Obsessive-compulsive BSId 3.923 53 4.137 53 0.000 BSIa 3.216 53 Interpersonal sensitivity BSId 2.196 53 2.929 53 0.005 BSIa 4.196 53 Depression BSId 3.059 53 2.321 53 0.024 BSIa 4.549 53 Anxiety BSId 3.137 53 2.778 53 0.008 BSIa 4.029 53 Hostility BSId 3.177 53 2.220 53 0.031 BSIa 2.118 53 Phobic anxiety BSId 1.235 53 2.463 53 0.017 BSIa 4.380 53 Paranoid ideation BSId 3.140 53 3.012 53 0.004 BSIa 2.600 53 Psychosis BSId 1.700 53 2.570 53 0.013 that the results mean that despite the fact that the sample cannot be regarded as suffering from emotional problems, it also does not share the same lack of emotional distress as observed in the general population. These results may contradict published studies which have described higher levels of psychological well-being in subjects at risk compared to the general population [14,19,20] and in which this tendency has been justified with a self-selec- tion process developed by the most psychologically pre- pared subjects prior to the PST, explanation widely ac- cepted by several studies [3,14,19-21]. On the one hand, these results highlight the need for psychological support in the implementation of predic- tive testing, since the psychological suffering of indi- viduals at risk may precede by many years the clinical onset of the disease [22]. On the other hand, a significant decrease in the values of some BSI subscales and indexes, in the post-test, is another important result of this study. This could possibly mean that the subjects have higher values of psychopathology at the pre-test moment, which may be due to the fact that the pre-test could trigger more significant psychosocial symptoms in the day-to-day lives of the subjects. Again, this seems to reaffirm the need for psychological counseling and, in some cases, psychiatric, of these subjects during the process of ge- netic counseling [23]. Other assumptions are related to the character and even beneficial nature of therapeutic protocols that have been developed to support informa- tion and counseling, and are included in the PST general protocols [3,14,20,21], as well as the favorable impact of reducing uncertainty and gain the sense of control over the disease resulting from an established pre-sympto- matic diagnosis [14,15,24]. If we compared samples for FAP and HD, we found that, at pre-test, subjects at risk for HD present higher values for all BSI subscales and indexes, except for pho- bic anxiety and paranoid ideation subscales. It is surpris- ing that the subjects at risk for FAP seems to come for predictive testing more frightened than subjects at risk for HD; usually, the subjects at risk for FAP have more hope due to the possibility of liver transplantation and new drugs under study. At pre-test, one socio-demographic variable for which the BSI score averages showed statistically significant differences was the marital status, which seems to point to the hypothesis that people who feel lonelier may be more likely to somatize and show a higher degree of psychopathology. This may be related to the personal perception of a possible lack of emotional support and more effective future care, due to the possible inexist- Copyright © 2013 SciRes. OPEN ACCESS  L. Susana et al. / Open Journal of Genetics 3 (2013) 270-279 277 ence of a caregiver. This perception may lead the subject to a state of higher internal anguish that cannot be exter- nalized differently (like matured mentally), and does so somatically (through physical symptoms). The presence of a somatic pathway for the expression of affection has been described in this population [11,15]. Another variable that showed statistically significant results was type of disease. The somatization subscale revealed statistically significant different values in rela- tion to type of disease: subjects at risk for FAP had lower average scores of somatization than subjects at risk for HD. Indeed, the type of disease contributes to the expla- nation of the dependent variable somatization. This may be related to HD characteristics, namely, behavioral changes prior to neurological disorders, what leads a person at risk for HD to have more somatic complaints. The subjects who transitioned from pre-test moment to post-test are mainly carriers. Almost all non-carriers do not understand the need to remain in predictive testing protocol after knowing their genetic status of non-carrier; so, after some time, they fail to attend. Even if they un- derstand the need to keep the protocol until the end, labor and economic constraints eventually prevent them from continuing. When comparing carriers and non carriers samples, at post-test, we found that carriers present higher values for all BSI subscales and indexes, except for hostility, para- noid ideation and psychosis subscales and PST index. We understand better that carriers have higher values in most of the BSI subscales and indexes than non-carriers have higher values on the hostility, psychosis and para- noid ideation subscales as well in PST index. Eventually, paranoid ideation and psychosis may be explained by the suspicion that some non carriers keep in relation to their genetic status: the need to stay at the predictive test pro- tocol can be interpreted as having the possibility of be- coming carriers. Hostility seems to be better explained by the fact that some patients remain in the protocol thwarted. One previous study only with FAP carriers [12] also found that most of them did not have psychological dis- turbance or sense of hopelessness after a year of knowing their genetic status. One of the explanations given by the authors was that the personality structure of these sub- jects that can be very similar to that of psychosomatic personalities. This present a very poor capacity for sym- bolic thinking or subjectivity, therefore, they present difficulty to draw up mentally their negative emotions (internal anguish). Perhaps this could explain the high values recorded in the somatization subscale in subjects without a partner, translating their difficulty to accept this reality. This explanation that emphasizes this kind of personality structure found in the population of carriers of FAP, may also explain why, once again, and also in the present study, emotional disturbance was not found resulting from the knowledge of genetic status (carrier or non carrier). This may then be justified by the existence of a type of personality structure near psychosomatic personalities in which the individual has very rigid de- fense mechanisms, repressing anything that might be disturbing, trying to avoid thinking about a reality that causes so much anguish. When comparing samples of FAP and HD carriers, at post-test, we found that HD carriers present higher val- ues for all BSI subscales and indexes, except paranoid ideation subscale and PSD. Again, we become surprised with FAP carriers (as well as the non carriers, like we said above) having higher levels of paranoid ideation. If we compare samples of FAP and HD non carriers, at post-test, we found that FAP non carriers present higher values for all BSI subscales and indexes; this can be ex- plained by the low number of HD non carriers that re- mained in the protocol. Specifically, the finding of higher post-test hostility in subjects at risk for HD (regardless of the molecular re- sults obtained) may be related to the clinical characteri- zation of this disease, unique for the neurodegenerative diseases here studied, that presents mental deterioration prior to the motor and autonomic symptoms. Thus, the nature and the subjective perception of the degree of se- verity and prognosis of the disease felt by affected or at risk individuals should be weighed [3,25]. It is interest- ing to note that the type of disease is the variable that best predicts some of the subscales of the BSI (somatiza- tion in pre-test and depression, anxiety and hostility in post-test). Finally, the variable gender partially explains the de- pendent variable phobic anxiety at post-test, with aver- ages among men (0.700) and female (1.581) differing, although this difference was not significant. The higher levels of psychopathology found in female subjects are a finding consistent with different previous publications [3,19]. It is worth noting that a higher trend in men’s denial of feelings has been recognized. The predictive nature of the socio-demographic variables of the popula- tion that underwent the PST, as well as their levels of psychological functioning have been widely discussed [3,7,14,21,24,25]. For its clinical relevance in the estab- lishment of more timely intervention in those individuals identified as vulnerable, this is indeed one of the most relevant results of the study. Nevertheless, despite the establishment of predictive variables under study, the need for a careful and personalized support for each in- dividual who came to consummate the PST continues to be an ethical principle that needs to be established [2,3]. Therefore, we can say that the group of subjects here studied is a distinguished population and, as in other studies for Portuguese samples, such populations have Copyright © 2013 SciRes. OPEN ACCESS  L. Susana et al. / Open Journal of Genetics 3 (2013) 270-279 278 higher values on the BSI subscales than the general population. This result is consistent with previous studies, for example, patients with fibromyalgia [26], drug ad- dicts [27] or mothers with children with cerebral paraly- sis [28] on the Portuguese population. 5. CONCLUSION AND CLINICAL IMPLICATIONS There is a decrease in average values between the pre- and post-test moments regarding the studied psycho- pathological scores, stating that subjects have higher levels of psychopathology prior to pre-symptomatic test- ing than one year after notification of genetic test results. That’s why this research reveals the need for the exis- tence of a rigorous protocol of consultation and evalua- tion of genetic counseling and psychosocial support, from the base line to a considerable post-test period with emphasis on symbolic representation of the disease and self coping mechanisms to face all the disease informa- tion and the condition of being a carrier or a non carrier with a past history or relatives with the disease. Another need perhaps is the future implementation of therapeutic groups with goals of psychosocial support for this popu- lation. The inherent characteristics of each disease, as well as the knowledge of the genetic status—be a carrier or non carrier—do not seem to significantly influence the exis- tence of emotional distress, as would initially be ex- pected. Only the gender and marital status variables were important in the oscillation of the values of psycho- pathological scores, stating that it was women who had the highest values, as well as the single or widow indi- viduals. Although there were no observed score inductors of a degree of psychopathological disturbance (higher than 1.7) we cannot, however, conclude that the pre-sympto- matic testing for these diseases does not affect the indi- viduals, since all the values found in our results are higher than the reference values for general population. This suggests that these subjects did not show complete absence of emotional disturbance. For this reason, there must be given increasing attention to the individual characteristics of each subject and adapt the psychologi- cal support to each individual’s needs, since it is a popu- lation that has different ways of coping with psychologi- cal distress. REFERENCES [1] International Huntington Association and World Federa- tion of Neurology Research Group on Huntington’s Dis- ease (1994) Guidelines for the molecular genetics predic- tive test in Huntington’s disease. Journal of Medical Ge- netics, 31, 555-559. http://dx.doi.org/10.1136/jmg.31.7.555 [2] Sequeiros, J. (1996) Genetic Counseling and the Predic- tive Testing for Machado-Joseph Disease. In: Sequeiros, J. (Ed.), The Predictive Testing for Machado-Joseph Disea- se, UnIGENe, IBMC, Porto, pp. 97-112. [3] Paneque, H.M., Prieto, A.L., Reynaldo, R.R., Cruz, M.T., Santos, F.N., Almaguer, M.L., et al. (2007) Psychological aspects of presymptomatic diagnosis of spinocerebellar Ataxia type 2 in Cuba. Community Genetics, 10, 132-139. http://dx.doi.org/10.1159/000101754 [4] Lerman, C. (1997) Psychological aspects of genetic test- ing: introduction to the special issue. Health Psychology, 1, 3-7. http://dx.doi.org/10.1037/h0092702 [5] Decruyenaere, M., Evers-Kiebooms, G. and Van Den Berghe, H. (1997) Non-participation in predictive testing for Huntington’s Disease: Individual decision-making, personality and avoidant behavior in the family. Euro- pean Journal of Human Genetics, 5, 351-363 [6] Almqvist, E.W., Bloch, M. and Hayden, M. (1999) A worldwide assessment of the frequency of suicide, sui- cide attempts, or psychiatric hospitalization after predic- tive testing for Huntington Disease. American Journal of Human Genetics, 64, 1293-1304. http://dx.doi.org/10.1086/302374 [7] Codori, A., Slavney, P.R. and Brandt, J. (1997) Predictors of psychological adjustment to genetic testing of Hunt- ington’s Disease. Health Psychology, 1, 36-50. http://dx.doi.org/10.1037/0278-6133.16.1.36 [8] Tibben, A., Timman, R., Bannink, E. and Duivenvoorden, H. (1997) Three years follow-up after presymptomatic testing for Huntington’s Disease in tested individuals and partners. Health Psychology, 1, 20-35. http://dx.doi.org/10.1037/0278-6133.16.1.20 [9] Saraiva, M.J. and Costa, P. (1986) Familial Amyloidotic Polyneuropathy, Portuguese type: Phenotype and geno- type. In: Sales-Luís, M.L., Ed., Symposium on Peripheral Neuropathies, Lisboa, pp. 207-212. [10] Lopes, A. and Fleming, M. (1996) The Somatic Disease and the psychic Organization: A reflection: Considera- tions starting from the Familiar Amyloidotic Polyneuro- pathy. Portuguese Journal of Psychoanalysis, 15, 93-100. [11] Lopes, A. and Fleming, M. (1998) Psychological Aspects of the Familial Amyloidotic Polyneuropathy: The interge- nerational underground storyline. Brotéria Genétics, 19, 183-192. [12] Lêdo, S. (2002) The First day of the rest of their lives. Some psychological aspects of FAP. MSc Dissertation, ISPA Lisbon. [13] Leite, A. (2006) Psychosocial Determinants of Adherence for pre-symptomatic testing of the late onset neurological genetic diseases. Ph.D. Dissertation, Instituto de Ciências Biomédicas Abel Salazar, University of Porto. [14] Rolim, L., Leite, A., Ledo, S., Paneque, M., Sequeiros, J. and Fleming, M. (2006) Psychological aspects of pre- symptomatic testing for Machado-Joseph disease and fa- milial amyloid polyneuropathy type I. Clinical Genetics, 69, 297-305. h ttp:// dx. doi .org/1 0.1111/j.1399-0004.2006.00606.x [15] Paneque, H.M., Lemos, C., Sousa, A., Velázquez, P.L., Fleming, M. and Sequeiros, J. (2009) Role of the disease Copyright © 2013 SciRes. OPEN ACCESS  L. Susana et al. / Open Journal of Genetics 3 (2013) 270-279 Copyright © 2013 SciRes. 279 OPEN ACCESS in the psychological impact of pre-symptomatic testing for SCA2 and FAP ATTRV30M: Experience with the disease, kinship and gender of the transmitting parent. Journal of Genetic Counseling, 18, 483-493. http://dx.doi.org/10.1007/s10897-009-9240-1 [16] Derogatis, L.R. (1993) BSI: Brief Symptom Inventory. Nacional Computers Systems, Minneapolis. [17] Canavarro, C. (1999) Psychopathological Sintomatic In- ventory—BSI. In: Simões, M., Gonçalves, M. and Almei- da, L., Eds. Psychological Test and Scales in Portugal (Vol. 2), APPORT/SHO, Braga, 305-331. [18] Canavarro, C. (2007) Psychopathological Sintomatic In- ventory (BSI) A critical revision of the portuguese studies. In: Simões, M., Machado, C., Gonçalves, M. and Almei- da, L., Eds., Psychological Evaluation. The Validated Scales for the Portuguese Population (Vol. 3), Quarteto Editora, Lisboa. [19] Bloch, M., Fahy, M., Fox, S. and Hayden, M. (1989) Pre- symptomatic testing for Huntington disease: II. Demo- graphic characteristics, life-style patterns, attitudes, and psychosocial assessments of the first fifty-one test candi- dates. American Journal of Medical Genetics, 32, 217- 224. http://dx.doi.org/10.1002/ajmg.1320320215 [20] Codori, A.M., Hanson, R. and Brandt, J. (1994) Self- selection in predictive testing for Huntington’s disease. American Journal of Medical Genetics, 54, 167-173. http://dx.doi.org/10.1002/ajmg.1320540303 [21] Tibben, A. (2007) Predictive testing for Huntington’s disease. Brain Result Bulletin, 72, 165-171. http://dx.doi.org/10.1016/j.brainresbull.2006.10.023 [22] Sequeiros, J. (1998) Prenatal diagnosis of late-onset di- seases. Progresos en Diagnóstico Prenatal, 10, 218-220. [23] Weil, J. (2003) Psychosocial genetic counseling in the post-nondirective era: A point of view. Journal of Ge- netic Counseling, 12, 199-211. http://dx.doi.org/10.1023/A:1023234802124 [24] Almqvist, E.W., Brinkman, R.R., Wiggins, S. and Hay- den, M.R. (2003) Canadian Collaborative Study of Pre- dictive Testing. Psychological consequences and predic- tors of adverse events in the first 5 years after predictive testing for Huntington’s disease. Clinical Genetics, 64, 300-309. http://dx.doi.org/10.1034/j.1399-0004.2003.00157.x [25] DudokdeWit, A.C., Tibben, A., Duivenvoorden, H.J., Niermeijer, M.F. and Passchier, J. (1998) Predicting ad- aptation to presymptomatic DNA testing for late onset disorders: Who will experience distress? Rotterdam Lei- den Genetics Workgroup. Journal of Medical Genetics, 35, 745-754. http://dx.doi.org/10.1136/jmg.35.9.745 [26] Quartilho, M. (1999) Fibromyalgia e Somatization. Ph.D. Dissertation, University of Coimbra. [27] Almeida, D., Vieira, C., Rijo, D. and Felisberto, A. (2005) Addiction and psychiatric comorbidity: Axis I Sympto- matology and personality disorders. Clinical Psychiatry, 26, 55-70. [28] Monteiro, M., Matos, A. and Coelho, R. (2004) Psycho- logical adaptation of mothers whose children have cere- bral paralysis: A study result. Portuguese Journal of Psy- chosomatic, 6, 115-130.
|