 Open Journal of Genetics, 2013, 3, 235-242 OJGen http://dx.doi.org/10.4236/ojgen.2013.34026 Published Online December 2013 (http://www.scirp.org/journal/ojgen/) Genetic structure and diversity of Ukrainian red clover cultivars revealed by microsatellite markers Yulia N. Dugar1, Vitalii N. Popov2 1Kharkov National Agrarian University nd. a. V. V. Dokuchaev, Post Office Communist-1, Kharkov District, Ukraine 2Рlant Production Institute nd. a. V. Ya. Yuryev of National Academy of Agrarian Science, Kharkov, Ukraine Email: jndugar@gmail.com, vnpop@mail.ru Received 10 October 2013; revised 1 November 2013; accepted 28 November 2013 Copyright © 2013 Yulia N. Dugar, Vitalii N. Popov. This is an open access article distributed under the Creative Commons Attribu- tion License, which permits unrestricted use, distribution, and reproduction in any medium, provided the original work is properly cited. ABSTRACT Polymorphism of microsatellite loci of Ukrainian red clover cultivars has been studied. 87 microsatellite alleles, which occurred in different combinations, were identified. The number of alleles ranged from 7 to 10. Microsatellite allele distribution showed that 15 alleles were common for all the red clover cultivars (17.2%). The red clover cultivars were represented by homozygous and heterozygous genotypes. The ob- served and expected heterozygosity ranged from 0.067 to 0.269 and from 0.225 to 0.807, respectively. An analysis of molecular variance revealed that the largest proportion of variation (68.5%) resided at the intrapopulation level. Differentiation of the Ukrain- ian cultivars was moderately expressed (FST = 0.07). Keywords: Genetic Structure; Heterozygosity; Microsatellites; Polymorphism; Trifolium pratense L. 1. INTRODUCTION Genetic diversity and differentiation of current selection cultivars and hybrids are primarily studied with different types of DNA-markers in agricultural plants that domi- nate in cropland acres—wheat, barley, soya, corn, sun- flower [1-5]. DNA genome polymorphism has been also thoroughly investigated in forage grasses belonging to genera Medicago and Festuca [6,7], and the genome of red clover is less studied (Trifolium pratense L.) as com- pared with them. At present the red clover genome is studied using a dominant marker system RAPD (Random Amplifed Polymorphic DNA) [8-11]. Usage of such DNA-markers is allowed to study red clover cultivars of Ukrainian selection [12]. Additionally, another dominant marker system, ISSR (Inter-Simple Sequence Repeats), was used to evaluate genetic diversity of 6 species of the genus Trifolium as well as of Ukrainian cultivars of red clover [13,14]. The investigation of population structure of red clover cultivars by means of microsatellite mark- ers is topical at the moment. They are notable for high polymorphism, co-dominantly inherited and well suitable for differentiating natural populations and breeding mate- rial [15,16]. At this point, microsatellite variability in the red clover genome has been determined, which allowed detailed genetic mapping as well as involving them in QTL (Quantitative trait loci) mapping [17-19]. The ne- cessity of utilization of microsatellite markers for differ- entiating red clover cultivars is also associated with the fact that the absence of clear marker morphological traits used for characterization of most plant genetic resources is a genetic peculiarity of clover plants [20]. However, the lack of information on genetic peculiarities of red clover cultivars of Ukrainian selection makes it impossi- ble to judge the genetic diversity level of the world clo- ver collection in full measure. In this context, the aim of our research was to investigate genetic variability of mi- crosatellite loci and to estimate genetic structure and differentiation degree of Ukrainian red clover cultivars. 2. MATERIALS AND METHODS Fifteen Ukrainian red clover cultivars, which were re- ceived from Ustimovskaya experimental station of the Рlant Production Institute nd. a. V. Ya. Yuryev of NAAS (Kharkov, Ukraine) and from the Institute of Forage Crops and Agriculture of Podol of NAAS (Vinnitsa, Ukraine), were used as plant material (Table 1). To assess variability of microsatellite loci 30 individ- ual seeds of each of clover cultivars were analyzed. The representative sample comprised 450 seeds. Genome DNA was extracted from clover seeds with CTAB buffer according to the standard protocol [21]. 10 microsatellite loci—TPSSR05, TPSSR16, TPSSR17, OPEN ACCESS  Y. N. Dugar, V. N. Popov / Open Journal of Genetics 3 (2013) 235-242 236 Table 1. Investigated red clover cultivars. No Cultivar Originator 1 Ternopil’s’ka 3 2 Ternopil’s’ka 4 Podilska Experimental Station of Ternopil Institute of Agricultural Production of UAAS, Ternopol region 3 Myronivs’ka 45 Muronivka Wheat Institute nd. a V. N. Remeslo of UAAS, Kiev region 4 Darunok 5 Kumach 6 Marusia 7 Polis 8 Polianka National Scientific Center “Institute of Agriculture of UAAS”, Kiev region 9 Anitra 10 Politanka 11 Sparta Institute of Forage Crops of UAAS, Vinnitsa region 12 Ahros 12 Chernihiv Institute of Agricultural Production of UAAS, Chernigov region 13 Falkon Nosivska Selection-Experimental Station of Chernihiv Institute of Agricultural Production of UAAS, Chernigov region 14 Poltavs’ka 75 Poltavskaya State Agricultural Experimental Station nd. Vavilov of Poltava Institute of Agricultural Production of UAAS, Poltava region 15 UDS00131 Carpathians, local cultivar Footnote: UAAS—Ukrainian Academia of Agricultural Science. TPSSR23, TPSSR28, TPSSR29, TPSSR34, TPSSR46, TPSSR50, TPSSR52 (Table 2) was selected for our work, which was development by Kolliker et al. [22]. Reac- tions were carried out with the GenePak PCR Core re- agent kit (IzoGen, Russia). 20 μl final volume of reagent mixture containing 20 ng of genome DNA and 0.2 μM of each SSR primer (forward, reverse). 20 l of mineral oil was layered atop reagent mixture in vials. PCR (Poly- merase Chain Reaction) was performed in a thermocy- cler TP4-PCR-01 “Tertsik” (DNA-technology, Russia) according to the program suggested by Кolliker et al. [22]. The PCR products were separated by electrophoresis in 3% high-resolution agarose gel with addition of ethidium bromide in low ionic strength buffer [23] and following photographing in UV-light. DNA ladders 50 bp and pUC 19/MspI DNA Marker were used as fragment length standards. Allele sizes of each microsatellite locus were determined using the program Totallab version TL120 [24]. The results were statistically processed using the Excel Microsatellite Toolkit version 3.1.1. [25], which com- puted the following population criteria: allele frequencies, average number of alleles per locus (Na), observed (Ho) and expected (He) heterozygosity. The effective number of alleles was calculated with the formula (Ne) [26]: 2 11 Ne 1He i p (1) The indices of genetic diversity of red clover popula- tions were calculated with Analysis of Molecular Vari- ance (AMOVA) in Arlequin version 3.11 [27]. We calcu- lated the following indices of molecular variance: Va— between red clover cultivars, Vb—between genotypes within a cultivar, Vc—between loci in individual geno- types. The differentiation degree between clover culti- vars was carried out with F-statistics (FST, FIT, FIS). Step- wise mutation model (SMM) for microsatellite loci was used [28]. The statistical significance of the indices of genetic variability was tested via 1000 permutations of initial data [27]. A dendrogram of genetic relationships between red clover cultivars was plotted with the Neighbor-Joining method (NJ) in the Neighbor program in Phylip version 3.69 [29]. The factors were discriminated by a correla- tion matrix of initial allelic frequencies of microsatellite loci using principal components analysis (Q-factor analy- sis) with factor rotation based on the varimax criterion. To infer the structure and genetic relationships among the 15 varieties, the dataset was analyzed using Structure version 2.3.4 [30]. 3. RESULTS Over the ten SSR loci, 87 fragments were scored, with size ranging from 100 (TPSSR52) to 280 bp (TPSSR05) (Table 3). The number of alleles per locus ranged from 7 to 10 and the mean number of alleles per locus was 8.70 ± 1.16 (Table 3). The minimum number of alleles was detected for loci TPSSR28 and TPSSR34, and the maximum—for loci TPSSR23, TPSSR50 and TPSSR52. The analysis of allelic frequencies showed that the microsatellite loci studied in red clover were signifi- cantly polymorphic for the selected monomorphity threshold (р0 = 0.95) [31]. Allelic frequencies for each microsatellite locus were determined in the sample stud- ied, they ranged from 0.001 to 0.878. Altogether, 6 al- leles occurred with the frequency of 0.001 (0.7% of the total number of alleles). These alleles were 100, 232, 234, 280 bp in length for loci TPSSR52, TPSSR46, TPSSR34, TPSSR05, respectively, and 2 alleles were 207 and 213 bp long in locus TPSSR17. A high frequency is typical for 150 bp allele in locus TPSSR17. The observed and expected heterozygosity levels are measures of genetic variability of microsatellite loci. The latter is more adequate, since it allows direct evaluating allelic diversity level for a locus investigated [31]. The values of observed and expected heterozygosity ranged Copyright © 2013 SciRes. OPEN ACCESS  Y. N. Dugar, V. N. Popov / Open Journal of Genetics 3 (2013) 235-242 Copyright © 2013 SciRes. 237 OPEN ACCESS Table 2. Characteristics of SSR-primers. No Locus Repeat Sequence 5’-3’ Annealing temperature, ˚C 1 TPSSR05 (GT)n F: AGGGTGTGCGTGCAAACA R: TATGTCTATCTTCCCTTTTAATGTCTTCTG 55 2 TPSSR16 (CT)n F: GCGCTTATTCGAAGACGGAA R: TCAGTGGAGTAGGGTCGTCGT 60 3 TPSSR17 (CTT)n F: AAGCAGCGAGACTTCCCTTTG R: TGGAAGGTTAACATCGAGAGCA 60 4 TPSSR23 (AG)n F: CAGTCGGGTTGTTGCCATTT R: GAGGAATAAACTCAATACTTCAGTGACTAGAT 60 5 TPSSR28 (AG)n F: CTCTTAAGGGTTGGTATTGAAATCG R:TCTTGTCTCGCCGACGTTT 60 6 TPSSR29 (GA)n F: TTTCGGTAGTGGAAGATGATGGA R: TCAATAATTTCAGAAAAAGATCAAAACC 60 7 TPSSR34 (CT)n F: GTTAGTGCGCGAAAGGAAGG R: GTTCAGTGGATCAGTGAGTAACACAA 60 8 TPSSR46 (TC)n F: TCAAATAAAACTTTCATAACGTTCATCTC R: TCCGAAGAAACCATTATCTACGTTG 60 9 TPSSR50 (CT)n F: TTTGTTCAGGAAAATGAGGCG R: ATTCCTTCCATCTTCTCTATGT 60 10 TPSSR52 (CT)n F: ATTCCTTCCATCTTCTCTATGT R: TTATATTAATGGGAGTTAGTATGATCTA 60 Table 3. Results of analysis of microsatellite loci genetic variability in red clover. No Locus Ho He N Na Ne Fragment size, bp 1 TPSSR28 0.160 0.698 7 4.60 ± 0.91 3.31 128 - 182 2 TPSSR34 0.126 0.690 7 4.00 ± 1.00 3.22 164 - 246 3 TPSSR17 0.067 0.225 8 3.13 ± 1.41 1.29 141 - 213 4 TPSSR46 0.100 0.786 8 5.13 ± 0.92 4.67 158 - 232 5 TPSSR05 0.158 0.766 9 5.53 ± 0.92 4.27 170 - 280 6 TPSSR16 0.269 0.797 9 5.40 ± 0.99 4.93 166 - 260 7 TPSSR29 0.197 0.801 9 6.27 ± 0.80 5.03 136 - 214 8 TPSSR23 0.180 0.777 10 6.27 ± 1.33 4.48 138 - 246 9 TPSSR50 0.261 0.807 10 6.67 ± 1.11 5.18 130 - 230 10 TPSSR52 0.216 0.702 10 5.67 ± 1.35 3.36 100 - 188 Total 87 Mean 0.173 ± 0.006 0.705 ± 0.0558.70 ± 1.16 3.97 ± 1.20 Footnote: Ho—observed heterozygosity, He—expected heterozygosity (Nei’s genetic diversity), N—observed number of alleles, Na—average number of alleles per locus, Nе—effective number of alleles. within 0.067 - 0.269 (mean 0.173 ± 0.006) and 0.225 - 0.807 (mean 0.705 ± 0.055), respectively. We obtained a high level of expected heterozygosity for all the mi- crosatellite loci. This index ranged from 0.690 to 0.807 for 9 of 10 loci. The exception was locus TPSSR17, for which this index of genetic diversity was considerably lower—0.225 (Table 3). The investigation of genetic structure of red clover cultivars by the number of alleles of microsatellite loci demonstrated that their numbers ranged from 1 to 9. For example, a monomorphic 150 bp fragment was identified for locus TPSSR17 in the cultivar Kumach, and in the cultivar Marusia the maximum number of allelic variants was recorded for locus TPSSR23—9. The analysis of  Y. N. Dugar, V. N. Popov / Open Journal of Genetics 3 (2013) 235-242 238 each cultivar by a set of alleles of microsatellite loci showed considerable variations. The total number of alleles ranged from 41 (mean 4.10 ± 0.88) in the cultivar Polis to 59 (mean 5.90 ± 1.10) in the cultivar Terno- pil’s’ka 4 (Table 4). In addition, the clover cultivars had alleles, which were specific for a certain cultivar. These are 250 and 100 bp alleles for loci TPSSR05 and TPSSR52, respectively, in the cultivar Myronivs’ka 45; 207 and 213 bp alleles for locus TPSSR17 in the local cultivar UDS00131; 234 bp allele (TPSSR34) in the cul- tivar Ternopil’s’ka 4; and 232 bp allele for locus TPSSR46 only occurred in the cultivar Falkon. Overall, the analysis of distribution of alleles of microsatellite loci in the general sample of cultivars-populations showed that 15 of 87 identified alleles were common for all the cultivars (17.2%). Allelic variants of microsatellite loci occurred in dif- ferent combinations in red clover cultivars. The number of genotypes ranged from 54 (Polis) to 87 (Darunok, UDS00131), which, on average, made up 78 genotypes. There were no identical or common genotypes among the red clover cultivars investigated. The analysis of frequency distribution of alleles of microsatellite loci demonstrated that one or two, or three (which is rarer) alleles occurred with the highest fre- quencies in most of red clover cultivars. At the same time, the same alleles usually occurred with the highest fre- quencies in different cultivars-populations of clover. Comparison of frequency distribution of alleles of locus TPSSR17 in the red clover cultivars revealed predomi- nance of 150 bp allele with the frequency of from 0.617 in UDS00131 to 1.00 in the cultivar Kumach. The ob- served heterozygosity (Ho) ranged from 0.131 ± 0.020 to 0.212 ± 0.024 in the cultivars Polis and Darunok, respec- tively. The indices of expected heterozygosity (He) were substantial and ranged from 0.566 ± 0.045 to 0.703 ± 0.037 in the cultivars Polis and Ternopil’s’ka 4, respec- tively (Table 4). The analysis of Molecular Variance (AMOVA) of three variability sources in the red clover cultivars re- vealed that only 6.9% of the total genetic variability is accounted for by the interpopulation level (Va), 68.5% pertain to the intrapopulation level (Vb), and 24.5% are attributed to variability of loci (Vc) belonging to a cer- tain genotype (Table 5). The obtained values of inter- population variance for each microsatellite locus allowed identifying loci that most contribute to intravarietal dif- ferences of red clover. These loci are TPSSR05 and TPSSR23, which had variance values of 11.0% and 12.08%, respectively. The minimum value (2.49%) of this index was recorded for locus TPSSR34 with the maximum intrapopulation variance being 79.35% and 80.91% for this locus and locus TPSSR46, respectively. The variance components for loci in genotypes ranged Table 4. Results of withinpopulation variability analysis in clover cultivars. No Cultivar Ho He Na Ne FIS for 10 loci 1 Ternopil’s’ka 3 0.208 ± 0.024 0.694 ± 0.035 5.20 ± 1.23 3.27 0.71 2 Ternopil’s’ka 4 0.177 ± 0.022 0.703 ± 0.037 5.90 ± 1.10 3.37 0.74 3 Myronivs’ka 45 0.200 ± 0.023 0.618 ± 0.059 5.60 ± 1.90 2.62 0.68 4 Darunok 0.212 ± 0.024 0.678 ± 0.056 5.60 ± 1.58 3.11 0.67 5 Kumach 0.137 ± 0.020 0.591 ± 0.071 4.70 ± 1.77 2.44 0.77 6 Marusia 0.174 ± 0.022 0.651 ± 0.071 5.40 ± 2.22 2.87 0.67 7 Polis 0.131 ± 0.020 0.566 ± 0.045 4.10 ± 0.88 2.30 0.76 8 Polianka 0.141 ± 0.020 0.619 ± 0.044 4.90 ± 1.10 2.62 0.77 9 Anitra 0.197 ± 0.023 0.668 ± 0.069 5.20 ± 1.69 3.01 0.73 10 Politanka 0.157 ± 0.021 0.643 ± 0.067 5.40 ± 1.51 2.80 0.78 11 Sparta 0.160 ± 0.021 0.679 ± 0.058 5.70 ± 1.25 3.12 0.78 12 Ahros 12 0.157 ± 0.021 0.643 ± 0.061 5.20 ± 1.69 2.80 0.72 13 Falkon 0.190 ± 0.023 0.659 ± 0.065 5.40 ± 1.43 2.93 0.71 14 Poltavs’ka 75 0.158 ± 0.021 0.657 ± 0.058 5.10 ± 1.10 2.92 0.73 15 UDS00131 0.198 ± 0.023 0.698 ± 0.034 5.60 ± 1.35 3.33 0.73 Footnote: Ho—observed heterozygosity, He—expected heterozygosity (Nei’s genetic diversity), Na—average number of alleles per locus, Nе—effective num- ber of alleles, FIS—inbreeding coefficient. Copyright © 2013 SciRes. OPEN ACCESS 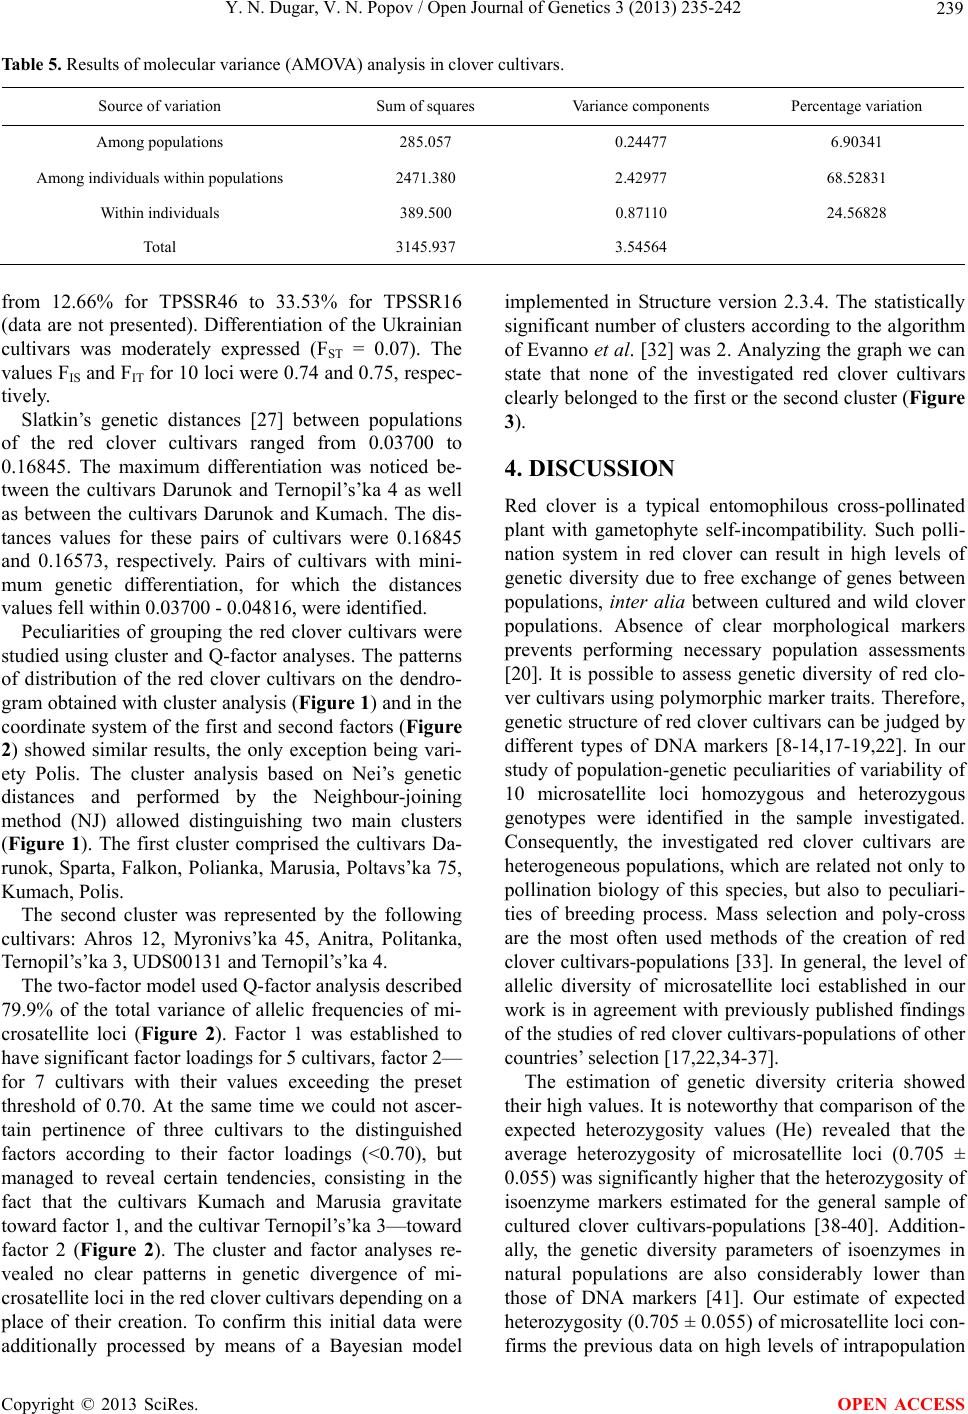 Y. N. Dugar, V. N. Popov / Open Journal of Genetics 3 (2013) 235-242 239 Table 5. Results of molecular variance (AMOVA) analysis in clover cultivars. Source of variation Sum of squares Variance components Percentage variation Among populations 285.057 0.24477 6.90341 Among individuals within populations 2471.380 2.42977 68.52831 Within individuals 389.500 0.87110 24.56828 Total 3145.937 3.54564 from 12.66% for TPSSR46 to 33.53% for TPSSR16 (data are not presented). Differentiation of the Ukrainian cultivars was moderately expressed (FST = 0.07). The values FIS and FIT for 10 loci were 0.74 and 0.75, respec- tively. Slatkin’s genetic distances [27] between populations of the red clover cultivars ranged from 0.03700 to 0.16845. The maximum differentiation was noticed be- tween the cultivars Darunok and Ternopil’s’ka 4 as well as between the cultivars Darunok and Kumach. The dis- tances values for these pairs of cultivars were 0.16845 and 0.16573, respectively. Pairs of cultivars with mini- mum genetic differentiation, for which the distances values fell within 0.03700 - 0.04816, were identified. Peculiarities of grouping the red clover cultivars were studied using cluster and Q-factor analyses. The patterns of distribution of the red clover cultivars on the dendro- gram obtained with cluster analysis (Figure 1) and in the coordinate system of the first and second factors (Figure 2) showed similar results, the only exception being vari- ety Polis. The cluster analysis based on Nei’s genetic distances and performed by the Neighbour-joining method (NJ) allowed distinguishing two main clusters (Figure 1). The first cluster comprised the cultivars Da- runok, Sparta, Falkon, Polianka, Marusia, Poltavs’ka 75, Kumach, Polis. The second cluster was represented by the following cultivars: Ahros 12, Myronivs’ka 45, Anitra, Politanka, Ternopil’s’ka 3, UDS00131 and Ternopil’s’ka 4. The two-factor model used Q-factor analysis described 79.9% of the total variance of allelic frequencies of mi- crosatellite loci (Figure 2). Factor 1 was established to have significant factor loadings for 5 cultivars, factor 2— for 7 cultivars with their values exceeding the preset threshold of 0.70. At the same time we could not ascer- tain pertinence of three cultivars to the distinguished factors according to their factor loadings (<0.70), but managed to reveal certain tendencies, consisting in the fact that the cultivars Kumach and Marusia gravitate toward factor 1, and the cultivar Ternopil’s’ka 3—toward factor 2 (Figure 2). The cluster and factor analyses re- vealed no clear patterns in genetic divergence of mi- crosatellite loci in the red clover cultivars depending on a place of their creation. To confirm this initial data were additionally processed by means of a Bayesian model implemented in Structure version 2.3.4. The statistically significant number of clusters according to the algorithm of Evanno et al. [32] was 2. Analyzing the graph we can state that none of the investigated red clover cultivars clearly belonged to the first or the second cluster (Figure 3). 4. DISCUSSION Red clover is a typical entomophilous cross-pollinated plant with gametophyte self-incompatibility. Such polli- nation system in red clover can result in high levels of genetic diversity due to free exchange of genes between populations, inter alia between cultured and wild clover populations. Absence of clear morphological markers prevents performing necessary population assessments [20]. It is possible to assess genetic diversity of red clo- ver cultivars using polymorphic marker traits. Therefore, genetic structure of red clover cultivars can be judged by different types of DNA markers [8-14,17-19,22]. In our study of population-genetic peculiarities of variability of 10 microsatellite loci homozygous and heterozygous genotypes were identified in the sample investigated. Consequently, the investigated red clover cultivars are heterogeneous populations, which are related not only to pollination biology of this species, but also to peculiari- ties of breeding process. Mass selection and poly-cross are the most often used methods of the creation of red clover cultivars-populations [33]. In general, the level of allelic diversity of microsatellite loci established in our work is in agreement with previously published findings of the studies of red clover cultivars-populations of other countries’ selection [17,22,34-37]. The estimation of genetic diversity criteria showed their high values. It is noteworthy that comparison of the expected heterozygosity values (He) revealed that the average heterozygosity of microsatellite loci (0.705 ± 0.055) was significantly higher that the heterozygosity of isoenzyme markers estimated for the general sample of cultured clover cultivars-populations [38-40]. Addition- ally, the genetic diversity parameters of isoenzymes in natural populations are also considerably lower than those of DNA markers [41]. Our estimate of expected heterozygosity (0.705 ± 0.055) of microsatellite loci con- firms the previous data on high levels of intrapopulation Copyright © 2013 SciRes. OPEN ACCESS 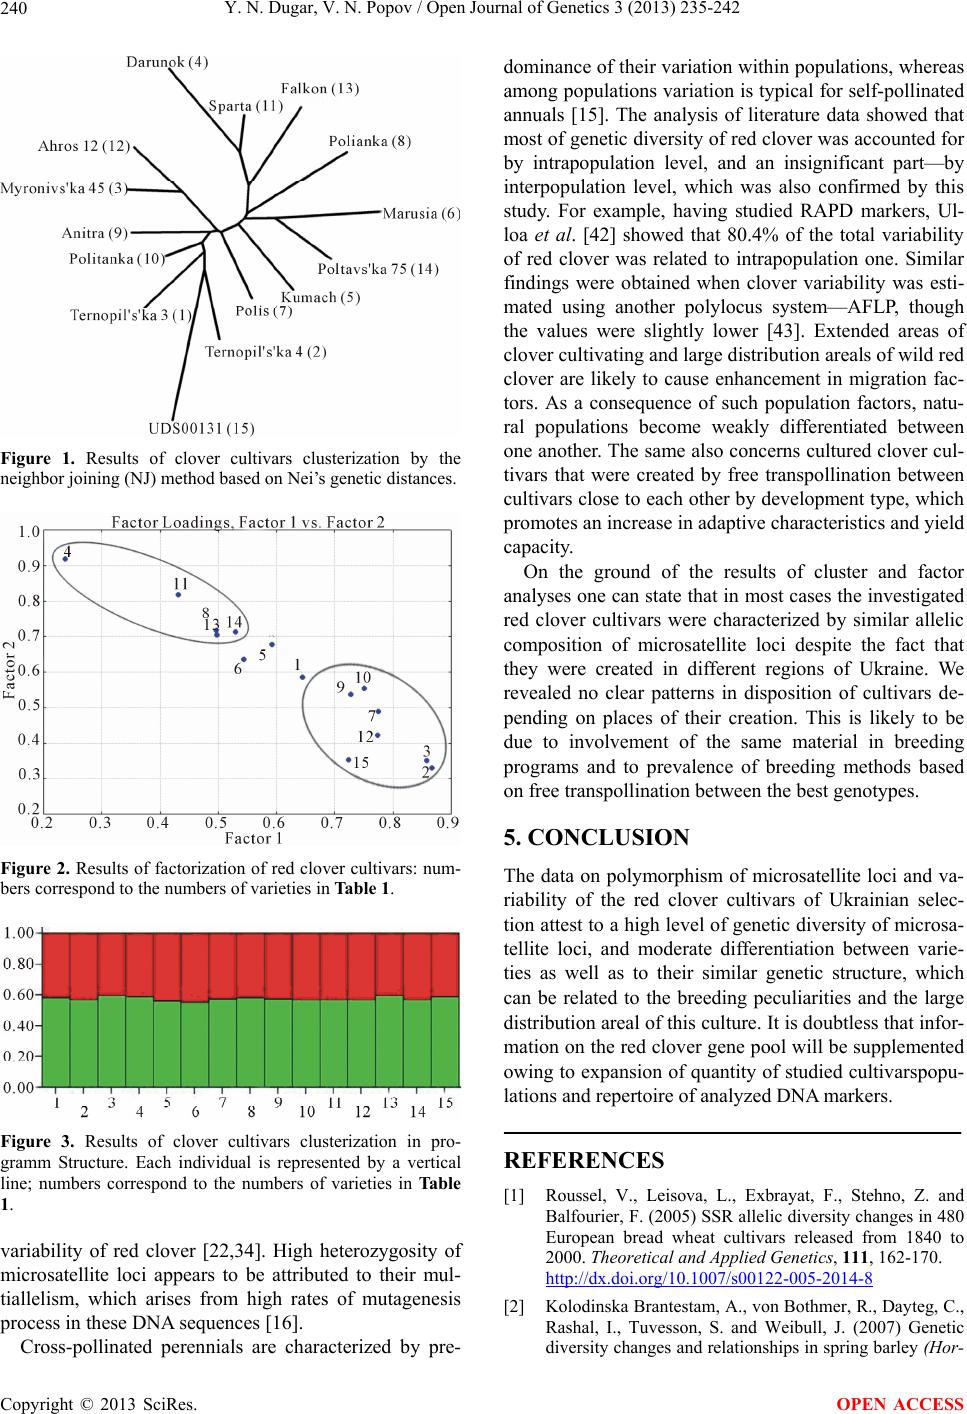 Y. N. Dugar, V. N. Popov / Open Journal of Genetics 3 (2013) 235-242 240 Figure 1. Results of clover cultivars clusterization by the neighbor joining (NJ) method based on Nei’s genetic distances. Figure 2. Results of factorization of red clover cultivars: num- bers correspond to the numbers of varieties in Table 1. Figure 3. Results of clover cultivars clusterization in pro- gramm Structure. Each individual is represented by a vertical line; numbers correspond to the numbers of varieties in Table 1. variability of red clover [22,34]. High heterozygosity of microsatellite loci appears to be attributed to their mul- tiallelism, which arises from high rates of mutagenesis process in these DNA sequences [16]. Cross-pollinated perennials are characterized by pre- dominance of their variation within populations, whereas among populations variation is typical for self-pollinated annuals [15]. The analysis of literature data showed that most of genetic diversity of red clover was accounted for by intrapopulation level, and an insignificant part—by interpopulation level, which was also confirmed by this study. For example, having studied RAPD markers, Ul- loa et al. [42] showed that 80.4% of the total variability of red clover was related to intrapopulation one. Similar findings were obtained when clover variability was esti- mated using another polylocus system—AFLP, though the values were slightly lower [43]. Extended areas of clover cultivating and large distribution areals of wild red clover are likely to cause enhancement in migration fac- tors. As a consequence of such population factors, natu- ral populations become weakly differentiated between one another. The same also concerns cultured clover cul- tivars that were created by free transpollination between cultivars close to each other by development type, which promotes an increase in adaptive characteristics and yield capacity. On the ground of the results of cluster and factor analyses one can state that in most cases the investigated red clover cultivars were characterized by similar allelic composition of microsatellite loci despite the fact that they were created in different regions of Ukraine. We revealed no clear patterns in disposition of cultivars de- pending on places of their creation. This is likely to be due to involvement of the same material in breeding programs and to prevalence of breeding methods based on free transpollination between the best genotypes. 5. CONCLUSION The data on polymorphism of microsatellite loci and va- riability of the red clover cultivars of Ukrainian selec- tion attest to a high level of genetic diversity of microsa- tellite loci, and moderate differentiation between varie- ties as well as to their similar genetic structure, which can be related to the breeding peculiarities and the large distribution areal of this culture. It is doubtless that infor- mation on the red clover gene pool will be supplemented owing to expansion of quantity of studied cultivarspopu- lations and repertoire of analyzed DNA markers. REFERENCES [1] Roussel, V., Leisova, L., Exbrayat, F., Stehno, Z. and Balfourier, F. (2005) SSR allelic diversity changes in 480 European bread wheat cultivars released from 1840 to 2000. Theoretical and Applied Genetics , 111, 162-170. http://dx.doi.org/10.1007/s00122-005-2014-8 [2] Kolodinska Brantestam, A., von Bothmer, R., Dayteg, C., Rashal, I., Tuvesson, S. and Weibull, J. (2007) Genetic diversity changes and relationships in spring barley (Hor- Copyright © 2013 SciRes. OPEN ACCESS  Y. N. Dugar, V. N. Popov / Open Journal of Genetics 3 (2013) 235-242 241 deum vulgare L.) germplasm of Nordic and Baltic areas as shown by SSR markers. Genetic Resources and Crop Evolution, 54, 749-758. http://dx.doi.org/10.1007/s10722-006-9159-4 [3] Mimura, M., Coyne, C.J., Bambuck, M.W. and Lumpkin, T.A. (2007) SSR diversity of vegetable soybean [Glycine max (L.) Merr.]. Genetic Resources and Crop Evolution, 54, 497-508. http://dx.doi.org/10.1007/s10722-006-0006-4 [4] van Inghelandt, D., Melchinger, A.E., Lebreton, C. and Stich B. (2010) Population structure and genetic diversity in a commercial maize breeding program assessed with SSR and SNP markers. Theoretical and Applied Genetics, 120, 1289-1299. http://dx.doi.org/10.1007/s00122-009-1256-2 [5] Heesacker, A., Kishore, V., Gao, W., Tang, S., Kolkman, J., Gingle, A., Matvienko, M., Kozik, A., Michelmore, R., Lai, Z., Rieseberg, L. and Knapp, S. (2008) SSRs and INDELs mined from the sunflower EST database: Abun- dance, polymorphisms, and cross-taxa utility. Theoretical and Applied Genetics, 117, 1021-1029. http://dx.doi.org/10.1007/s00122-008-0841-0 [6] Gupta, S. and Prasad, M. (2009) Development and cha- racterization of genic SSR markers in Medicago trunca- tula and their transferability in leguminous and non-le- guminous species. Genome, 52, 761-771. http://dx.doi.org/10.1139/G09-051 [7] Saha, M.C., Cooper, J.D., Mian, M.A.R., Chekhovskiy, K. and May, G.D. (2006) Tall fescue genomic SSR markers: Development and transferability across multiple grass species. Theoretical and Applied Genetics, 113, 1449- 1458. http://dx.doi.org/10.1007/s00122-006-0391-2 [8] Kongkiatngam, P., Waterway, M.J., Fortin, M.G. and Coulman, B.E. (1995) Genetic variation within and be- tween two cultivars of red clover (Trifolium pratense L.): Comparisons of morphological, isozyme, and RAPD markers. Euphytica, 84, 237-246. http://dx.doi.org/10.1007/BF01681816 [9] Kongkiatngam, P., Waterway, M.J., Coulman, B.E. and Fortin, M.G. (1996) Genetic variation among cultivars of red clover (Trifolium pratense L.) detected by RAPD markers amplified from bulk genomic DNA. Euphytica, 89, 355-361. [10] Campos-de-Quiroz, H. and Ortega-Klose, F. (2001) Ge- netic variability among elite red clover (Trifolium prat- ense L.) parents used in Chile as revealed by RAPD markers. Euphytica, 122, 61-67. http://dx.doi.org/10.1023/A:1012617504493 [11] Grljusic, S., Bolaric, S., Popovic, S., Cupic, T., Tucak, M. and Kozumplik, V. (2005) Assessment of morphological and RAPD variation among and within red clover culti- vars after natural selection. Die Bodenkultur, 56, 183- 188. [12] Dugar, Yu.N. and Popov, V.N. (2011) RAPD analysis of Ukrainian red clover (Trifolium pratense L.) cultivars of different ecology-geographical origin. Vestnik KNU nd. a V.N. Karazin. Series Biology, 13, 81-86. [13] Rizza, M.D., Real, D., Reyno, R., Porro, V., Burgueсo, J., Errico, E. and Quesenberry, K.H. (2007) Genetic diver- sity and DNA content of three South American and three Eurasiatic Trifolium species. Genetics and Molecular Bi- ology, 30, 1118-1124. [14] Dugar, Yu.N. (2012) ISSR-analyses of the Ukrainian red clover cultivars (Trifolium pretense L.). Vestnik KNAU. Series Biology, 2, 98-103. [15] Weising, K., Nybom, H., Wolff, K. and Kahl, G. (2005) DNA fingerprinting in plants: Principles, methods, and applications. 2nd Edition, CRC Press Taylor & Francis Group, Boca Raton. http://dx.doi.org/10.1201/9781420040043 [16] Kalia, R.K., Rai, M.K., Kalia, S., Singh, R. and Dhawan, A.K. (2011) Microsatellite markers: An overview of the recent progress in plants. Euphytica, 177, 309-334. http://dx.doi.org/10.1007/s10681-010-0286-9 [17] Sato, S. Isobe, S., Asamizu, E., Ohmido, N., Kataoka, R., Nakamura, Y., Kaneko, T., Sakurai, N., Okumura, K., Klimenko, I., Sasamoto, S., Wada, T., Watanabe, A., Kohara, M., Fujishiro, T. and Tabata, S. (2005) Compre- hensive structural analysis of the genome of red clover (Trifolium pratense L.). DNA Research, 12, 301-364. http://dx.doi.org/10.1093/dnares/dsi018 [18] Isobe, S., Kolliker, R., Hisano, H., Sasamoto, S., Wada, T., Klimenko, I., Okumura, K. and Tabata, S. (2009) Construction of a consensus linkage map for red clover (Trifolium pratense L.). BMC Plant Biology, 9. [19] Klimenko, I, Razgulayeva, N., Gau, M., Okumura, K., Nakaya, A., Tabata, S., Kozlov, N. and Isobe, S. (2010) Mapping candidate QTLs related to plant persistency in red clover. Theoretical and Applied Genetics, 120, 1253- 1263. http://dx.doi.org/10.1007/s00122-009-1253-5 [20] Mukhina, N.A. and Stankevich, A.K. (1993) Cultured flora: V. ХІІІ. Perennial legume grasses. Kolos, Moscow. [21] Ausubel, F.M., Brent, R., Kingston, R.E., Moor, D.D. and Seidman, J.G. (1987) Current protocols in molecular bi- ology. John Wiley & Sons, New York. [22] Kolliker, R., Enkerli, J. and Widmer, F. (2006) Charac- terization of novel microsatellite loci for red clover (Tri- folium pratense L.) from enriched genomic libraries. Mo- lecular Ecology Notes, 6, 50-53. http://dx.doi.org/10.1111/j.1471-8286.2005.01133.x [23] Brody, J.R. and Kern, S.E. (2004) Sodium boric acid: A Tris-free, cooler conductive medium for DNA electro- phoresis. BioTechniques, 36, 214-216. [24] http://www.totallab.com [25] http://animalgenomics.ucd.ie/sdepark/ms-toolkit [26] Berg, E.E. and Hamrick, J.L. (1997) Quantification of genetic diversity at allozyme loci. Canadian Journal of Forest Research, 27, 415-424. http://dx.doi.org/10.1139/x96-195 [27] http://cmpg.unibe.ch/software/arlequin3/ [28] Balloux, F. and Lugon-Moulin, N. (2002) The estimation of population differentiation with microsatellite markers. Molecular Ecology, 11, 155-165. http://dx.doi.org/10.1046/j.0962-1083.2001.01436.x [29] http://evolution.genetics.washington.edu/phylip.html [30] http://pritchardlab.stanford.edu/structure.html Copyright © 2013 SciRes. OPEN ACCESS 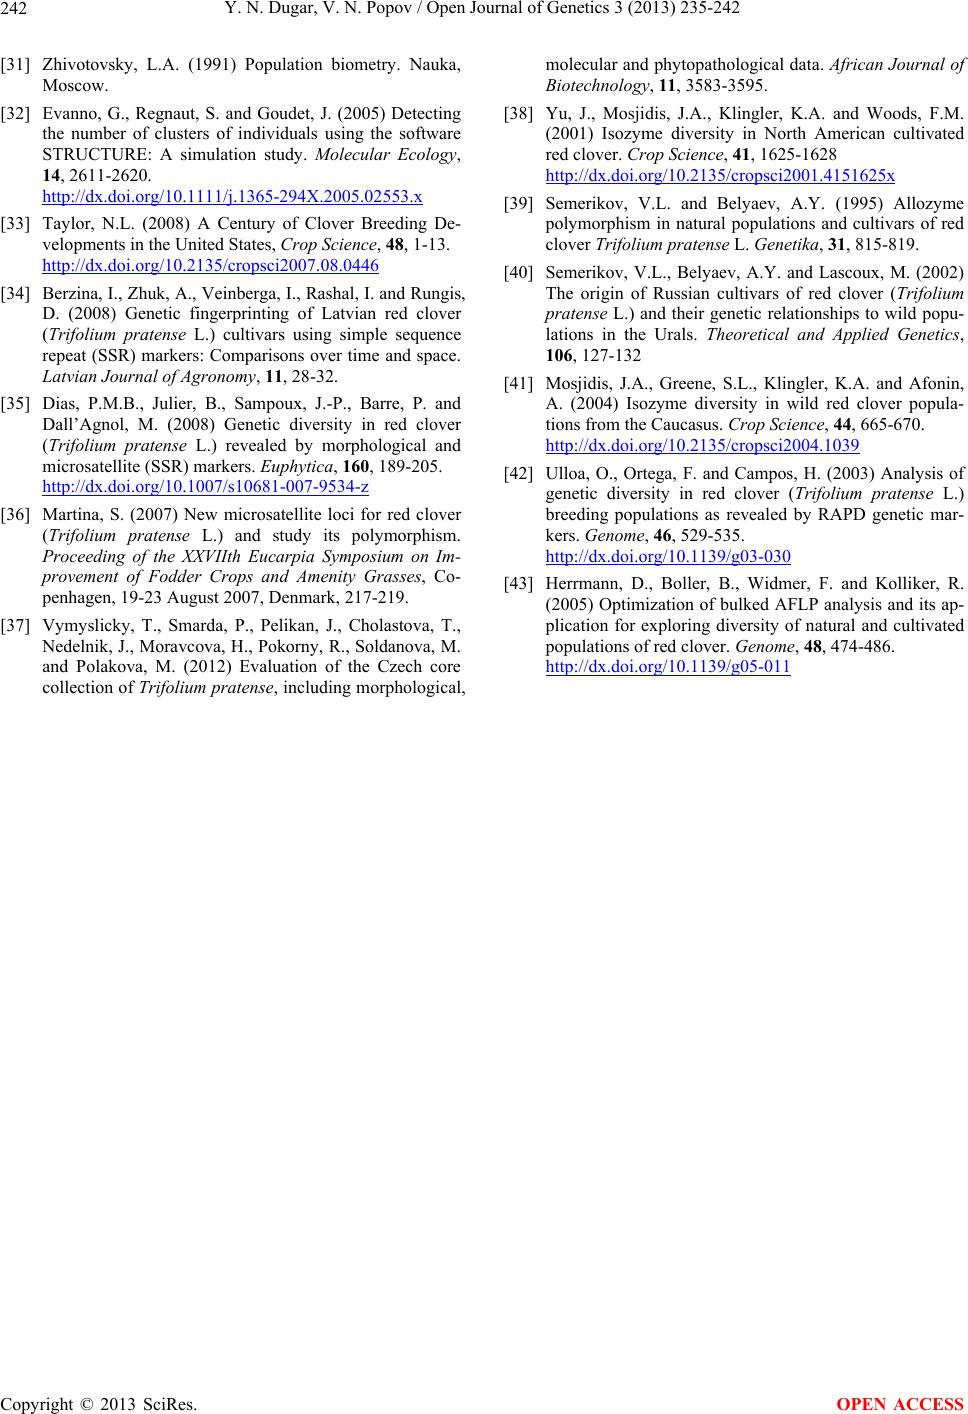 Y. N. Dugar, V. N. Popov / Open Journal of Genetics 3 (2013) 235-242 Copyright © 2013 SciRes. 242 OPEN ACCESS [31] Zhivotovsky, L.A. (1991) Population biometry. Nauka, Moscow. [32] Evanno, G., Regnaut, S. and Goudet, J. (2005) Detecting the number of clusters of individuals using the software STRUCTURE: A simulation study. Molecular Ecology, 14, 2611-2620. http://dx.doi.org/10.1111/j.1365-294X.2005.02553.x [33] Taylor, N.L. (2008) A Century of Clover Breeding De- velopments in the United States, Crop Science, 48, 1-13. http://dx.doi.org/10.2135/cropsci2007.08.0446 [34] Berzina, I., Zhuk, A., Veinberga, I., Rashal, I. and Rungis, D. (2008) Genetic fingerprinting of Latvian red clover (Trifolium pratense L.) cultivars using simple sequence repeat (SSR) markers: Comparisons over time and space. Latvian Journal of Agronomy, 11, 28-32. [35] Dias, P.M.B., Julier, B., Sampoux, J.-P., Barre, P. and Dall’Agnol, M. (2008) Genetic diversity in red clover (Trifolium pratense L.) revealed by morphological and microsatellite (SSR) markers. Euphytica, 160, 189-205. http://dx.doi.org/10.1007/s10681-007-9534-z [36] Martina, S. (2007) New microsatellite loci for red clover (Trifolium pratense L.) and study its polymorphism. Proceeding of the XXVIIth Eucarpia Symposium on Im- provement of Fodder Crops and Amenity Grasses, Co- penhagen, 19-23 August 2007, Denmark, 217-219. [37] Vymyslicky, T., Smarda, P., Pelikan, J., Cholastova, T., Nedelnik, J., Moravcova, H., Pokorny, R., Soldanova, M. and Polakova, M. (2012) Evaluation of the Czech core collection of Trifolium pratense, including morphological, molecular and phytopathological data. African Journal of Biotechnology, 11, 3583-3595. [38] Yu, J., Mosjidis, J.A., Klingler, K.A. and Woods, F.M. (2001) Isozyme diversity in North American cultivated red clover. Crop Science, 41, 1625-1628 http://dx.doi.org/10.2135/cropsci2001.4151625x [39] Semerikov, V.L. and Belyaev, A.Y. (1995) Allozyme polymorphism in natural populations and cultivars of red clover Trifolium pratense L. Genetika, 31, 815-819. [40] Semerikov, V.L., Belyaev, A.Y. and Lascoux, M. (2002) The origin of Russian cultivars of red clover (Trifolium pratense L.) and their genetic relationships to wild popu- lations in the Urals. Theoretical and Applied Genetics, 106, 127-132 [41] Mosjidis, J.A., Greene, S.L., Klingler, K.A. and Afonin, A. (2004) Isozyme diversity in wild red clover popula- tions from the Caucasus. Crop Science, 44, 665-670. http://dx.doi.org/10.2135/cropsci2004.1039 [42] Ulloa, O., Ortega, F. and Campos, H. (2003) Analysis of genetic diversity in red clover (Trifolium pratense L.) breeding populations as revealed by RAPD genetic mar- kers. Genome, 46, 529-535. http://dx.doi.org/10.1139/g03-030 [43] Herrmann, D., Boller, B., Widmer, F. and Kolliker, R. (2005) Optimization of bulked AFLP analysis and its ap- plication for exploring diversity of natural and cultivated populations of red clover. Genome, 48, 474-486. http://dx.doi.org/10.1139/g05-011
|