 Advances in Materials Physics and Chemistry, 2013, 3, 307-313 Published Online December 2013 (http://www.scirp.org/journal/ampc) http://dx.doi.org/10.4236/ampc.2013.38042 Open Access AMPC A Fluorescence Ratiometric Probe for Detection of Cyanide in Water Sample and Living Cells Lingliang Long*, Lin Wang, Yanjun Wu Functional Molecular Materials Research Centre, Scientific Research Academy & School of Chemistry and Chemical Engineering, Jiangsu University, Zhenjiang, China Email: *linglianglong@gmail.com Received October 30, 2013; revised November 28, 2013; accepted December 2, 2013 Copyright © 2013 Lingliang Long et al. This is an open access article distributed under the Creative Commons Attribution License, which permits unrestricted use, distribution, and reproduction in any medium, provided the original work is properly cited. In accor- dance of the Creative Commons Attribution License all Copyrights © 2013 are reserved for SCIRP and the owner of the intellectual property Lingliang Long et al. All Copyright © 2013 are guarded by law and by SCIRP as a guardian. ABSTRACT In the present work, Compound 1 has been synthesized as a novel fluorescence ratiometric probe for CN−. Upon treat- ment with CN−, Probe 1 exhibited a fluorescence ratiometric response, with the emission wavelength shift from 570 nm to 608 nm. When 90 μM CN− was introduced, the emission ratios (I570/I608) of the probe changed dramatically from 0.52156 to 4.21472. The detection limit was also measured to be 0.24 μM (S/N = 3). In addition, Probe 1 had a selective response to CN−, while other anions caused nearly no interference. The sensing reaction product of Probe 1 with CN− was characterized by 1H NMR spectra and ESI Mass spectrometry. Furthermore, Probe 1 has been successfully applied to detect CN− in natural water samples. The fluorescence imaging experiments in living cells also demonstrated that Probe 1 could monitor CN− in biological samples. Keywords: Organic Fluorescence Materials; Fluorescent Probes; Cyanide; Fluorescence Imaging 1. Introduction Anion recognition has received intense attention due to its important role in an extensive range of environmental, clinical, chemical and biological applications [1]. Cya- nide (CN−) is one of the most important anions, and it has been widely used in various industrial fields such as gold mining, electroplating, metallurgy, synthetic fibers and resins [2]. But unfortunately, the cyanide is extremely detrimental to the living organism; it can inhibit the cel- lular respiration upon interacting strongly with the heme unit at the active site of cytochrome a3 [3]. Uptake of the toxic cyanide could occur through absorption by lungs, exposure to skin, and also from contaminated food and polluted drinking water [4-6]. Therefore, it is very im- portant to develop an efficient method to detect cyanide concentration in natural water sample and biological sample. Among various methods for measurement of CN−, the fluorescence method based on fluorescent probe is more attractive due to its desirable features including high sen- sitivity, simplicity, and potential for in vivo imaging [7]. Accordingly, in the past decade, a large number of fluo- rescent probes for detection of CN− have been reported in the literature [8]. Whereas many of them only utilized the changes in emission intensity as detecting signals. A major limitation of the intensity-based fluorescent probe is that the signal output could be interfered by the factors such as environmental conditions, probe distribution, and instrumental efficiency [9,10]. By contrast, a ratiometric measurement, employing the ratio of two emissions at different wavelengths as the detecting signal, could pro- vide a built-in correction for the above mentioned factors and thus allow more accurate analysis [11,12]. However, there are only very few fluorescence ratiometric probes that have been applied to monitor CN− concentration in water samples or biological samples [13-18]. Encouraged by these considerations, we developed Compound 1 as a novel fluorescence ratiometric probe for CN− in this work. Upon treatment with CN−, the probe showed ratiometric response. In addition, the probe has been successfully applied to detection of CN− level in natural water samples and living cells. *Corresponding author.  L. L. LONG ET AL. 308 2. Experimental Section 2.1. Reagents and Apparatus Unless otherwise stated, all reagents were purchased from commercial suppliers and used without further pu- rification. Solvents were purified by standard methods prior to use. Twice-distilled water was used throughout all experiments. Mass spectra were recorded on a LXQ Spectrometer (Thermo Scientific) operating on ESI. 1H NMR and 13C NMR spectra were recorded on a Bruker Avance 400 spectrometer operating at 400 MHz and 100 MHz re- spectively. Elemental (C, H, N) analysis were carried out using Flash EA 1112 analyzer. Electronic absorption spectra were obtained on a SHIMADZU UV-2450 spec- trometer. Fluorescence spectra were measured on a Pho- ton Technology International (PTI) Quantamaster fluorometer with 3 nm excitation and emission slit widths. Cells imaging were performed with an inverted fluorescence microscope (Carl Zeiss, Axio Observer A1). All pH measurements were performed with a pH-3c dig- ital pH-meter (Shanghai ShengCi Device Works, Shang- hai, China) with a combined glass-calomel electrode. 2.2. Synthesis 2.2.1. Synthesis of Compound 2 The synthetic procedures were showed in Scheme 1. Un- der the N2 atmosphere, a solution of 4-Diethylamino- salicylaldehyde (2.90 g, 15 mmol), diethylmalonate (4.8 g, 30 mmol) and piperidine (1 mL) in absolute ethanol (40 mL) was heated under reflux overnight. The ethanol was evaporated under reduced pressure, and then con- centrated HCl (20 mL) and glacial acetic acid (20 mL) were added to hydrolyze the reaction with stirring for another 6 hours. The solution was cooled to room tem- perature and poured into 150 mL ice water. NaOH solu- tion (40%) was added dropwise to modulate pH of the solution to 5, and a pale precipitate formed immediately. After stirring for 30 min, the mixture was filtered, washed with water, dried, then recrystallized in toluene to give 2 (2.70 g, yield 83%). 1H NMR (CDCl3, 400 MHz) δ (ppm): 7.55 (d, J = 9.3 Hz, 1H), 7.23 (d, J = 8.7 Hz, 1H), 6.59 (dd, J = 8.7 Hz, J = 2.4 Hz, 1H), 6.51 (d, J = 2.4 Hz, 1H), 6.06 (d, J = 9.3 Hz, 1H,), 3.42 (q, J = 7.2 Hz, 4H), 1.21 (t, J = 7.2 Hz, 6H). MS (m/z): 218.4 [M+H]+; Anal. calcd for C13H15NO2: C 71.87, H 6.96, N 6.45; found C 71.78, H 6.70, N 6.41. 2.2.2. Synthesis of Compound 3 Fresh distilled DMF (6.5 mL) was added dropwise to POCl3 (6.5 mL) at 20˚C - 50˚C with N2 atmosphere and stirred for 30 minutes to yield a red solution. This solu- tion was added to a solution of 7-diethylaminocoumarin (4.50 g, 20.7 mmol) in 30 mL DMF to allow a scarlet Scheme 1. (a) the sensing reaction of Probe 1 with CN−; (b) the synthetic procedure of Probe 1. suspension. The mixture was stirred at 60˚C overnight and then poured into 300 mL of ice water. NaOH solu- tion was added to adjust the pH = 5.0 of the mixture to yield large amount of precipitate. The crude product was filtered, thoroughly washed with water, dried and recrys- tallized in absolute ethanol to give 3 (3.67 g, yield 72.3%). 1H NMR (CDCl3, 400 MHz) δ (ppm): 10.13 (s, 1H), 8.26 (s, 1H), 7.41 (d, J = 8.8 Hz, 1H), 6.64 (dd, J = 2.4 Hz, 8.8 Hz, 1H), 6.49 (d, J = 2.4 Hz, 1H), 3.48 (q, J = 7.2 Hz, 4H), 1.26 (t, J = 7.2 Hz, 6H); MS (m/z): 246.1 [M+H]+; Anal. calcd for C14H15NO3: C 68.56, H 6.16, N 5.71; found C 68.49, H 6.20, N 5.68. 2.2.3. Synthesis of Probe 1 A solution of 3 (246 mg, 1 mmol), acetophenone (240 mg, 2 mmol) and pyrrolidine (4 drops) in 10 ml CHCl3 was stirred overnight at room temperature. The solvent was removed, and the residue was purified by column chromatography on silica gel (eluent: CH2Cl2) to afford Probe 1 as orange solid (236 mg, 68%). 1H NMR (CDCl3, 400 MHz) δ (ppm): 8.25 (d, J = 15.2 Hz, 1H), 8.11 (m, 2H), 7.80 (s, 1H), 7.66 (d, J=15.2 Hz, 1H), 7.57 (m, 1H), 7.51 (m, 2H), 7.35 (d, J = 8.8 Hz, 1H), 6.63(dd, J = 2.4 Hz, 8.8 Hz, 1H), 6.53 (d, J = 2.4 Hz, 1H), 3.46 (q, J = 7.2 Hz, 4H), 1.26(t, J = 7.2 Hz, 6H); 1H NMR (CDCl3, 100 MHz) δ (ppm): 190.8, 160.2, 156.6, 151.9, 146.1, 139.8, 138.4, 132.6, 130.0, 128.6, 128.5, 128.1, 123.0, 115.1, 109.5, 108.9, 97.0, 45.0, 12.5; MS (m/z): 348.1 [M+1]+; Anal. calcd for C22H21NO3: C 76.06, H 6.09, N 4.03; found C 75.97, H 6.11, N 4.00. 3. Results and Discussions 3.1. Optical Response to CN− The sensing properties of Probe 1 in response to CN− were investigated in 20 mM potassium phosphate buffer/ CH3CN (v/v 1: 4, pH 7.4) at room temperature. As shown in Figure 1(a), in the absence of CN−, Probe 1 displayed fluorescence emission centered at 570 nm. However, when increasing concentrations of CN− were introduced, the emission at 570 nm gradually decreased. Open Access AMPC  L. L. LONG ET AL. 309 Concomitantly, a new emission centered at 608 nm ap- peared and increased, with a well-defined isoemission point at 588 nm. The changes in fluorescence emission spectra also elicited an obvious variation in emission color. With the addition of CN−, the fluorescence color of Probe 1 changed from green to red (Figure 1(a)). There- fore, Probe 1 can be used as a nake eye indicator for CN−. In addition, the emission ratio (I608/I570) of Probe 1 re- sponse to CN− displayed a large increase from 0.52156 to 4.21472 after 90 μM CN− added (8-fold enhancement) (Figure 2). The emission ratios (I608/I570) also showed a good linearity with CN− concentration in the range of 0 - 30 μM (Figure 1(b)), indicating the probe can be poten- tially used to quantitatively detection of CN−. The detec- tion limit for CN− was estimated to be 0.24 μM (S/N = 3) according to a reported procedure [19]. The low detec- tion limit together with the large emission ratio en- hancement demonstrates that Probe 1 is highly sensitive to CN−. The absorption spectra of Probe 1 in the nm. (a) (b) Figure 1. Changes in fluorescence emission spectra (λex = 510 nm) of Probe 1 (5 μM) with various amount of CN− (0 to 90 μM), inset: visual fluorescence color changes of Probe 1 (5 μM) in the absence and presence of CN− (90 μM), the photo was taken under illumination of a handheld UV lamp; (b) Changes in fluorescence emission ratios (I608/I570) of Probe 1 (5 μM) to various amount of CN− (0 to 30 μM). Upon addition of increasing concentrations of CN−, pres- ence of different amounts of CN− are shown in Figure 3. Probe 1 itself exhibited absorption centered at 449 the absorption peak at 449 nm decreased, and a new absorp- tion peak at 506 nm appeared and increased. At the same time, the solution color varied from yellow to red (Fig- ure 3). 3.2. Selectivity Studies As shown in Figure 4, Probe 1 response to other anions was also investigated. The anions such as F−, Cl−, Br−, I−, 3 HSO , CH3COO−, 4 ClO , 24 , 3 HPO HCO , 3 NO , SCN− exerted no visible effect on the fluorescence ratios (I608 / I570) of Probe 1. Obviously, large fluorescence ratio change was only observed for Probe 1 treated with CN−. Moreover, the ratiometric responses of Probe 1 toward CN− in the presence of other anions were examined. Most of other anions gave nearly no influence on Probe 1 detection of CN− (Figure 4). These results demonstrated that Probe 1 had selective response towards CN−. Figure 2. Changes in fluorescence emission ratios (I608/I570) of Probe 1 (5 μM) to various amount of CN− (0 to 90 μM), λex = 510 nm. Figure 3. Changes in absorption spectra of Probe 1 (5 μM) with various amount of CN− (0 to 90 μM), inset: visible color changes of Probe 1 (5 μM) in the absence and pres- ence of CN− (90 μM). Open Access AMPC  L. L. LONG ET AL. 310 Figure 4. Fluorescence ratiometric response of Probe 1 (5 μM) to various anions (90 μM) in the absence (blank bar) and presence (red bar) of CN− (90 μM). 1) blank; 2) F−; 3) Cl−; 4) Br−; 5) I−; 6) ; 7) CH3COO−; 8) 3 HSO 4 ClO ; 9) ; 10) ; 11) ; 12) SCN−. Excitation wavelength was 510 nm. 24 HPO 3 HCO 3 NO 3.3. Response Time and Effect of pH The kinetic studies of Probe 1 in the absence or presence of CN− was investigated by fluorescence spectra. As dis- played in Figure 5, in the absence of CN−, almost no variation in emission intensity (at 608 nm) of Probe 1 was found, implying that Probe 1 was stable in the assay condition. However, upon addition of CN− (90 μM), a dramatic enhancement in emission intensity at 608 nm was observed, denoting the rapid reaction of Probe 1 with CN−. And the emission intensity reached a plateau after 30 min reaction. The responses of Probe 1 toward CN− at different pH conditions were also conducted (Figure 6). Probe 1 can be employed to detect CN− in the pH range of 5.5 - 9.5, and function properly at physio- logical pH. Thus, Probe 1 can be potentially utilized to detect CN− in biological samples. 3.4. Reaction Products of Probe 1 with CN− In order to investigate the reaction product of Probe 1 with CN−, the product of the Probe 1 with CN− was iso- lated and subjected to 1H NMR characterization. As shown in Figure 7, the resonance signal of hydrogen (Hd) at 4-position of the coumarin ring was completely disap- peared in the isolated product of Probe 1 with CN−. This observation clearly indicated that the hydrogen at the 4-position of the coumarin ring was substituted by CN− and formed a 1-CN adduct. Moreover, the formation of 1-CN adduct was further confirmed by ESI Mass spec- trometry, where a major peak at m/z 373.35 is assigned to [1-CN+H]+ (Figure 8).Thus, we proposed a possible reaction mechanism as shown in Figure 9. It included a nucleophilic addition reaction of the CN− with the cou- marin ring, and subsequent an elimination reaction. The specific nucleophilic addition reaction renders Probe 1 selective response to CN−. Figure 5. Time dependent fluorescence intensity (608 nm) changes of Probe 1 (5 μM) in the absence (■) or presence (●) of 90 μM CN−. Figure 6. The variations of emission ratio (I608/I570) of Probe 1 (5 μM) in the absence (■) or presence (●) of CN− (90 μM) as a function of pH. 3.5. Detection of Cyanide in Natural Water Samples The water resource may be contaminated by CN− from the industrial waste. According to the World Health Or- ganization, the maximum acceptable level of cyanide in drinking water is 1.9 μM [20]. Thus it is high importance to monitor the level of CN− in water samples. The crude water samples were obtained from Yangtzi River, pond water and tap water, and were filtered through microfilm- tration membrane before use. After the probe being treated with the water samples, ratiometic values (I608/I570) were determined. The CN− concentration in these water samples was not detected. Next, the water samples were spiked with standard CN− solutions and then analyzed with Probe 1, the results are shown in Table 1. PROBE 1 was able to measure the concentrations of spiked CN− with good recovery. 3.6. Fluorescence Imaging in Living Cells To study the utility of Probe 1 detecting CN− in biologi- cal sample, the Probe 1 was applied for fluorescence im- aging in living cells. The pancreatic cancer cells was incubated with Probe 1 (1 μM) for 30 min at 37˚C. After washing with PBS buffer three times, the cells were used Open Access AMPC  L. L. LONG ET AL. Open Access AMPC 311 Figure 7. Partial 1H NMR (400 MHz) spectra of 1) Probe 1 and 2) the isolated product of Probe 1 + CN−. Figure 8. The ESI-Mass spectra of the isolated product of Probe 1 + CN−. Figure 9. The proposed reaction mechanism of Probe 1 with CN−. 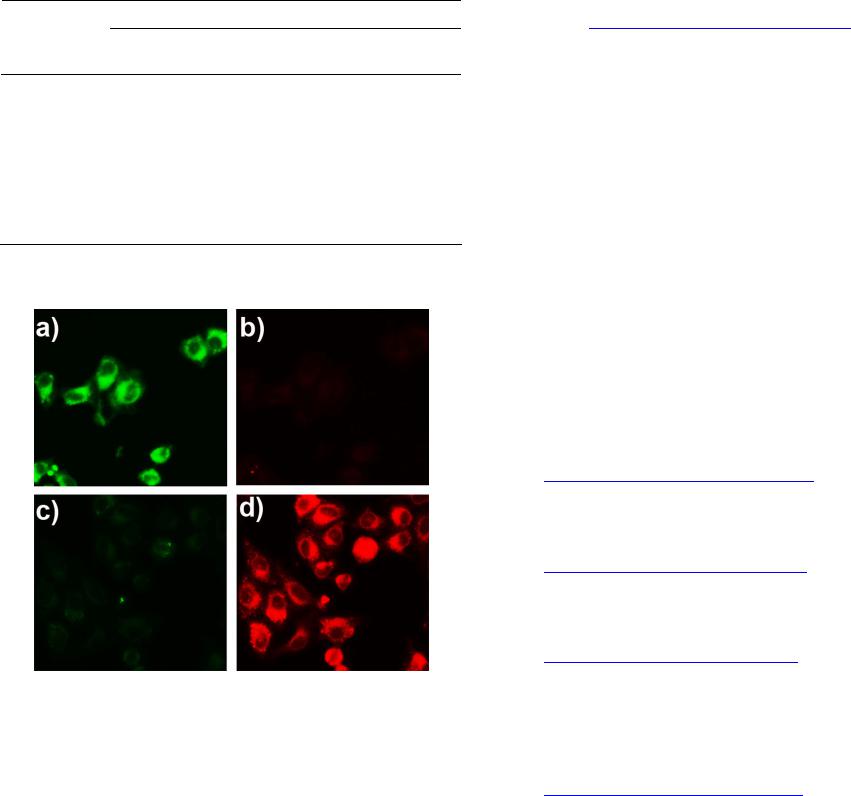 L. L. LONG ET AL. 312 for fluorescence imaging. As shown in Figure 10, the cells exhibited strong fluorescence in the green channel (Figure 10 a)), and nearly no fluorescence in the red channel (Figure 10 b)). These indicated that the probe was cell membrane permeable. When the cell was pre- treated with tetrabutylammonium cyanide (60 μM) for 10 min, and then further incubated with Probe 1 (1 μM) for 30 min, the cells exhibited strong fluorescence in the red channel (Figure 10 d)), but almost no fluorescence in the green channel (Figure 10 c)). These studies demon- strated that Probe 1 could detect CN− in living cells. 4. Conclusion A fluorescence ratiometric probe, Compound 1, for CN− has been constructed. Upon treatment with CN−, the flu- orescence of Probe 1 exhibited red shift from 570 nm Table 1. Determination of CN− concentrations in natural water samples. Spiked CN− Sample CN− spiked (mol·L−1) CN− recovered (mol·L−1)a Recovery (%) River 1 0 Not detected - River 2 3.00 × 10⁻⁶ (3.13 ± 0.04) × 10−6 104.3 Pond water 1 0 Not detected - Pond water 2 3.00 × 10⁻⁶ (3.13 ± 0.04) × 10−6 100.3 Tap water 1 0 Not detected - Tap water 2 3.00 × 10⁻⁶ (3.13 ± 0.04) × 10−6 100.3 aRelative standard deviations were calculated based on three times of meas- urement. Figure 10. Fluorescence image of the pancreatic cancer cells stained with Probe 1 (1 μm) for 30 min with emission at 530 ± 10 nm a) and emission at 610 ± 10 nm b); fluorescence image of the pancreatic cancer cells pre-treated with CN− (60 μm) for 10 min, and then stained with Probe 1 (1 μm) for 30 min with emission at 530 ± 10 nm c) and emission at 610 ± 10 nm d). to 608 nm, with the emission ratio (I608/I570) changing dramatically from 0.52156 to 4.21472. Probe 1 also had a selective response towards CN−, while other anions gave almost no influence on Probe 1 detection of CN−. Fur- thermore, Probe 1 has been successfully applied to de- tection of CN− in natural water samples and living cells. 5. Acknowledgements This research was financially supported by National Na- tural Science Foundation of China (21202063), the Natu- ral Science Foundation of Jiangsu Province (BK2012281), the China Postdoctoral Science Foundation (2012M511200), and the Research Foundation of Jiangsu University (11JDG078). REFERENCES [1] R. Martínez-Máñez and F. Sancenón, “Fluorogenic and Chromogenic Chemosensors and Reagents for Anions,” Chemical Reviews, Vol. 103, No. 11, 2003, pp. 4419- 4476. http://dx.doi.org/10.1021/cr010421e [2] C. Young, L. Tidwell and C. Anderson, “Cyanide: Social Industrial and Economic Aspects,” The Minerals, Metals, and Materials Society, Warrendale, 2001. [3] B. Vennesland, E. E. Comm, C. J. Knownles, J. Westly, F. Wissing, “Cyanide in biology,” Academic Press, London, 1981. [4] J. Z. Jiang, X. Y. Wang, W. J. Zhou, H. C. Gao and J. G. Wu, “Extraction of Gold from Alkaline Cyanide Solution by the Tetradecyldimethylbenzylammonium Chloride/ Tri-n-Butyl Phosphate/N-Heptane System Based on a Mi- croemulsion Mechanism,” Physical Chemistry Chemical Physics, Vol. 4, No. 18 ,2002, pp. 4489-4494. [5] J. L. Gerberding, “Toxicological Profile for Cyanide,” US Department of Health and Human Services, Atlanta, 2006. [6] X. D. Lou, D. X. Ou, Q. Q. Li and Z. Li, “An Indirect Approach for Anion Detection: The Displacement Strat- egy and Its Application,” Chemical Communications, Vol. 48, No. 68, 2012, pp. 8462-8477. http://dx.doi.org/10.1039/c2cc33158f [7] Y. Yang, Q. Zhao, W. Feng and F. Li, “Luminescent Chemodosimeters for Bioimaging,” Chemical Reviews, Vol. 113, No. 1, 2013, pp. 192-270. http://dx.doi.org/10.1021/cr2004103 [8] Z. Xu, X. Chen, H. N. Kim and J. Yoon, “Sensors for the Optical Detection of Cyanide Ion,” Chemical Society Re- views, Vol. 39, No. 1, 2010, pp. 127-137. http://dx.doi.org/10.1039/b907368j [9] D. Srikun, E. W. Miller, D. W. Domaille and C. J. Chang, “An ICT-Based Approach to Ratiometric Fluorescence Imaging of Hydrogen Peroxide Produced in Living Cells,” Jouranl of the American Chemical Society, Vol. 130, No. 14, 2008, pp. 4596-4597. http://dx.doi.org/10.1021/ja711480f [10] K. Komatsu, Y. Urano, H. Kojima and T. Nagano, “De- Open Access AMPC  L. L. LONG ET AL. 313 velopment of an Iminocoumarin-Based Zinc Sensor Suitable for Ratiometric Fluorescence Imaging of Neu- ronal Zinc,” Journal of the American Chemical Society, Vol. 129, No. 44, 2007, pp. 13447-13454. http://dx.doi.org/10.1021/ja072432g [11] K. Kikuchi, H. Takakusa and T. Nagano, “Recent Ad- vances in the Design of Small Molecule-Based FRET Sensors for Cell Biology,” TrAC, Trends in Analytical Chemistry, Vol. 23, No. 6, 2004, pp. 407-415. http://dx.doi.org/10.1016/S0165-9936(04)00608-9 [12] J. V. Mello and N. S. Finney, “Dual-Signaling Fluores- cent Chemosensors Based on Conformational Restriction an Induced Charge Transfer,” Angewandte Chemie Inter- national Edition, Vol. 40, No. 8, 2001, pp. 1536-1538. http://dx.doi.org/10.1002/1521-3773(20010417)40:8<153 6::AID-ANIE1536>3.0.CO;2-R [13] K. P. Divya, S. Sreejith, B. Balakrishna, P. Jayamurthy, P. Anees and A. Ajayaghosh, “A Zn2+-specific Fluorescent Molecular Probe for the Selective Detection of Endoge- nous Cyanide in Biorelevant Samples,” Chemical Com- munications, Vol. 46, No. 33, 2010, pp. 6069-6071. http://dx.doi.org/10.1039/c0cc01159b [14] S. Saha, A. Ghosh, P. Mahato, S. Mishra, S. K. Mishra, E. Suresh, S. Das and A. Das, “Specific Recognition and Sensing of CN− in Sodium Cyanide Solution,” Organic Letters, Vol. 12, No. 15, 2010, pp. 3406-3409. http://dx.doi.org/10.1021/ol101281x [15] J. Liu, Y. Liu, Q. Liu, C. Li, L. Sun and F. Li, “ Irid- ium(III) Complex-Coated Nanosystem for Ratiometric Upconversion Luminescence Bioimaging of Cyanide Anions,” Journal of the American Chemical Society, Vol. 133, No. 39, 2011, pp. 15276-15279. http://dx.doi.org/10.1021/ja205907y [16] X. Cheng, R. Tang, H. Jia, J. Feng, J. Qin and Z. Li, “New Fluorescent and Colorimetric Probe for Cyanide: Direct Reactivity, High Selectivity, and Bioimaging Ap- plication,” ACS Applied Materials & Interfaces, Vol. 4, No. 8, 2012, pp. 4387-4392. http://dx.doi.org/10.1021/am3010412 [17] L. Long, L. Zhou, L. Wang, S. Meng, A. Gong, F. Du and C. Zhang, “A Highly Selective and Sensitive Fluores- cence Ratiometric Probe for Cyanide and Its Application for the Detection of Cyanide in Natural Water and Bio- logical Samples,” Analytical Methods, Vol. 5, No. 23, 2013, pp. 6605-6610. [18] S. Kumar, P. Singh, G. Hundal, M. S. Hundal and S. Kumar, “A Chemodosimeter for Ratiometric Detection of Cyanide in Aqueous Media and Human Blood Serum,” Chemical Communications, Vol. 49, No. 26, 2013, pp. 2667-2669. http://dx.doi.org/10.1039/c3cc40435h [19] B. Zhu, C. Gao, Y. Zhao, C. Liu, Y. Li, Q. Wei, Z. Ma, B. Du and X. Zhang, “A 4-Hydroxynaphthalimide-Derived Ratiometric Fluorescent Chemodosimeter for Imaging Palladium in Living Cells,” Chemical Communications, Vol. 47, No. 30, 2011, pp. 8656-8658. http://dx.doi.org/10.1039/c1cc13215f [20] “Guidelines for Drinking-Water Quality,” World Health Organization, Geneva, 1996. Open Access AMPC
|