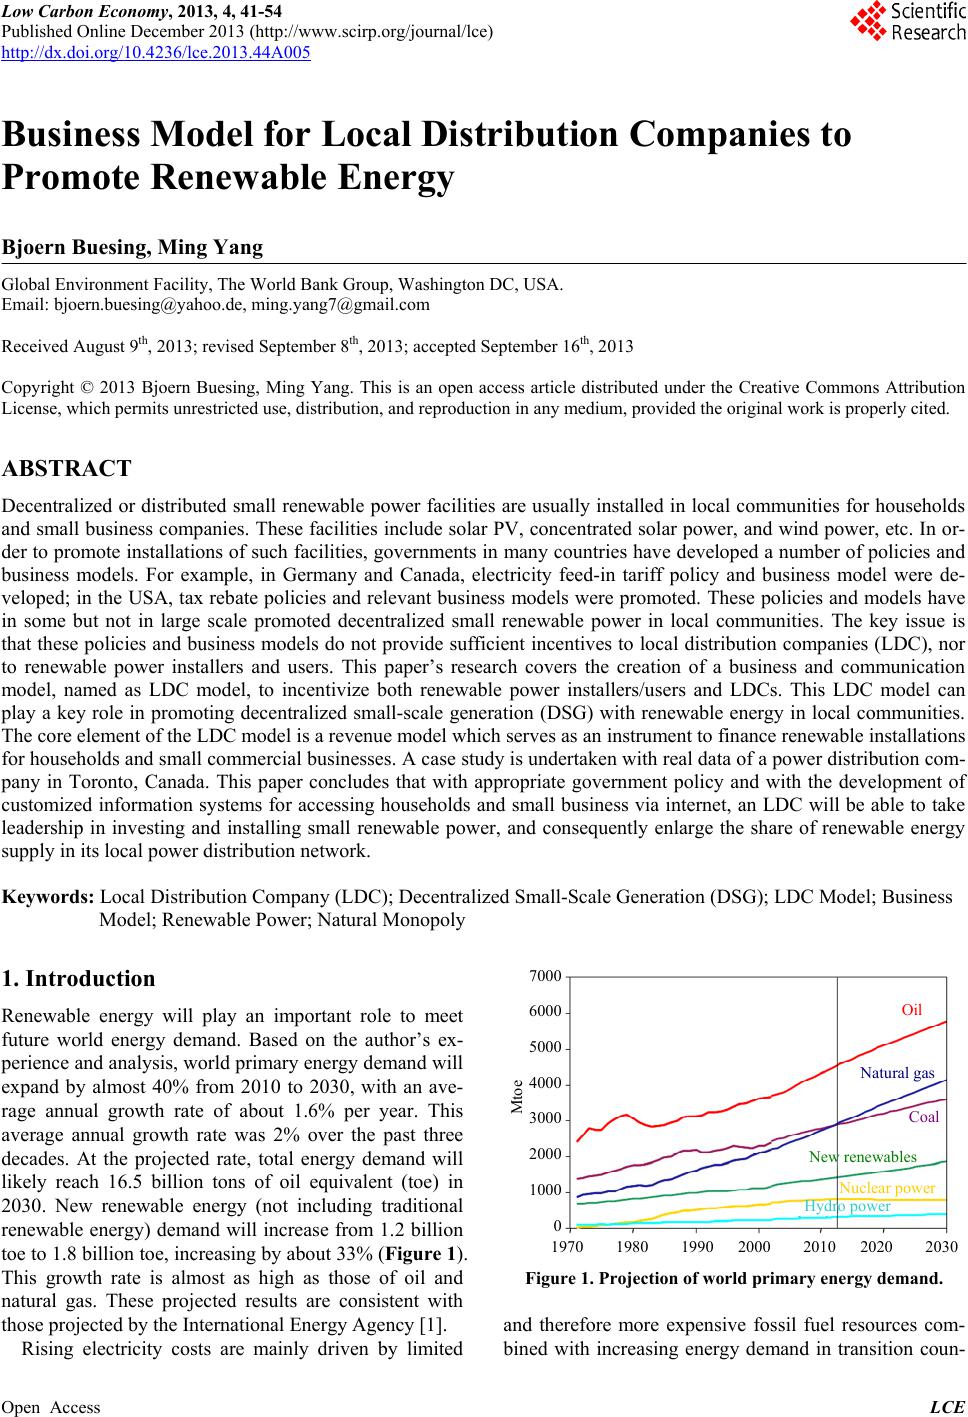
 Low Carbon Economy, 2013, 4, 41-54 Published Online December 2013 (http://www.scirp.org/journal/lce) http://dx.doi.org/10.4236/lce.2013.44A005 Open Access LCE 41 Business Model for Local Distribution Companies to Promote Renewable Energy Bjoern Buesing, Ming Yang Global Environment Facility, The World Bank Group, Washington DC, USA. Email: bjoern.buesing@yahoo.de, ming.yang7@gmail.com Received August 9th, 2013; revised September 8th, 2013; accepted September 16th, 2013 Copyright © 2013 Bjoern Buesing, Ming Yang. This is an open access article distributed under the Creative Commons Attribution License, which permits unrestricted use, distribution, and reproduction in any medium, provided the original work is properly cited. ABSTRACT Decentralized or distributed small renewable power facilities are usually installed in local communities for households and small business companies. These facilities include so lar PV, concentrated solar power, and wind power, etc. In or- der to promote installations of such facilities, governments in many countries have developed a number of policies and business models. For example, in Germany and Canada, electricity feed-in tariff policy and business model were de- veloped; in the USA, tax rebate policies and relevant business models were promoted. These policies and models have in some but not in large scale promoted decentralized small renewable power in local communities. The key issue is that these policies and business models do no t provide sufficient incentiv es to local distribution companies (LDC), nor to renewable power installers and users. This paper’s research covers the creation of a business and communication model, named as LDC model, to incentivize both renewable power installers/users and LDCs. This LDC model can play a key role in promoting decentralized small-scale generation (DSG) with renewable energy in local communities. The core element of the LDC model is a revenue model which serves as an instrument to finance renewable installations for households and small commercial businesses. A case study is undertaken with real data of a power distribution com- pany in Toronto, Canada. This paper concludes that with appropriate government policy and with the development of customized information systems for accessing households and small business via internet, an LDC will be able to take leadership in investing and installing small renewable power, and consequently enlarge the share of renewable energy supply in its local power distribution network. Keywords: Local Distribution Company (LDC); Decentralized Small-Scale Generation (DSG); LDC Model; Business Model; Renewable Power; Natural Monopoly 1. Introduction Renewable energy will play an important role to meet future world energy demand. Based on the author’s ex- perience and analysis, wo rld primary energy demand will expand by almost 40% from 2010 to 2030, with an ave- rage annual growth rate of about 1.6% per year. This average annual growth rate was 2% over the past three decades. At the projected rate, total energy demand will likely reach 16.5 billion tons of oil equivalent (toe) in 2030. New renewable energy (not including traditional renewable energy) demand will increase from 1.2 billion toe to 1.8 billion toe, increasing by abou t 33% (Figure 1). This growth rate is almost as high as those of oil and natural gas. These projected results are consistent with those projected by the International Energy Agency [1]. Rising electricity costs are mainly driven by limited 1970 1980 1990 2000 2010 2020 2030 7000 6000 5000 4000 3000 2000 1000 0 Oil atural gas Coal New renewables Mtoe uclear powe Hydro power Figure 1. Projection of world primary energy demand. and therefore more expensive fossil fuel resources com- bined with increasing energy demand in transition coun-  Business Model for Local Distribution Companies to Promote Renewable Energy 42 tries like India and China. Other industrialized countries try to limit energy costs by focusing on nuclear power, also expensive but often considered as an environmental- friendly alternative due to the lack of direct GHG emis- sions. Large-scale installations of wind and solar energy are becoming more and more competitive, and their con- tribution to the global electricity production has increa- sed significantly over the past 20 years. During the same time period, the decentralized small- scale generation (DSG) level has remained low. Conse- quently, the central research question is, whether an ap- propriate business model for the local distribution com- pany(ies) (LDC) and its stakeholders could make DSG become more profitable and thus could lead to a world- wide and crucial expansion of DSG. Further, we have derived the following specific research questions: Which determinants for the business model follow from the industry structure of the LDC and the re- newables market environment? How can the LDC propose offers to specific customer segments via internet, including alternatives and com- plementary products? How can renewable projects be realized efficiently and effectively? The methodology for this research comprises two parts. At first, we have evaluated existing research on business model concepts or taxonomies in order to derive a plau- sible procedure to construct a business model for an LDC in the DSG context. Second, the bu siness model is being embedded into the local context of Toronto, which en- ables a case study. While the first part represents a quail- tative, conceptual research, the case study will be com- pleted with a quantitative data analysis trying to verify the assumptions which follow from the qualitative re- search. According to the literature review performed by the authors, applying academic business model concepts to the LDC industry structure and testing it thru a case study, represent a new, unprecedented research. One result of this research shows that a subsidized rate per electricity amount fed back to the local grid, cur- rently the only end customer revenue source, can be ex- tended effectively by offering multiple and customizable revenue model variants. Thus a broader customer base could effectively contribute to the DSG market, for in- stance those risk or investment-avert customers, which currently do not participate in DSG. In addition, the LDC is poised to impartially assess customer locations’ potential for different kinds of re- newable energy. The research has shown that it can ac- tively consult and in teract with renewables produ cers and different end customer groups in order to decisively lift the DSG share of electricity production. According to our case study, a moderate community tax could provide ad- ditional capital, allowing all citizens to contribute to the DSG expansion. The target audience of this paper is identical with the actors of the proposed business model, i.e. renewable producers, local citizens and the LDC. At present, the world-wide majority of LDCs play only a minor role in the promotion of DSG, but this paper shows a way for an LDC to play a key role and form a strong team with re- newable producers and local citizens. 2. Literature Review Major goals of the literature review are to validate methods to construct a business model in a new context, and to specify this LDC renewable context related to the chosen real-world scenario of Toronto. Business model literature on one hand plus case study literature on the other form the basis of this review. The literature scope includes e-commerce and website communication, re- newables, the LDC industry structure and secondary data related to the real-world background of Toronto, Canada. Some of these literature sources will be analyzed and applied for the first time in the case study chapter, due to the circumstance that literature analysis and application to the construction of the LDC model are often insepara- ble in the chosen domain of research. Despite the well-established research field of (internet) business models and related taxonomies, the LDC sector has not been taken into account at least not as a specific category. Nor could the authors find inductive research which tried to apply the available (internet) business models to LDCs. Two articles are related to this research but they do not close the aforementioned gaps: 1) Reference [2] examines “the impact of increasing DG penetration on the DSO [distribution system operator] business under varying parameters (network characteris- tics, DG technologies, network management type)” but their research does not deal with a business model for the DSO (alias LDC) and its surrounding stakeholders as proposed in this research. 2) Reference [3] evaluates which “business models investment managers for renewable energy prefer to in- vest in.” However, his study does not do any inductive research to apply business models to LDCs. 2.1. Constructing Business Models The Internet Business Model (IBM) definition by Wang and Chan [4] classifies business models by the “transac- tional flows” between “actors”. This concept is being used in this research to model ways of communication and transactions between the LDC and its stakeholders. The visualization of the LDC model constructed in Figure 2 follows Wang and Chan’s concept of an “IBM graph” with arrows symbolizing transactions between actors. Specifying a transaction and Open Access LCE 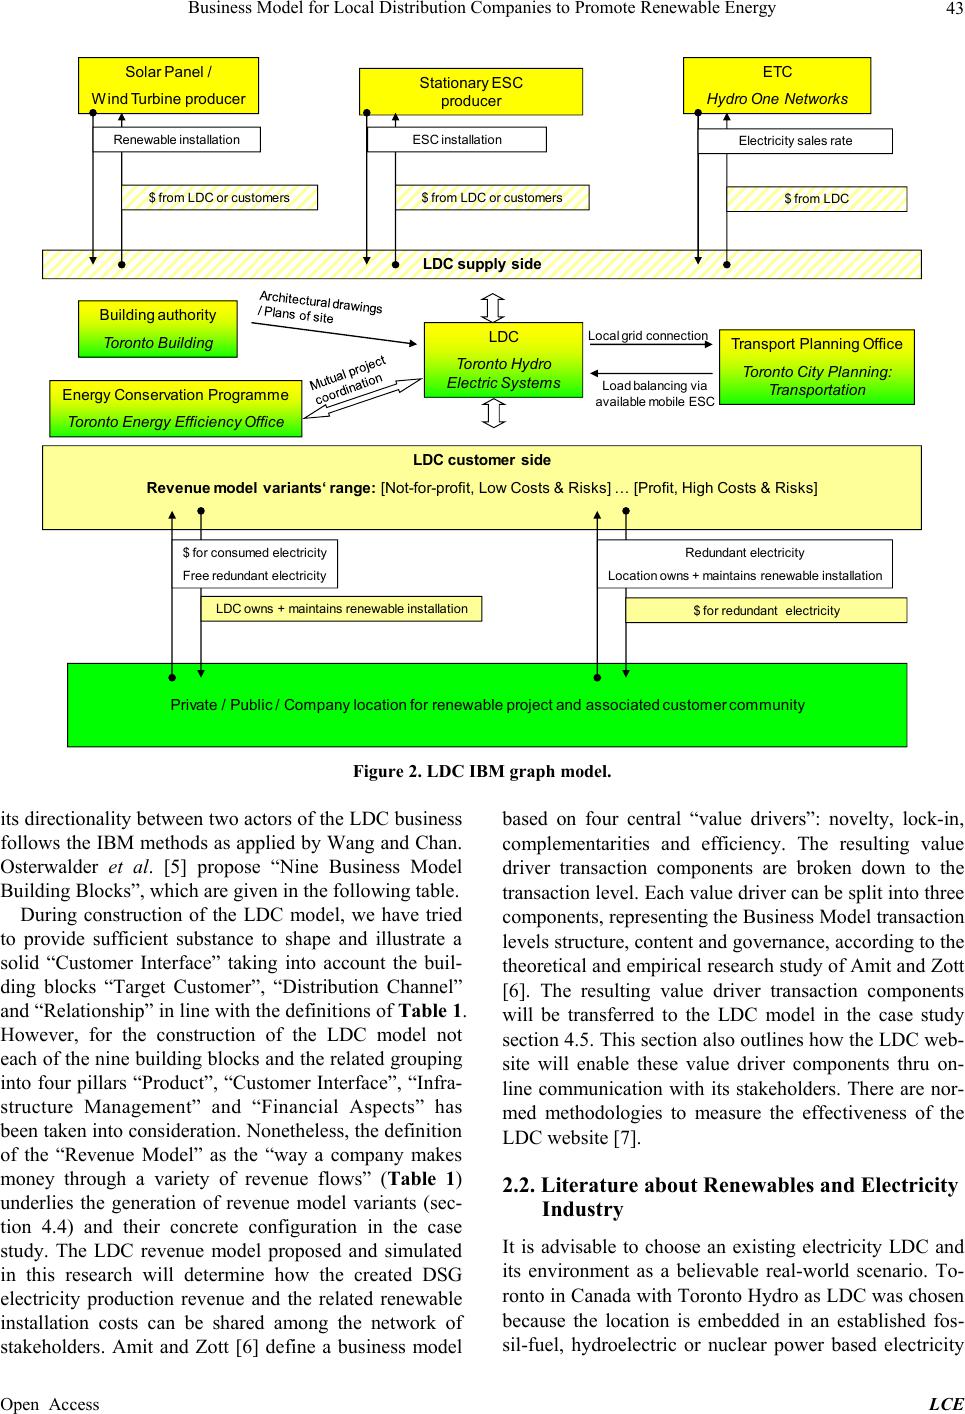 Business Model for Local Distribution Companies to Promote Renewable Energy Open Access LCE 43 LDC cu stom erside Revenuemodelvariants‘ range: [Not- for-profit, LowCosts& Risks] … [Profit, H igh Costs& Risks] LDC Toro nto H ydro Electric Systems Building authority Toro nto Building Energy C onserv ation Progr amme Toronto Energy Efficiency O ffice Transport Pl anning Office Toronto City Planning: Transportation Private / Public / Company location for renewable project and associated customer communit y Solar Panel / Wind Turbine producerStationary ESC producer ETC Hydr o One Ne tworks Local grid conn ection Load balan cing via availab le m obil e ESC LDC supply side $ for consum ed el ectricity Free redundant electricity LDC owns + m ain tains renew abl e instal lation Redundant el ectricity Location ow ns + m aintain s renew abl e in stall ation $ for redundant electricity $ fromLDC or cu stomers Ren ewab le in stall ationESC install ation $ from LDC or cu stom er s El ectr icity sal es rat e $ from LDC Figure 2. LDC IBM graph model. its directionality between two actors of the LDC busin ess follows the IBM methods as applied by Wang and Chan. Osterwalder et al. [5] propose “Nine Business Model Building Blocks”, which are given in the following table. based on four central “value drivers”: novelty, lock-in, complementarities and efficiency. The resulting value driver transaction components are broken down to the transaction level. Each value driver can be split in to three components, representing the Business Model transaction levels structure, content and governance, according to the theoretical and empirical research study of Amit and Zott [6]. The resulting value driver transaction components will be transferred to the LDC model in the case study section 4.5. This section also outlin es how the LDC web- site will enable these value driver components thru on- line communication with its stakeholders. There are nor- med methodologies to measure the effectiveness of the LDC website [7]. During construction of the LDC model, we have tried to provide sufficient substance to shape and illustrate a solid “Customer Interface” taking into account the buil- ding blocks “Target Customer”, “Distribution Channel” and “Relationship” in line with the definitions of Tab le 1. However, for the construction of the LDC model not each of the nine building blocks and the related grouping into four pillars “Product”, “Customer Interface”, “Infra- structure Management” and “Financial Aspects” has been taken into consideration . Nonetheless, the d efinition of the “Revenue Model” as the “way a company makes money through a variety of revenue flows” (Table 1) underlies the generation of revenue model variants (sec- tion 4.4) and their concrete configuration in the case study. The LDC revenue model proposed and simulated in this research will determine how the created DSG electricity production revenue and the related renewable installation costs can be shared among the network of stakeholders. Amit and Zott [6] define a business model 2.2. Literature about Renewables and Electricity Industry It is advisable to choose an existing electricity LDC and its environment as a believable real-world scenario. To- ronto in Canada with Toronto Hydro as LDC was chosen because the location is embedded in an established fos- sil-fuel, hydroelectric or nuclear power based electricity 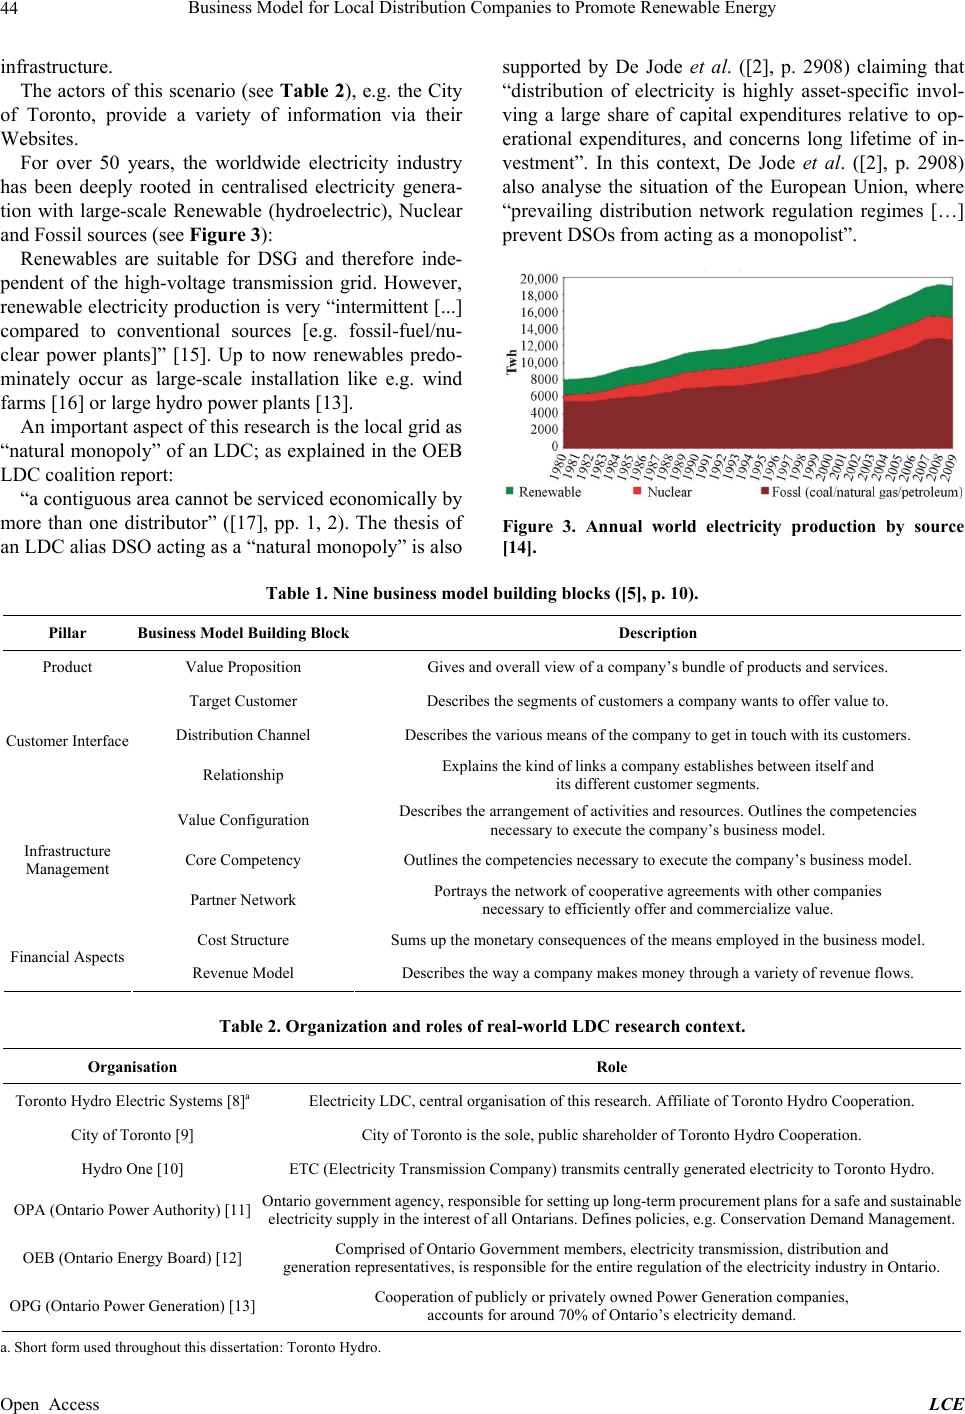 Business Model for Local Distribution Companies to Promote Renewable Energy 44 infrastructure. The actor s of this scenario (see Table 2), e.g. the City of Toronto, provide a variety of information via their Websites. For over 50 years, the worldwide electricity industry has been deeply rooted in centralised electricity genera- tion with large-scale Renewable (hydroelectric), Nuclear and Fossil sources (see Figure 3): Renewables are suitable for DSG and therefore inde- pendent of the high-voltage transmission grid. However, renewable electricity production is very “intermittent [...] compared to conventional sources [e.g. fossil-fuel/nu- clear power plants]” [15]. Up to now renewables predo- minately occur as large-scale installation like e.g. wind farms [16] or large hydro power plants [13]. An important aspect of this research is the local grid as “natural monopoly” of an LDC; as explained in the OEB LDC coalition report: “a contiguous area cannot be serviced economically by more than one distributor” ([17], pp. 1, 2). The thesis of an LDC alias DSO acting as a “natural monopoly” is also supported by De Jode et al. ([2], p. 2908) claiming that “distribution of electricity is highly asset-specific invol- ving a large share of capital expenditures relative to op- erational expenditures, and concerns long lifetime of in- vestment”. In this context, De Jode et al. ([2], p. 2908) also analyse the situation of the European Union, where “prevailing distribution network regulation regimes […] prevent DSOs from acting as a monopolist”. Figure 3. Annual world electricity production by source [14]. Table 1. Nine business model building blocks ([5], p. 10). Pillar Business Model Building Block Description Product Value Proposition Gives and overall view of a company’s bundle of products and services. Target Customer Describes the segments of customers a company wants to offer value to. Distribution Channel Describes the various means of the company to get in touch with its customers. Customer Interface Relationship Explains the kind of links a company establishes between itself and its different customer segments. Value Configuration Describes the arrangement of activities and resources. Outlines the competencies necessary to execute the company’s business model. Core Competency Outlines the competencies necessary to execute the company’s business model. Infrastructure Management Partner Network Portrays the network of cooperative agreements with other companies necessary to efficiently offer and commercialize value. Cost Structure Sums up the monetary consequences of the means employed in the business model. Financial Aspects Revenue Model Describes the way a company makes money through a variety of revenue flows. Table 2. Organization and roles of real-world LDC research context. Organisation Role Toronto Hydro Electric Systems [8]aElectricity LDC, central organisation of this research. Affiliate of Toronto Hydro Coope rati on. City of Toronto [9] City of Toronto is the sole, public shareholder of Toronto Hydro Cooperation. Hydro One [10] ETC (Electricity Transmission Company) transmits centrally generated electricity to Toronto Hydro. OPA (Ontario Power Authority) [11]Onta ri o g ov er nm en t a ge nc y , r es p on si bl e f or s et t in g up lo ng - te rm pr o cu rement p la ns f o r a sa fe a n d su st a in ab l e electricity supply in the interest of all Ontarians. Defines policies, e.g. Conservation Demand Management. OEB (Ontario Energy Board) [12] Comprised of Ontario Government members, electricity transmission, distribution and generation representatives, is responsible for the entire regulation of the electricity industry in Ontario. OPG (Ontario Power Generation) [13] Cooperation of publicly or privately owned Power Generation companies, accounts for around 70% of Ontario’s electricity demand. a. Short form used throughout this dissertation: Toronto Hydro. Open Access LCE  Business Model for Local Distribution Companies to Promote Renewable Energy 45 Toronto Hydro, a municipally owned LDC since 1911 [8], has been preferred to Hydro One for this research as underlying LDC. A municipally owned LDC is less prone to act as a lobbyist of oligarchic power centralisa- tion and hence more open to promote DSG. Toronto Hy- dro receives its electricity from Hydro One, which dis- tributes electricity to—mainly industrial—end consumers all over Ontario [18]. Despite deregulation and privatization taking place in the electricity distribution business [19], the natural mo- nopoly of an LDC over the local grid—as is the case for Toronto Hydro—can be assumed as prevailing case world-wide at present and as well for the middle-term future. The natural monopoly is independent of the form of LDC ownership (private or public). In Canada and Ontario LDCs are by the majority publicly owned with a “trend towards provincial ownership”, according to The Canadian Encyclopedia [20]. Experts can analyse the DSG potential of a given loca- tion, for example to which degree at and which costs roughly solar PV and wind power can contribute to the local electricity consumption demand [21]. The case study will reference manufacturers’ info about the se- lected renewable products for small-scale solar PV and wind turbine installations. Even though not a renewable product per se, small-scale CHP (Combined Heat and Power) plants, often based on natural gas, can be easily installed in buildings as demonstrated b y the German uti- lity EWE ([22], pp. 24, 25). Due to its high efficiency CHP can also contribute to effectively reduce GHG emissions on a local level. 3. Approach to Construct the LDC Model In the previous chapter a set of business model construc- tions methods have been evaluated and assessed as ap- propriate for application to the LDC renewable context. The basic framework of the LDC renewable context has already been defined with the LDC stakeholders in To- ronto. This chapter defines the approach to construct the LDC model combining the construction methods and specifying a sequence of four steps which will also detail further the LDC business and website communication model and its connection to the chosen real-world back- ground: 1) Set up the real-world LDC renewable context based on the available basic framework (Stage 1). 2) Transform the real-world LDC renewable context (stage 1) into a basic LDC model. This implies specify- ing actors and transactions according to th e IBM concept (Stage 2). 3) Adding the revenue model and the value driver con- cept to enhance the basic LDC model (Stage 2); thereby finding detailed answers to the research questions. Re- venue model variants and value driver components will be specified in this step (Stage 3). 4) Estimating the value potential of the LDC model, based on a simulation with in the given boundaries of the real-world backgro und (Stage 4). The first three steps will result in the qualitative and step four in the quantitative part of the case study, see Figure 4. 4. Case Study The case s tudy conclude s our research with th e construc- tion and evaluation of the LDC model embedded in the real-world back ground with the LDC Toronto Hydro and its stakeholders. First, the LDC renewable context, partly set up in the literature review, will be completed. Th en, the basic LDC model is constructed in section “Actors and transactions”, and enhanced in the sections “Flexible revenue model”, “Value drivers of the LDC model” and “Interactive com- munication”. Finally, the case study will be completed thru the quantitative sectio n “LDC model simulation and evaluation”. 4.1. LDC Renewable Context The basic framework of the LDC renewable context with a real-world example has been set up in the literature 1. Set ting u pStage 1: LDC renewable context2. T r ansform into basicStage 2: LDC Business Model Stag e 3: Enhanced LDC Business Model 4. De ter mine & carry out evaluation Stage 4: Ev aluation of LDC Business Model 3. Answering research objectives Figure 4. Consecutive research methods and stages. Open Access LCE  Business Model for Local Distribution Companies to Promote Renewable Energy 46 review to be enriched as follows: The LDC can counterbalance the intermittent charac- teristics of renewables and hence DSG through con- nect ion to the lo cal grid. In times of insufficient elec- tricity production from microgrids1, the local grid closes these gaps whereas at times of redundant elec- tricity production this is fed back to the local grid. The local grid connection normally d oes not cause ex- traordinary efforts for the electricity LDC [23,24]. The LDC has no competitive advantage for further increasing the level of renewable large-scale genera- tion, as it has to purchase this type of power from ETCs the same way as for power from central large scale nuclear/fossil fuel or hydro power plants. This is illustrated by Bullfrog Power [25], a green energy producer generating electricity based on renewable large scale installations2. In the electricity distribution business, the LDC is the one and only well-established intermediary between the local grid and its end customers on the one hand and the ETCs and central power plants on the other. Following from the above findings, the LDC could act as a key player to continually shift the distribution of power from the central power plants and ETCs towards the local end customers. Thus, it could gradually increase the local electricity consumption share of DSG and de- crease the share of centrally produced electricity accord- ingly. 4.2. Electricity in Stock This case study focuses on introducing a comparatively small level of DSG via the proposed LDC model. At this initial stage no extensive Electricity Storage Capacity (ESC) systems are required. However, this section will briefly outline the ESC technology so that the proposed LDC model can also be used later on when a higher DSC level will necessitate investments in ESC systems. An Electricity Storage Capacity (ESC) will minimize the gap between momentarily required versus momentarily avai- lable electricity within a microgrid and its small-scale renewable installations. The sum of all local microgrid ESC systems will balance the aggregated demand and supply profiles of the local grid. Two types of ESC systems can be distinguished: Stationary ESC installations are fixed to the corre- sponding renewable installations, e.g. located at a building complex of a renewable project. Thus, a mi- crogrid becomes more independent of the local grid, by building up an d releasing electricity reserv es to the connected end consumers. Mobile ESC installations refer to all types of vehicles with inbuilt capability of storing electricity and pro- viding it to the local grid. The LDC can advance the respective integration of mobile ESC systems via pro- viding local grid/microgrid connection points (e.g. at parking lots or residential or commercial microgrids, bus stops etc.). 4.3. Actors and Transactions Starting point for cons tructing the LDC model is the IBM concept by Wang and Chan [4]. This will provide the basic network of actors and transactions, which deter- mine the LDC stakeholder communication. Furthermore, this basic network reveals the main value sources of the DSG business. The following table summarizes actors and transac- tions, with the LDC as point of reference. An inwards transaction is initiated by a stakeholder and directed at the LDC, whereas an outwards transaction is in itiated by the LDC and directed at a stakeholder. For each customer location type listed in Table 3 above, the corresponding transactions 6, 7 and 8 describe the way of financing the respective renewable installa- tions which are considered most typical (see section 4.4 on financing thru a system of revenue model variants). The basic LDC model depicted in Figure 2 reflects the LDC renewable context in terms of three layers, which are supply-side companies (yellow boxes), local organi- zations (yellow-green boxes) like the LDC, and local customers/citizens (green box). Real-world organisations are denoted in italic font. The LDC possesses clear advantages over supply-side stakeholders to become the key player for advancing DSG, as outlined in Table 4: Furthermore, the local grid controlled by the LDC pre- sents a strong competitive advantag e over all supply-side stakeholders regarding the intermittence of renewable energy and the natural monopoly of an LDC enabled thru its local grid (see Sections 2.2 and 4.1). 4.4. Flexible Revenue Model The importance of a revenue model for a business model in general has been outlined in the literature review. In this section a revenue model will be developed and tai- lored to fit the LDC renewable context. Customers with renewable installations will at times produce redundant electricity and at others consume electricity from the local grid. But selling back electricity is not necessarily perceived to outweigh high renewable installation costs and risks. Even governmental subsidies, like in Ontario provided through RESOP (Renewable Energy Standard Offer Program, [30]), tend to evoke only moderate par- ticipation (see section 4.7). GeoXperts Inc., a venture for 1This text uses the microgrid definition of Kiesling [14] as enabling a “neighbourhood to form a microgrid and exchange among themselves”. 2Bullfrog Power provides electricity via Hydro One as ETC and To- ronto Hydro as LDC. Open Access LCE  Business Model for Local Distribution Companies to Promote Renewable Energy 47 Table 3. Actors and transactions. Actor Inwards transaction Outwards transaction Solar panel producer Wind turbine producer 1a) Install and connect renewable product to the local grid as integrated component of a renewable project managed by the LDC. 1b) Price negotiation between LDC (acting as wholesaler) and producer for specific or bundle of renewable projects. Ownership and payment may be v ariab ly ass igned to L DC an d cus tom ers. Stationary ESC producer 2a) analogous to 1a) 2b) analogous to 1b) Building authority Toronto [26] 3a) Architectural drawings and plans of site enabling LDC to evaluate the corresponding renewable potential. Structural engineering info for estimation of installation costs and construction constraints to assist LDC in decision making/budgeting of renewable projects. Local energy conservation programme Toronto [27] 4a) Pro grams to reduce local energy d emand, e.g. the “Better Buildings Partnerships— Existing Buildings/-New Constructions” (BBPEB/-NC) [27]. 4b) Coordination of 4a) with LDC regarding concurrent installations, e.g. of Solar PV Panels and thermal collectors. Transport Planning Office Toronto [28] 5a) Forecast share of (hybrid-) electric vehicles in public and private transport. 5b) Establish a bidirectional local grid connection point network scaled according to forecast. Private location: e.g. apartment houses, cond omi nium s, single ho use s an d r elat ed e stat es. 6a) Redundant electricity supplied to local grid 6b) LDC owns and maintains major part of renewable installation. Public location: e.g. school buildings, city hall, fire brigade assets etc. 7a) Redundant electricity supplied to local grid for free. 7b) LDC owns and maintains renewable installation. Company location: e.g. production, office, store and shopping mall buildings and associated estates. 8a) Redundant electricity sold back to local grid/LDC. 8b) Company location owners possess and maintain major part of renewable installation. Table 4. Relative advantages of LDC over supply-side stakeholders. Stakeholder Relative advantage of LDC Solar panel producer Wind turbine producer The LDC can independently assess the right combination of renewable products tailored to the specific customer location and can perform necessary security controls like e.g. a static construction analysis for rooftop wind turbines. ESC producer An adequately sized ESC system would further increase the attractiveness of DSG by essentially lowering the LDC’s dependency on electricity purchased from ETCs. However, only the LDC can impartially judge the demand for electricity generation versus storage, related to a customer location. ETCs The LDC needs to purchase electricity from ETCs for prices set by the appropriate regulator (OEB in Ontario). Increasing costs for fossil fuel and nuclear power plants [29] are accompanied by renewables continually becoming less costly. The LDC can impartially and knowledgeably plan the mix of all energy carriers as depicted in Figure 5. Year 1 Year 5 Year 10 Draft ten-year pla n to c onti nuous l y increase distributed smal l-scal e gene ration Figure 5. LDC’s plan to increase renewables’ share. Open Access LCE 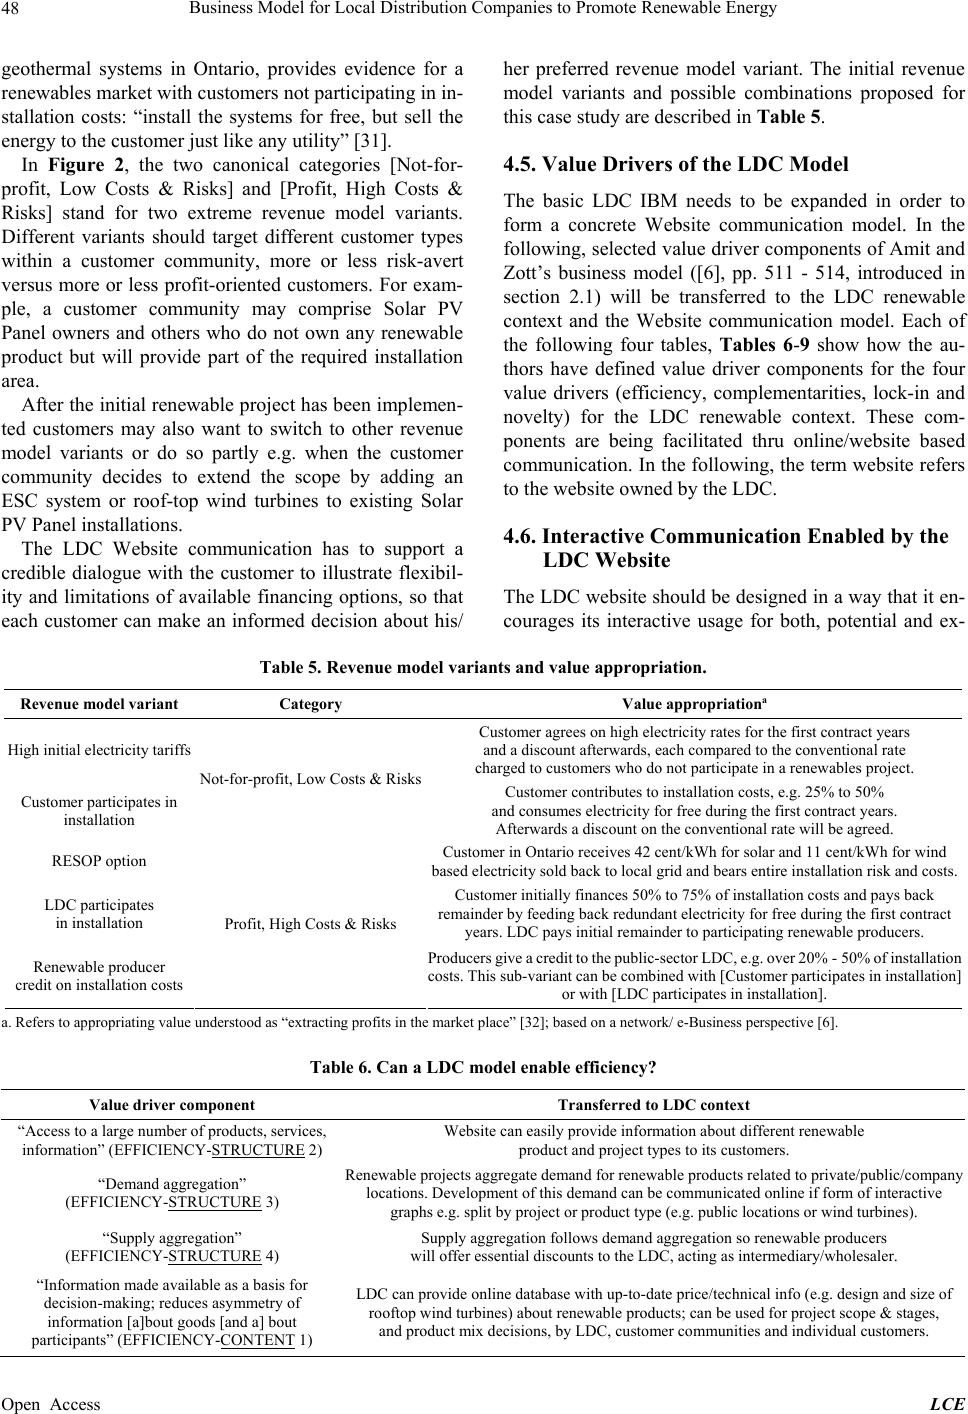 Business Model for Local Distribution Companies to Promote Renewable Energy 48 geothermal systems in Ontario, provides evidence for a renewables market with customers not participating in in- stallation costs: “install the systems for free, but sell the energy to the customer just like any utility” [31]. In Figure 2, the two canonical categories [Not-for- profit, Low Costs & Risks] and [Profit, High Costs & Risks] stand for two extreme revenue model variants. Different variants should target different customer types within a customer community, more or less risk-avert versus more or less profit-oriented customers. For exam- ple, a customer community may comprise Solar PV Panel owners and others who do not own any renewable product but will provide part of the required installation area. After the initial renewable project has been implemen- ted customers may also want to switch to other revenue model variants or do so partly e.g. when the customer community decides to extend the scope by adding an ESC system or roof-top wind turbines to existing Solar PV Panel installations. The LDC Website communication has to support a credible dialogue with the customer to illustrate flexibil- ity and limitations of available financing options, so that each customer can make an informed decision about his/ her preferred revenue model variant. The initial revenue model variants and possible combinations proposed for this case study are described in Table 5. 4.5. Value Drivers of the LDC Model The basic LDC IBM needs to be expanded in order to form a concrete Website communication model. In the following, selected value driver components of Amit and Zott’s business model ([6], pp. 511 - 514, introduced in section 2.1) will be transferred to the LDC renewable context and the Website communication model. Each of the following four tables, Tables 6-9 show how the au- thors have defined value driver components for the four value drivers (efficiency, complementarities, lock-in and novelty) for the LDC renewable context. These com- ponents are being facilitated thru online/website based communication. In the following, the term website refers to the website owned by the LDC. 4.6. Interactive Communication Enabled by the LDC Website The LDC website should be design ed in a way that it en- courages its interactive usage for both, potential and ex- Table 5. Revenue model variants and value appropriation. Revenue model variant Category Value appropriationa High initial electricity tariffs Customer agrees on high electricity rates for the first contract years and a discount afterwards, each compared to the conventional rate charged to customers who do not participate in a renewables project. Customer participates in installation Not-for-profit, Low Costs & RisksCustomer contributes to installation costs, e.g. 25% to 50% and consumes electricity for free during the first contract years. Afterwards a discount on the conventional rate will be agreed. RESOP option Customer in Ontario receives 42 cent/kWh for solar and 11 cent/kWh for wind based electricity sold back to local grid and bears entire installation risk and costs. LDC participates in installation Customer initially finances 50% to 75% of installation costs and pays back remainder by feeding back redundant electricity for free during the first contract years. LDC pays initial remainder to participating renewable producers. Renewable producer credit on installation costs Profit, High Costs & Risks Prod ucer s gi ve a cred it t o th e pu blic -sect or L DC, e.g. over 20% - 50% o f ins talla tion costs. This sub-variant can be combined with [Customer participates in installation] or with [LDC participates in installation]. a. Refers to appropriating value understood as “extracting profits in the market place” [32]; based on a network/ e-Business perspective [6]. Table 6. Can a LDC model enable efficiency? Value driver component Transferred to LDC context “Access to a large number of products, services, information” (EFFICIENCY-STRUCTURE 2) Website can easily provide information about different renewable product and project types to its customers. “Demand aggregation” (EFFICIENCY-STRUCTURE 3) Renewable projects aggregate demand for renewable products related to private/public/company locations. Development of this demand can be communicated online if form of interactive graphs e.g. split by project or product type (e.g. public locations or wind turbines). “Supply aggregation” (EFFICIENCY-STRUCTURE 4) Supply aggregation follows demand aggregation so renewable producers will offer essential discounts to the LDC, acting as intermediary/wholesaler. “Information made available as a basis for decision-making; reduces asymmetry of information [a]bout goods [and a] bout participants” (EFFICIENCY-CONTENT 1) LDC can provide online database with up-to-date price/technical info (e.g. design and size of rooftop wind turbines) about renewable products; can be used for project scope & stages, and product mix decisions, by LDC, customer communities and individual customers. Open Access LCE  Business Model for Local Distribution Companies to Promote Renewable Energy 49 Table 7. How can a LDC model promote complementarities? Value driver component Transferred to LDC context “Cross-selling” (COMPLEMENTARIES—STRUCTURE 1) Website might encourage customer communities to purchase thermal collectors, insulation improvement products, (hybrid-) electric vehicles or ESC systems. “Combination of on-line and off-line transactions” (COMPLEMENTARIES— STRUCTURE 2) Customers’ interest in LDC model, initiated by website, may be complemented later in the sales process by customer community meetings with renewable producer and LDC representatives. “Access to complementary products, services, and information [f] rom firms [,…] partner firms [and f] rom customers” (COMPLEMENTARIES—CONTENT 1) Online database (see EFFICIENCY—CONTENT 1) encompasses complementary products (see COMPLEMENTARIES—STRUCTURE1) The LDC could also connect other stakeholders which are n o t d i rect l y i n volve d i n the LDC mode l . Fo r i n stan c e , on t h e w e b s i te i t c o u l d adve rtis e f ood d e l i very serv ic es p r ov id ed b y l o ca l su pe rm a rke ts (t o a vo id /r e d uc e t r an sp o rt e n er gy ). Or i t c ou l d p romote t he id e a of tele-commuting listing those local companies which have or want to increase the level of tele-commuting (to avoid/reduce energy spent on mobility). “Incentives to develop co-specialized resources” (COMPLEMENTARIES— GOVERNANCE 1) LDC acts as wholesaler of co-specialised resources like an ESC system offering standardised maintenance and insurance contracts, thereby building up the required customer confidence. Website can simulate LDC’s third party offerings and purpose of co-specialised resources. “Alliance capabilities of partners” (COMPLEMENTARIES— GOVERNANCE 2) Alliances of rooftop wind turbine, Solar PV Panel and complementarities producers all shaped by LDC for conjoint, efficient management and realisation of ren ew ab le p roj ec ts . Website will restrict access to team members only, for instance of a condominium renewable project. Table 8. Does a LDC model increase lock-in? Value driver component Transferred to LDC context “Direct network externalities” (LOCK-IN—STRUCTURE 1) High number of customers participating in renewable project will decrease installation costs per customer, e.g. for shared ESC system or wind turbine installations. Website demonstrates these effects and thus the attractiveness of renewable projects. “Indirect network externalities” (LOCK-IN—STRUCTURE 2) High demand for renewable products promotes economies of scale, thereby lowering renewable product prices. Website publishes microgrid electricity supply and demand capacity profile data. This provides valuable information for existing and prospective customer communities, including “lessons learned” effects, which increases likelihood of follow-up renewable projects or enhancement stages. “Promotion of trust through third party” (LOCK-IN—CONTENT 1) Website provides unbiased, producer independent information focusing on the right. product mix for a given customer location. “Customized and/or personalized offerings and features” (LOCK-IN—CONTENT 2) Website enables customized offering dependent on customer location & community and individual preference for revenue model variants. “Customers control use of personal information” (LOCK-IN—GOVERNANCE 1) Online access to information, e.g. distribution of revenue model variants, restricted to corresponding customer community and online access to personal data (e.g. chosen revenue variant and investment sum) only to the respective individual. “Importance of community concept” (LOCK-IN - GOV ERNANCE 2) LDC fac ilit ates on line com mu nic atio n of cu stom er comm uni ty rega rdi ng issue s l ike ren ewab le p rod uc mix, installation time plan or successive enhancement stages, thus preparing in-person meetings. Table 9. LDC model and novelty? Value driver component Transferred to LDC context “New participants” (NOVELTY—STRUCTURE 1) Website informs about flexible model of financing alternatives, about advantages related to the customer community concept (compare LOCK-IN—STRUCTURE 1 and LOCK-IN— GOVERNANCE 2), thereby attracting new participants. “New links between participants” (NOVELTY—STRUCTURE 2) Website facilitates strong connections within a customer community, with the LDC and furthermore, project based alliances (controlled by LDC) of renewable producers (see COMPLEMENTARIES—GOVERNANCE2). “New (combinations of) products, services, information” (NOVELTY—CONTENT 1) Novel tailoring of renewable projects and product mix according to customer community and LDC needs, simulated through Website. isting renewable project customers. Interests may look at existing renewable projects and compare it to their own situation. At an early stage, the LDC Website should allow simulating effectively dif- ferent revenue model variants or renewable product mixes. Customers of existing renewable projects may re- trieve current project status information or an as-is costs and benefits analysis. Existing online metering functions can be enhanced to let a customer community monitor their aggregated renewables’ electricity supply and de- mand capacity profile. A customer community meeting and in-person discus- Open Access LCE 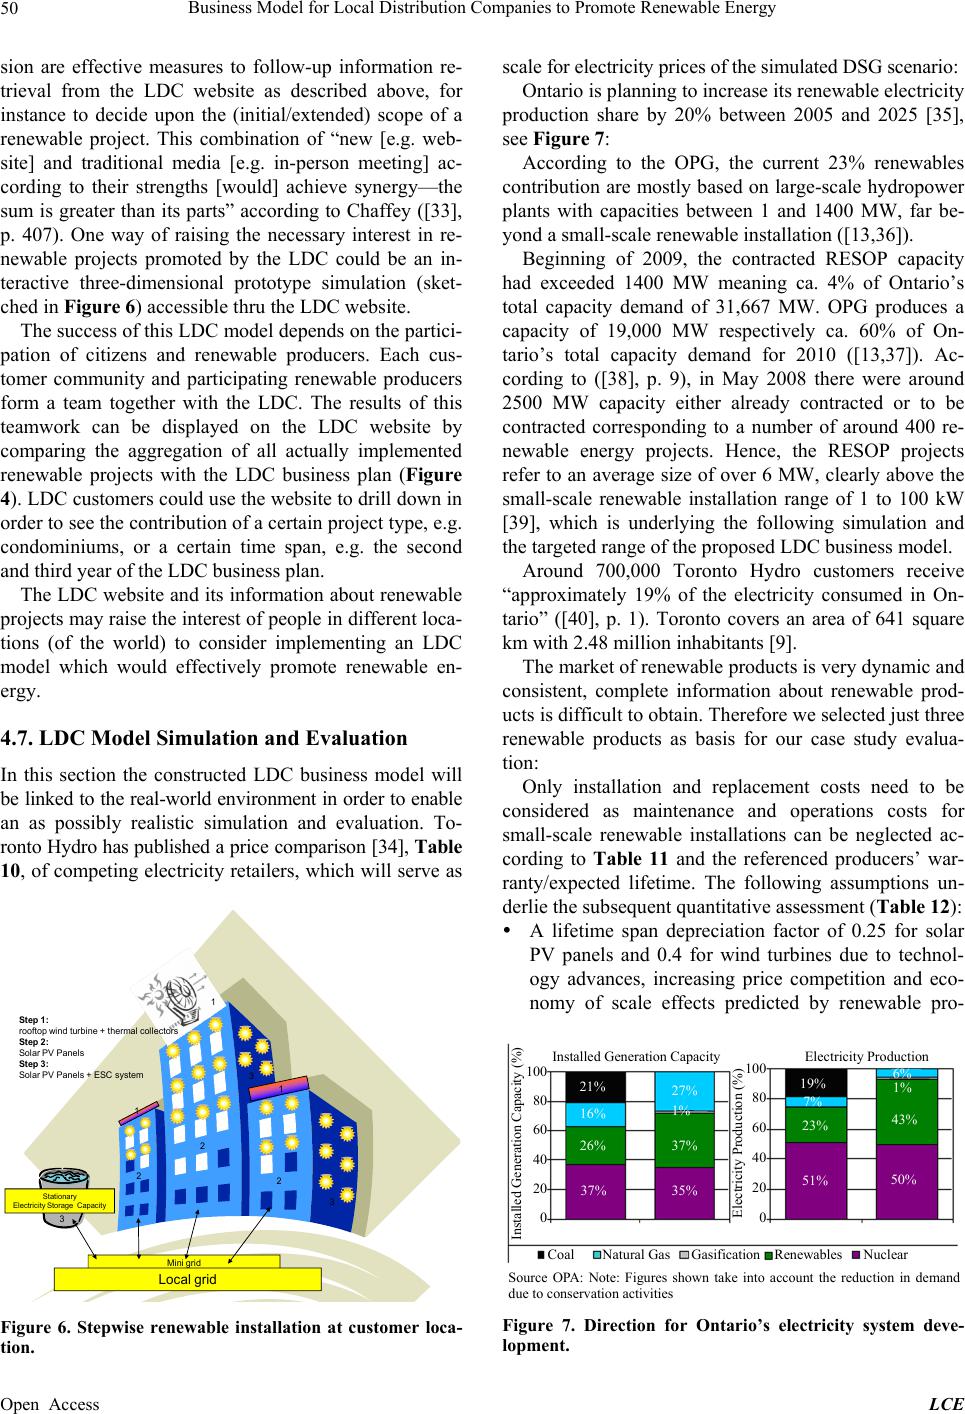 Business Model for Local Distribution Companies to Promote Renewable Energy 50 sion are effective measures to follow-up information re- trieval from the LDC website as described above, for instance to decide upon the (initial/extended) scope of a renewable project. This combination of “new [e.g. web- site] and traditional media [e.g. in-person meeting] ac- cording to their strengths [would] achieve synergy—the sum is greater than its parts” according to Chaffey ([33], p. 407). One way of raising the necessary interest in re- newable projects promoted by the LDC could be an in- teractive three-dimensional prototype simulation (sket- ched in Figure 6) accessible thru the LDC website. The success of this LDC model depends on the partici- pation of citizens and renewable producers. Each cus- tomer community and participating renewable producers form a team together with the LDC. The results of this teamwork can be displayed on the LDC website by comparing the aggregation of all actually implemented renewable projects with the LDC business plan (Figure 4). LDC customers could use the website to drill down in order to see the contribution of a certain project type, e.g. condominiums, or a certain time span, e.g. the second and third year of the LDC business plan. The LDC website and its information about renewable projects may raise the interest of people in different loca- tions (of the world) to consider implementing an LDC model which would effectively promote renewable en- ergy. 4.7. LDC Model Simulation and Evaluation In this section the constructed LDC business model will be linked to the real-world environment in order to enable an as possibly realistic simulation and evaluation. To- ronto Hydro has published a price comparison [34], Table 10, of competing electricity retailers, which will serve as Mini grid Local g rid Stationary Electricity Storage Capacity 1 1 1 2 3 2 2 3 3 Step 1: rooft op win d turbine + therm al colle cto rs Step 2: Solar PV Panels Step 3: Solar PV Panels + ESC system Figure 6. Stepwise renewable installation at customer loca- tion. scale for electricity prices of the simulated DSG scenario: Ontario is planning to increase its renewable electricity production share by 20% between 2005 and 2025 [35], see Figure 7: According to the OPG, the current 23% renewables contribution are mostly based on large-scale hydropower plants with capacities between 1 and 1400 MW, far be- yond a small-scale renewable installation ([13,36]). Beginning of 2009, the contracted RESOP capacity had exceeded 1400 MW meaning ca. 4% of Ontario’s total capacity demand of 31,667 MW. OPG produces a capacity of 19,000 MW respectively ca. 60% of On- tario’s total capacity demand for 2010 ([13,37]). Ac- cording to ([38], p. 9), in May 2008 there were around 2500 MW capacity either already contracted or to be contracted corresponding to a number of around 400 re- newable energy projects. Hence, the RESOP projects refer to an average size of over 6 MW, clearly above the small-scale renewable installation range of 1 to 100 kW [39], which is underlying the following simulation and the targeted range of the proposed LDC business model. Around 700,000 Toronto Hydro customers receive “approximately 19% of the electricity consumed in On- tario” ([40], p. 1). Toronto covers an area of 641 square km with 2.48 million inhabitants [9]. The market of renewable products is very dynamic and consistent, complete information about renewable prod- ucts is difficult to obtain. Therefore we selected ju st three renewable products as basis for our case study evalua- tion: Only installation and replacement costs need to be considered as maintenance and operations costs for small-scale renewable installations can be neglected ac- cording to Table 11 and the referenced producers’ war- ranty/expected lifetime. The following assumptions un- derlie the subsequent qu antitative assessment (Table 12): A lifetime span depreciation factor of 0.25 for solar PV panels and 0.4 for wind turbines due to technol- ogy advances, increasing price competition and eco- nomy of scale effects predicted by renewable pro- 100 80 60 40 20 0 Installed Generation Capacity (%) Electricity Pr oduc tion (%) 100 80 60 40 20 0 Coal Natural Gas Gasification Renewables Nuclear Source OPA: Note: Figures shown take into account the reduction in demand due to conservation activities Installed Generation Capacity Electricity Production 21% 27% 19% 6% 1% 43% 50% 7% 23% 51% 1% 37% 35%37% 26% 16% Figure 7. Direction for Ontario’s electricity system deve- opment. l Open Access LCE 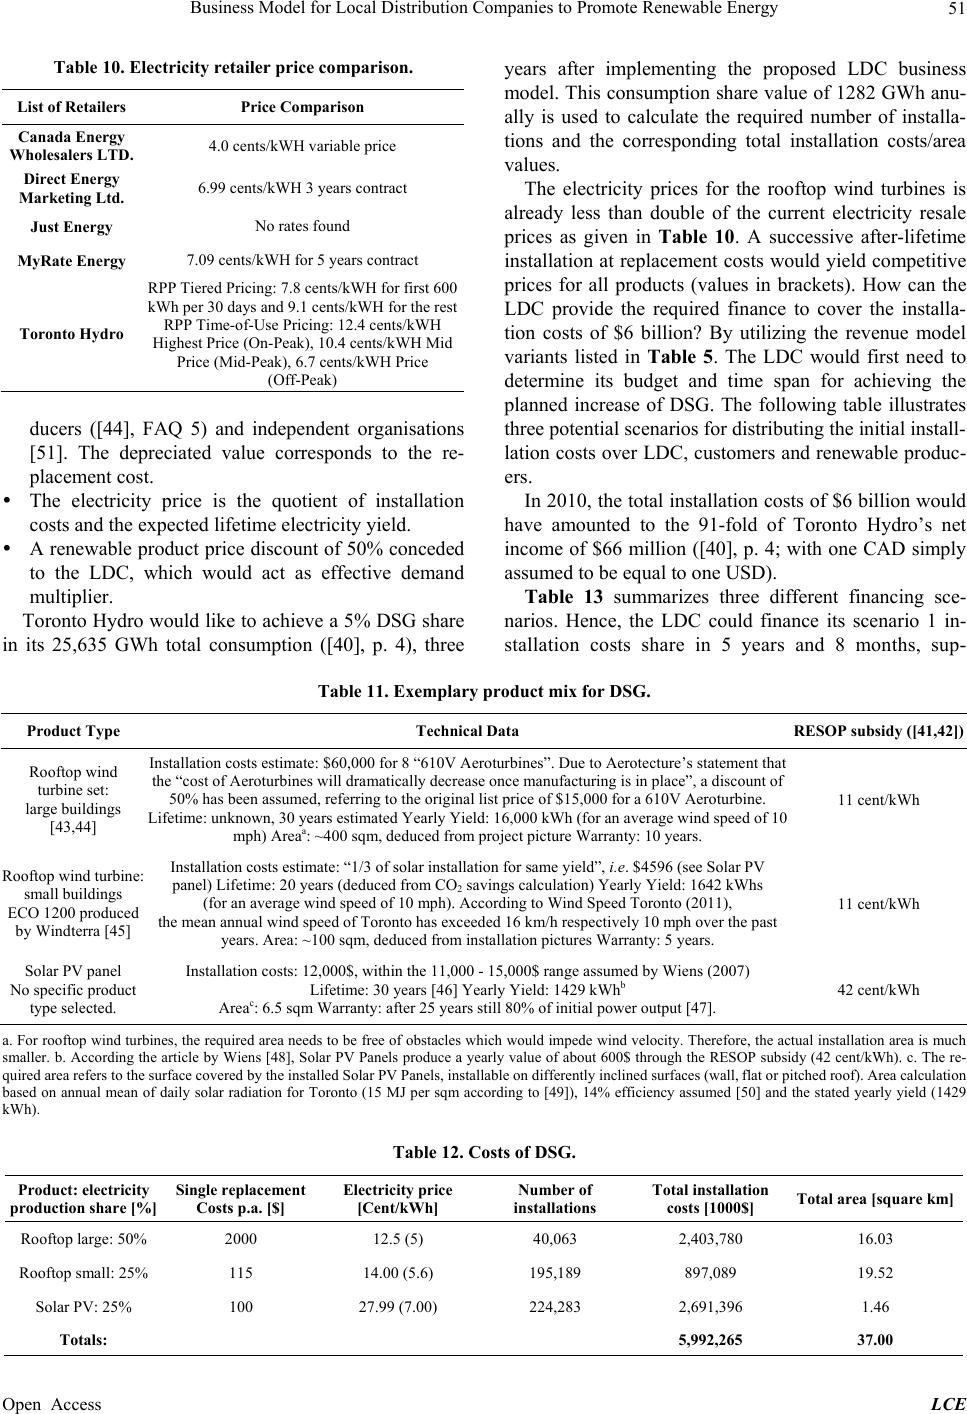 Business Model for Local Distribution Companies to Promote Renewable Energy Open Access LCE 51 Table 10. Electricity retailer price comparison. List of Retailers Price Comparison Canada Energy Wholesalers LTD. 4.0 cents/kWH variable price Direct Energy Marketing Ltd. 6.99 cents/kWH 3 years contract Just Energy No rates found MyRate Energy 7.09 cents/kWH for 5 years contract Toronto Hydro RPP Tiered Pricing: 7.8 cents/kWH for first 600 kWh per 30 days and 9.1 cents/kWH for the rest RPP Time-of-Use Pricing: 12.4 cents/kWH Highest Price (On-Peak), 10.4 cents/kWH Mid Price (Mid-Peak), 6.7 cents/kWH Price (Off-Peak) ducers ([44], FAQ 5) and independent organisations [51]. The depreciated value corresponds to the re- placement cost. The electricity price is the quotient of installation costs and the expected lifetime electricity yield. A renewable product price discount of 50% conceded to the LDC, which would act as effective demand multiplier. Toronto Hydro would like to achieve a 5% DSG share in its 25,635 GWh total consumption ([40], p. 4), three years after implementing the proposed LDC business model. This consumption share value of 1282 GWh anu- ally is used to calculate the required number of installa- tions and the corresponding total installation costs/area values. The electricity prices for the rooftop wind turbines is already less than double of the current electricity resale prices as given in Table 10. A successive after-lifetime installation at replacement costs would yield competitive prices for all products (values in brackets). How can the LDC provide the required finance to cover the installa- tion costs of $6 billion? By utilizing the revenue model variants listed in Table 5. The LDC would first need to determine its budget and time span for achieving the planned increase of DSG. The following table illustrates three potential scenarios for distributing th e initial in stall- lation costs over LDC, customers and renewable produc- ers. In 2010, the total installation costs of $6 billion would have amounted to the 91-fold of Toronto Hydro’s net income of $66 million ([40], p. 4; with one CAD simply assumed to be equal to one USD). Table 13 summarizes three different financing sce- narios. Hence, the LDC could finance its scenario 1 in- stallation costs share in 5 years and 8 months, sup- Table 11. Exemplary product mix for DSG. Product Type Technical Data RESOP subsidy ([41,42]) Rooftop wind turbine set: large buildings [43,44] Installation costs estimate: $60,000 for 8 “610V Aeroturbines”. Due to Aerotecture’s statement that the “cost of Aeroturbines will dramatically decrease once manufacturing is in place”, a discount of 50% has been assumed, referring to the original list price of $15,000 for a 610V Aeroturbine. Lifetime: unknown, 30 years estimated Yearly Yield: 16,000 kWh (for an average wind speed of 10 mph) Areaa: ~400 sqm, deduced from project picture Warranty: 10 years. 11 cent/kWh Rooftop wind turbine: small buildings ECO 1200 produced by Windterra [45] Installation costs estimate: “1/3 of solar installation for same yield”, i.e. $4596 (see Solar PV panel) Lifetime: 20 years (deduced from CO2 savings calculation) Yearly Yield: 1642 kWhs (for an average wind speed of 10 mph). According to Wind Speed Toronto (2011), the mean annual wind speed of Toronto has exceeded 16 km/h respectively 10 mph over the past years. Area: ~100 sqm, deduced from installation pictures Warranty: 5 years. 11 cent/kWh Solar PV panel No specific product type selected. Installation costs: 12,000$, within the 11,000 - 15,000$ range assumed by Wiens (2007) Lifetime: 30 years [46] Yearly Yield: 1429 kWhb Areac: 6.5 sqm Warranty: after 25 years still 80% of initial power output [47]. 42 cent/kWh a. For rooftop wind turbines, the required area needs to be free of obstacles which would impede wind velocity. Therefore, the actual installation area is much smaller. b. According the article by Wiens [48], Solar PV Panels produce a yearly value of about 600$ through the RESOP subsidy (42 cent/kWh). c. The re- quired area refers to the surface covered by the installed Solar PV Panels, installable on differently inclined surfaces (wall, flat or pitched roof). Area calculation based on annual mean of daily solar radiation for Toronto (15 MJ per sqm according to [49]), 14% efficiency assumed [50] and the stated ye arly yield (1429 kWh). Table 12. Costs of DSG. Product: electricity production share [%] Single replacement Costs p.a. [$] Electricity price [Cent/kWh] Number of installations Total installation costs [1000$] Total area [square km] Rooftop large: 50% 2000 12.5 (5) 40,063 2,403,780 16.03 Rooftop small: 25% 115 14.00 (5.6) 195,189 897,089 19.52 Solar PV: 25% 100 27.99 (7.00) 224,283 2,691,396 1.46 Totals: 5,992,265 37.00 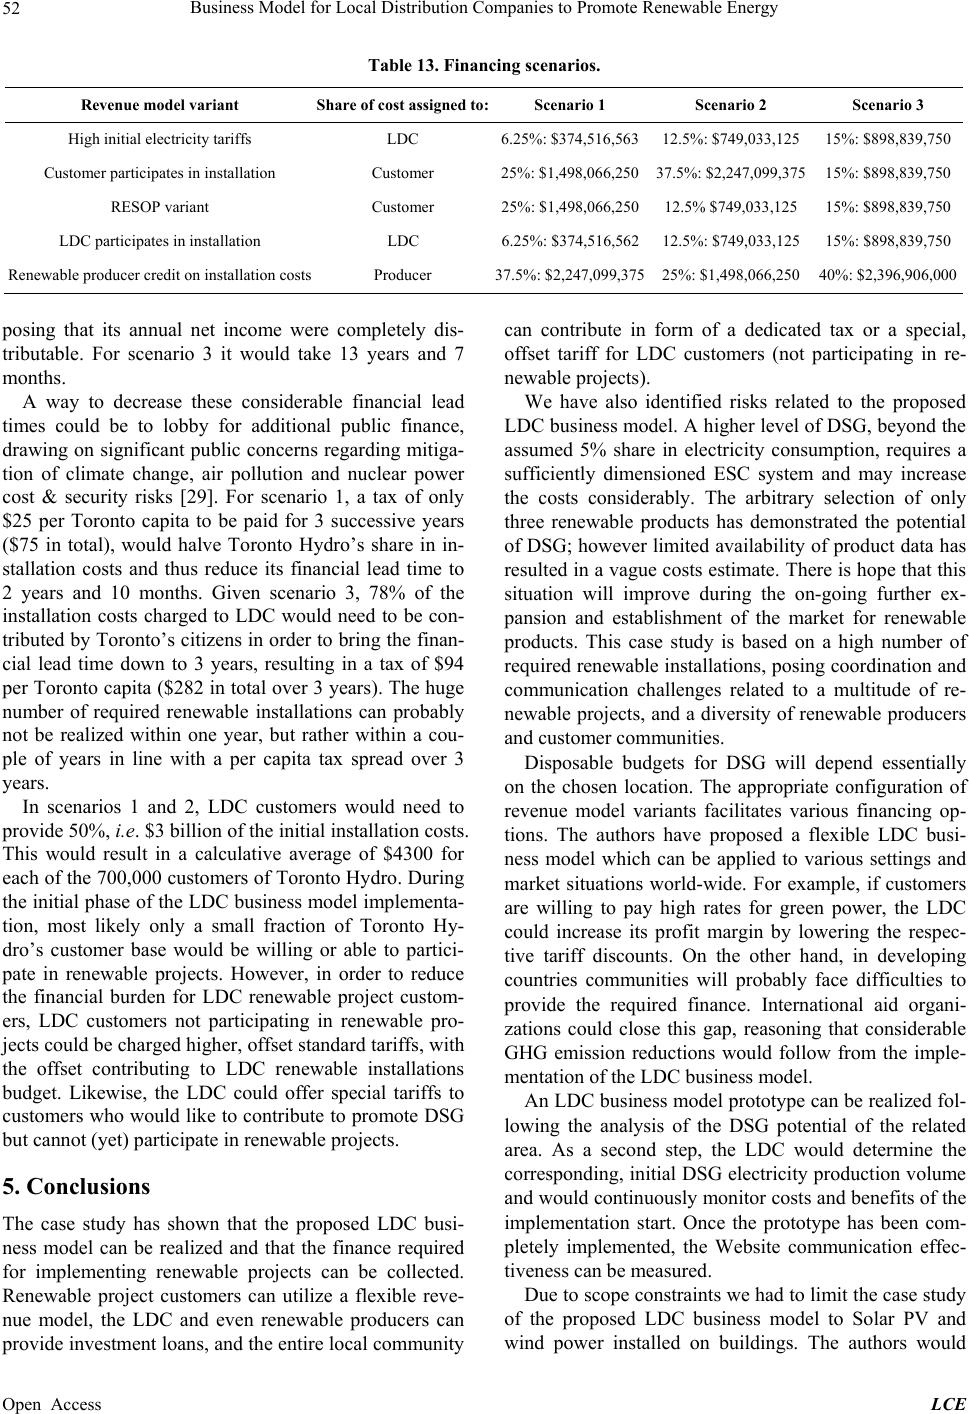 Business Model for Local Distribution Companies to Promote Renewable Energy 52 Table 13. Financing scenarios. Revenue model variant Share of cost assigned to:Scenario 1 Scenario 2 Scenario 3 High initial electricity tariffs LDC 6.25%: $374,516,56312.5%: $749,033,125 15%: $898,839,750 Customer participates in installation Customer 25%: $1,498,066,25037.5%: $2,247,099,375 15%: $898,839,750 RESOP variant Customer 25%: $1,498,066,25012.5% $749,033,125 15%: $898,839,750 LDC participates in installation LDC 6.25%: $374,516,56212.5%: $749,033,125 15%: $898,839,750 Renewable producer credit on installation costs Producer 37.5%: $2,247,099,37525%: $1,498,066,250 40%: $2,396,906,000 posing that its annual net income were completely dis- tributable. For scenario 3 it would take 13 years and 7 months. A way to decrease these considerable financial lead times could be to lobby for additional public finance, drawing on significant public concerns regarding mitiga- tion of climate change, air pollution and nuclear power cost & security risks [29]. For scenario 1, a tax of only $25 per Toronto capita to be paid for 3 successive years ($75 in total), would halve Toronto Hydro’s share in in- stallation costs and thus reduce its financial lead time to 2 years and 10 months. Given scenario 3, 78% of the installation costs charged to LDC would need to be con- tributed by Toronto’s citizens in order to bring the finan- cial lead time down to 3 years, resulting in a tax of $94 per Toronto capita ($282 in total over 3 years). The huge number of required renewable installations can probably not be realized within one year, but rather within a cou- ple of years in line with a per capita tax spread over 3 years. In scenarios 1 and 2, LDC customers would need to provide 50%, i.e. $3 billion of the in itial installation costs. This would result in a calculative average of $4300 for each of the 700,000 customers of Toronto Hydro. During the initial phase of the LDC business model implementa- tion, most likely only a small fraction of Toronto Hy- dro’s customer base would be willing or able to partici- pate in renewable projects. However, in order to reduce the financial burden for LDC renewable project custom- ers, LDC customers not participating in renewable pro- jects could be charged higher, offset standard tariffs, with the offset contributing to LDC renewable installations budget. Likewise, the LDC could offer special tariffs to customers who would like to contribute to promote DSG but cannot (yet) participate in renewable projects. 5. Conclusions The case study has shown that the proposed LDC busi- ness model can be realized and that the finance required for implementing renewable projects can be collected. Renewable project customers can utilize a flexible reve- nue model, the LDC and even renewable producers can provide investment loan s, and the en tire local co mmunity can contribute in form of a dedicated tax or a special, offset tariff for LDC customers (not participating in re- newable projects). We have also identified risks related to the proposed LDC business model. A higher level of DSG, beyond the assumed 5% share in electricity consumption, requires a sufficiently dimensioned ESC system and may increase the costs considerably. The arbitrary selection of only three renewable products has demonstrated the potential of DSG; however limited availability of product data has resulted in a vague costs estimate. There is hope that this situation will improve during the on-going further ex- pansion and establishment of the market for renewable products. This case study is based on a high number of required renewable installations, posing coordination and communication challenges related to a multitude of re- newable projects, and a diversity of renewable producers and customer communities. Disposable budgets for DSG will depend essentially on the chosen location. The appropriate configuration of revenue model variants facilitates various financing op- tions. The authors have proposed a flexible LDC busi- ness model which can be applied to various settings and market situations world-wide. For example, if customers are willing to pay high rates for green power, the LDC could increase its profit margin by lowering the respec- tive tariff discounts. On the other hand, in developing countries communities will probably face difficulties to provide the required finance. International aid organi- zations could close this gap, reasoning that considerable GHG emission reductions would follow from the imple- mentation of the LDC business model. An LDC business model prototype can be realized fol- lowing the analysis of the DSG potential of the related area. As a second step, the LDC would determine the corresponding, initial D SG electricity production volume and would continuously monitor costs and benefits of the implementation start. Once the prototype has been com- pletely implemented, the Website communication effec- tiveness can be measured. Due to scope constraints we had to limit the case study of the proposed LDC business model to Solar PV and wind power installed on buildings. The authors would Open Access LCE  Business Model for Local Distribution Companies to Promote Renewable Energy 53 like to exemplify with only two (of many thinkable) al- ternative ways to empower the LDC business model. In example one, LDCs could promote small-scale CHP plants, associated with a convenient cost structure and suitable for residential, public or commercial buildings. In example two, a North American LDC like Toronto Hydro could target shopping malls, typically found in suburban areas and associated with large areas of build- ing structures and parking lots. Solar Panels installed on parking lots and roof areas could provide electricity to the shopping mall itself and to end-customers with (hy- brid-) electric vehicles. Besides, solar PV panels’ shadow would reduce the heating up of customer cars considera- bly. The authors recommend future, applied research by realizing LDC business model prototypes. Thus its strengths and weaknesses can be evaluated and methods can be developed to mitigate o r avoid the risks and chal- lenges identified in our research. REFERENCES [1] International Energy Agency, “World Energy Outlook 2010,” 2010. http://www.worldenergyoutlook.org/media/weo2010.pdf [2] J. De Jode, J. C., Jansen, A. J. van der Welle and M. J. J. Scheepers, “Increasing Penetration of Renewable and Distributed Electricity Generation and the Need for Dif- ferent Network Regulation,” Energy Policy, Vol. 37, No. 8, 2009, pp. 2907-2915. http://dx.doi.org/10.1016/j.enpol.2009.03.014 [3] M. Loock, “Going beyond Best Technology and Lowest Price: On Renewable Energy Investors’ Preference for Service-Driven Business Models, ” Energy Policy, Vol. 40, 2010, pp. 21-27. http://dx.doi.org/10.1016/j.enpol.2010.06.059 [4] C. Wang and K. Chan, “Analyzing the Taxonomy of Internet Business Models Using Graphs,” First Monday, Vol. 8, No. 6, 2003. http://dx.doi.org/10.5210/fm.v8i6.1058 [5] A. Osterwalder, Y. Pigneur and C. L. Tucci, “Clarifying Business Models: Origins, Present, and Future of the Concept,” Communications of the Association for Infor- mation Systems, Vol. 16, 2005. http://citeseerx.ist.psu.edu/viewdoc/download?doi=10.1.1 .83.7452&rep=rep1&type=pdf [6] R. Amit and C. Zott, “Value Creation in E-Business,” Strategic Management Journal, Vol. 22, No. 6-7, 2001, pp. 493-520. http://dx.doi.org/10.1002/smj.187 [7] W. H. DeLone and E. R. McLean, “Measuring E-Com- merce Success: Applying the DeLone & McLean Infor- mation Systems Succe ss Model,” International Journal of Electronic Commerc e, Vol. 9, No. 1, pp. 31-47. http://www.jstor.org/pss/27751130 [8] Toronto Hydro, “History,” 2013. http://www.torontohydro.com/sites/corporate/AboutUs/Pa ges/History.aspx [9] Toronto, “Toront o: Highest-Best-L ongest-Greenest-Get the Facts,” 2013. http://www.toronto.ca/toronto_facts/index.htm [10] Hydro One, 2013. http://www.hydroone.com [11] Ontario Power Authority, 2013. http://www.powerauthority.on.ca/ [12] Ontario Energy Board, 2013. http://www.ontarioenergyboard.ca/OEB [13] Ontario Power Generation, “Power Generation,” 2013. http://www.opg.com/power/ [14] Wikipedia, “World Electricity Production by Source,” 2013. http://en.wikipedia.org/wiki/File:Annual_electricity_net_ generation_in_the_world.svg [15] Wikipedia, “Intermittent Power Source,” 2013. en.wikipedia.org/wiki/Intermittent_Power_Sources [16] Wikipedia, “Wind Power,” 2013. http://en.wikipedia.org/wiki/Wind_power [17] OEB LDC Coalition Report, “LDC Coalition Responses to Wirebury and VECC Interrogatories,” Ontario Energy Board, RP-2003-0044, 2003. http://www.oeb.gov.on.ca/documents/cases/RP-2003-004 4/September%2026-03_submissions/LDC%20Coalition/I RS.pdf [18] Toronto Hydro, “Electric Distribution System Back- ground,” 2013. http://www.torontohydro.com/sites/electricsystem/power up/background/Pages/Background.aspx [19] Wikipedia, “Electricity Retailing: Creating a Market,” 2013. http://en.wikipedia.org/wiki/Electricity_retailing [20] E. W. Humphrys and P.-C. Lee, “Electric Utilities: Trend towards Provincial Ownership,” The Canadian Encyclo- pedia, 2012. http://www.thecanadianencyclopedia.com/index.cfm?Pg Nm=TCE&Params=A1SEC819912 [21] D. Genske, L. Porsche and A. Ruff, “The Urban Solar Potential (Das urbansolare Potenzial),” Solar Age: Poli- tics, Culture and Economy of Renewables (Solarzeitalter: Politik, Kultur und Ökonomie Erneuerbarer Energien), No. 1, 2008, pp. 57-59. [22] EWE, “10 Bullensee Theses and Derived Strategy Rec- ommendations Regarding Future Energy Supply (10 Bul- lensee-Thesen und Abgeleitete Handlungsempfehlungen zur Zukünftigen Energieversorgung),” 2007. http://www.ewe.com/konzern/nachhaltigkeit.php [23] Toronto Hydro, “Generate Renewable Energy and Money,” 2013. http://www.torontohydro.c om/sites/electricsystem/electric ityconserva- tion/feedintariff/Pages/FeedInTariffProgram.aspx [24] L. L. Kiesling, “Promoting Innovation in the Electricity Industry,” Economic affairs, Vol. 30, No. 2, 2010, pp. 6- 12. http://dx.doi.org/10.1111/j.1468-0270.2010.02000.x [25] Bullfrog Power, “Bullfrog Power,” 2013. http://www.bullfrog.com/ [26] Toronto, “Toronto: Living in Toronto: Toronto Building,” 2013. http://www.toronto.ca/building/index.htm Open Access LCE 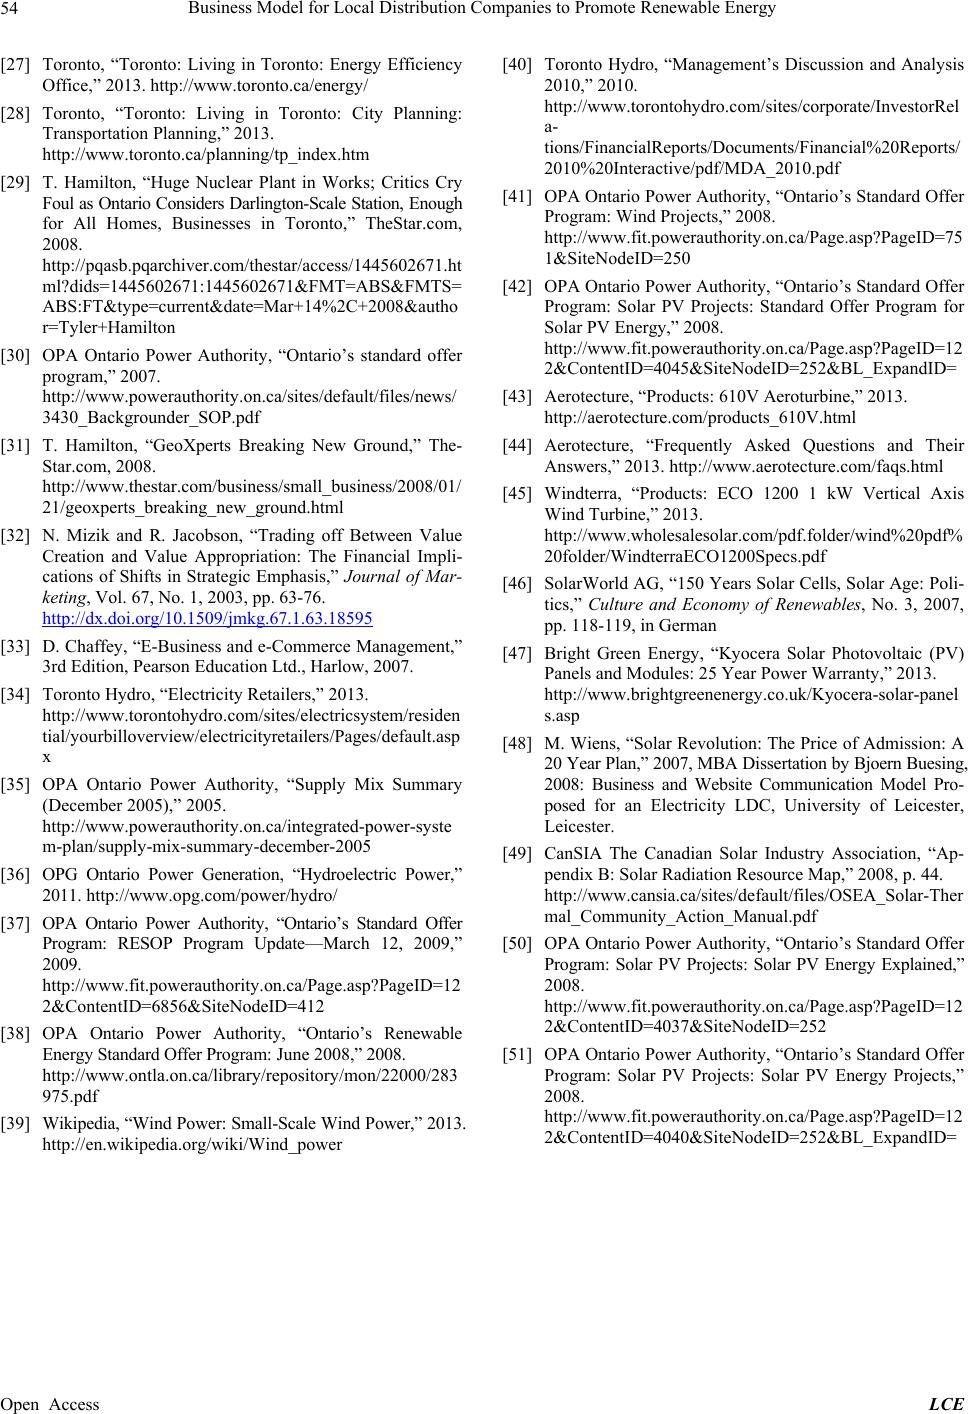 Business Model for Local Distribution Companies to Promote Renewable Energy Open Access LCE 54 [27] Toronto, “Toronto: Living in Toronto: Energy Efficiency Office,” 2013. http://www.toronto.ca/energy/ [28] Toronto, “Toronto: Living in Toronto: City Planning: Transportation Planning,” 2013. http://www.toronto.ca/planning/tp_index.htm [29] T. Hamilton, “Huge Nuclear Plant in Works; Critics Cry Foul as Ontario Considers Darlington-Scale Station, Enough for All Homes, Businesses in Toronto,” TheStar.com, 2008. http://pqasb.pqarchiver.com/thestar/access/1445602671.ht ml?dids=1445602671:1445602671&FMT=ABS&FMTS= ABS:FT&type=current&date=Mar+14%2C+2008&autho r=Tyler+Hamilton [30] OPA Ontario Power Authority, “Ontario’s standard offer program,” 2007. http://www.powerauthority.on.ca/sites/default/files/news/ 3430_Backgrounder_SOP.pdf [31] T. Hamilton, “GeoXperts Breaking New Ground,” The- Star.com, 2008. http://www.thestar.com/business/small_business/2008/01/ 21/geoxperts_breaking_new_ground.html [32] N. Mizik and R. Jacobson, “Trading off Between Value Creation and Value Appropriation: The Financial Impli- cations of Shifts in Strategic Emphasis,” Journal of Mar- keting, Vol. 67, No. 1, 2003, pp. 63-76. http://dx.doi.org/10.1509/jmkg.67.1.63.18595 [33] D. Chaffey , “E-Busin ess and e-Commerce Management,” 3rd Edition, Pearson Education Ltd., Harlow, 2007. [34] Toronto Hydro, “Electricity Retailers,” 2013. http://www.torontohydro.c om/sites/electricsystem/residen tial/yourbilloverview/electricityretailers/Pages/default.asp x [35] OPA Ontario Power Authority, “Supply Mix Summary (December 2005),” 2005. http://www.powerauthority.on.ca/integrated-power-syste m-plan/supply-mix-summary-december-2005 [36] OPG Ontario Power Generation, “Hydroelectric Power,” 2011. ht tp://www.opg.com/power/hydro/ [37] OPA Ontario Power Authority, “Ontario’s Standard Offer Program: RESOP Program Update—March 12, 2009,” 2009. http://www.fit.powerauthority.on.ca/Page.asp?PageID=12 2&ContentID=6856&SiteNodeID=412 [38] OPA Ontario Power Authority, “Ontario’s Renewable Energy Standard Offer Progr am: June 2008,” 2008. http://www.ontla.on.ca/library/repository/mon/22000/283 975.pdf [39] Wikipedia, “Wind Po wer: Small-Scale Wind Power,” 2013. http://en.wikipedia.org/wiki/Wind_power [40] Toronto Hydro, “Management’s Discussion and Analysis 2010,” 2010. http://www.torontohydro.com/sites/corporate/InvestorRel a- tions/FinancialReports/Documents/Financial%20Reports/ 2010%20Interactive/pdf/MDA_2010.pdf [41] OPA Ontario Power Authority, “Ontario’s Standard Offer Program: Wind Projects,” 2008. http://www.fit.powerauthority.on.ca/Page.asp?PageID=75 1&SiteNodeID=250 [42] OPA Ontario Power Authority, “Ontario’s Standard Offer Program: Solar PV Projects: Standard Offer Program for Solar PV Energy,” 2008. http://www.fit.powerauthority.on.ca/Page.asp?PageID=12 2&ContentID=4045&SiteNodeID=252&BL_ExpandID= [43] Aerotecture, “Products: 610V Aeroturbine,” 2013. http://aerotecture.com/products_610V.html [44] Aerotecture, “Frequently Asked Questions and Their Answers,” 2013. http://www.aerotecture.com/faqs.html [45] Windterra, “Products: ECO 1200 1 kW Vertical Axis Wind Turbine,” 2013. http://www.wholesalesolar.com/pdf.folder/wind%20pdf% 20folder/WindterraECO1200Specs.pdf [46] SolarWorld AG, “150 Years Solar Cells, Solar Age: Poli- tics,” Culture and Economy of Renewables, No. 3, 2007, pp. 118-119, in German [47] Bright Green Energy, “Kyocera Solar Photovoltaic (PV) Panels and Modules: 25 Year Power Warranty,” 2013. http://www.brightgreenenergy.co.uk/Kyocera-solar-panel s.asp [48] M. Wiens, “Solar Revolution: The Price of Admission: A 20 Year Plan,” 2007, MBA Di ssertation by Bjoern Buesing, 2008: Business and Website Communication Model Pro- posed for an Electricity LDC, University of Leicester, Leicester. [49] CanSIA The Canadian Solar Industry Association, “Ap- pendix B: Solar Radiation Resource Map,” 2008, p. 44. http://www.cansia.ca/sites/default/files/OSEA_Solar-Ther mal_Community_Action_Manual.pdf [50] OPA Ontario Power Authority, “Ontario’s Standard Offer Program: Solar PV Projects: Solar PV Energy Explained,” 2008. http://www.fit.powerauthority.on.ca/Page.asp?PageID=12 2&ContentID=4037&SiteNodeID=252 [51] OPA Ontario Power Authority, “Ontario’s Standard Offer Program: Solar PV Projects: Solar PV Energy Projects,” 2008. http://www.fit.powerauthority.on.ca/Page.asp?PageID=12 2&ContentID=4040&SiteNodeID=252&BL_ExpandID=
|