B. JIA ET AL.
Open Access JAMP
the entire natural circulation and heat transfer process. So
water density varied with temperature udf relation [8] is
introduced into material properties table in FLUENT
program. Since the density of water reaches the maxi-
mum at 3.98˚C atmospheric pressure, density and tem-
perature parabolic relation are selected:
(7)
In the formula: ρ0 is the maximum value of water den-
sity, T0 is the water temperature at the same time, γ is the
thermal expansion coefficient. Although PRHR HX de-
sign pressur e is 16.9 Mpa, design temperature is 297.2˚C,
and the IRWST runs at atmospheric pressure, the design
temperature is 48.9˚C. However after verification, it’s
found that thermal expansion coefficients at two condi-
tions are very close, with little effect on the calculation,
the final γ is selected as 3.1e−6.
3. Simulation Results
3.1. Effect of Different C-T ype Heat Transfer
Tubes Number
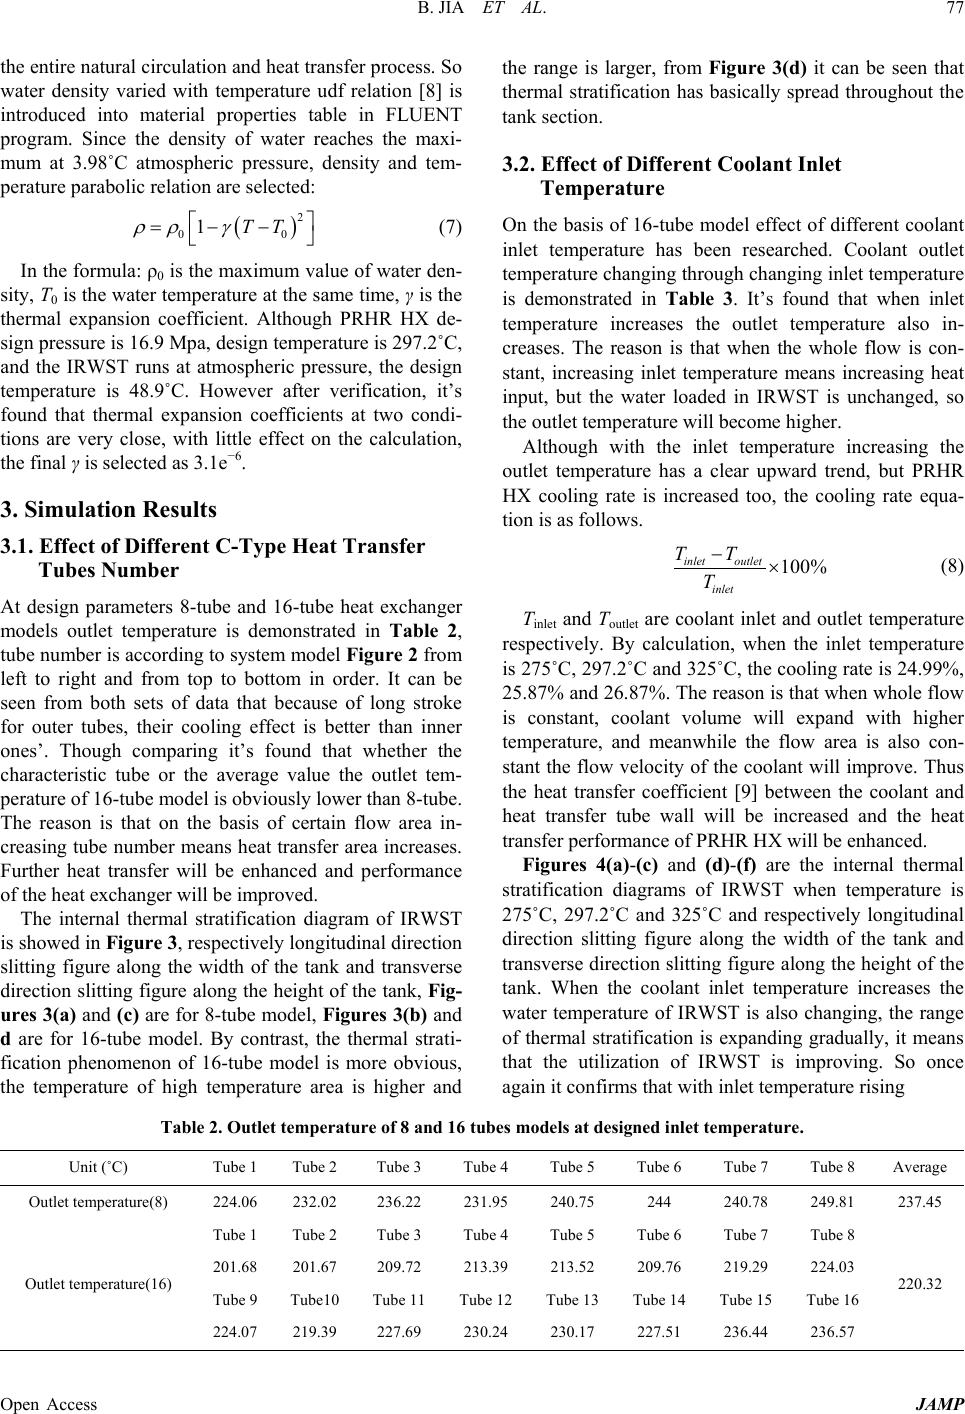
At design parameters 8-tube and 16-tube heat exchanger
models outlet temperature is demonstrated in Table 2,
tube number is according to system model Figure 2 from
left to right and from top to bottom in order. It can be
seen from both sets of data that because of long stroke
for outer tubes, their cooling effect is better than inner
ones’. Though comparing it’s found that whether the
characteristic tube or the average value the outlet tem-
perature of 16-tube model is obviously lower than 8-tube.
The reason is that on the basis of certain flow area in-
creasing tube number means heat transfer area increases.
Further heat transfer will be enhanced and performance
of the hea t exchanger will be impro ve d .
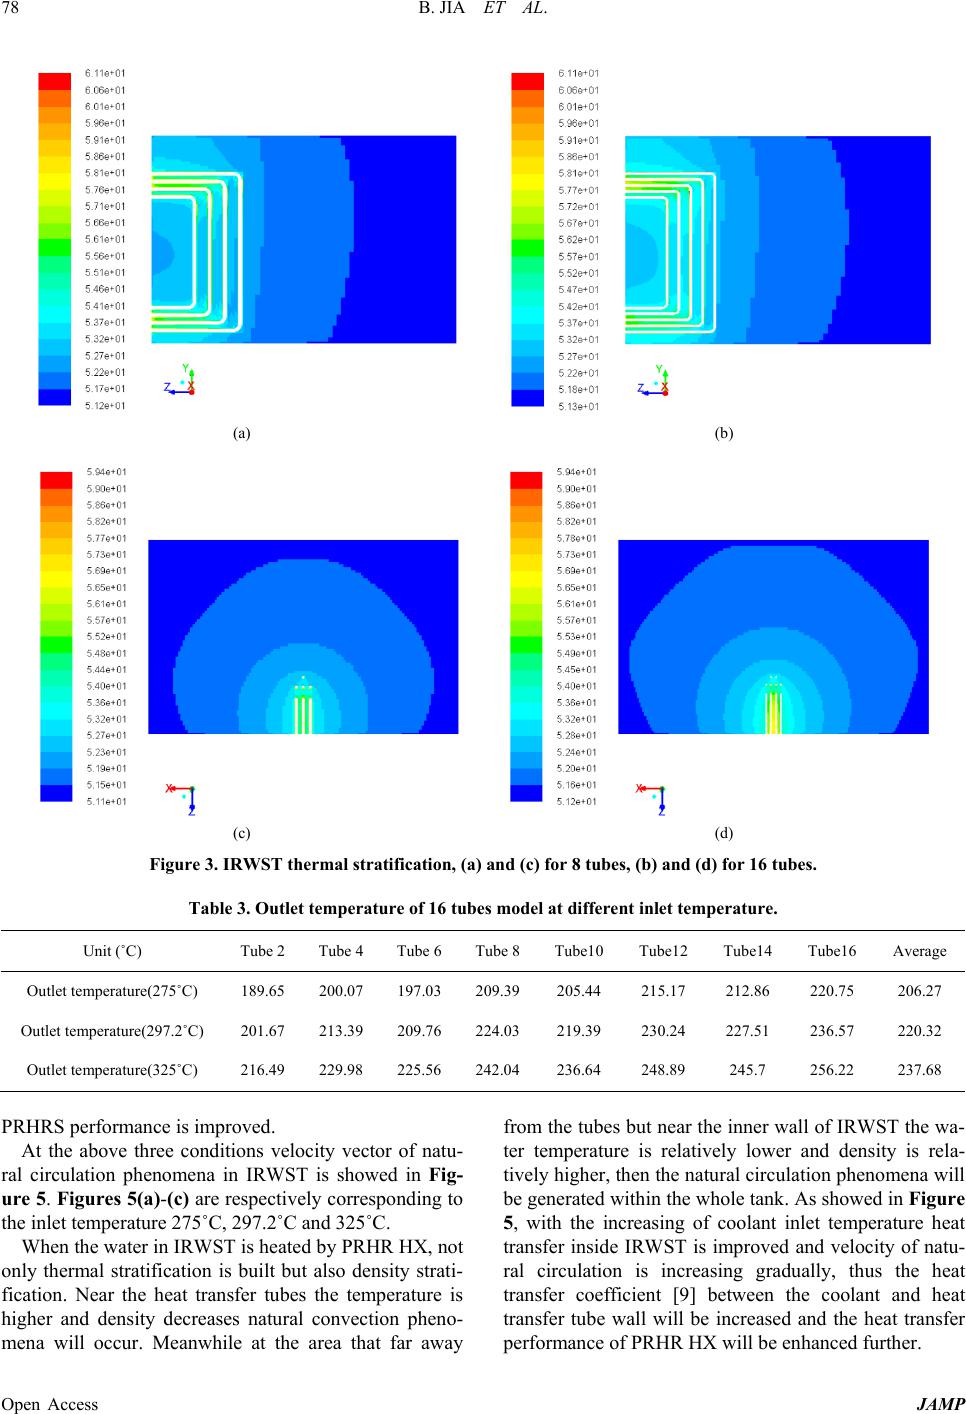
The internal thermal stratification diagram of IRWST
is showed in Figure 3, respectively longitudina l direc tion
slitting figure along the width of the tank and transverse
direction slitting figure along the height of the tank, Fig-
ures 3(a) and (c) are for 8-tube model, Figures 3(b) and
d are for 16-tube model. By contrast, the thermal strati-
fication phenomenon of 16-tube model is more obvious,
the temperature of high temperature area is higher and
the range is larger, from Figure 3(d) it can be seen that
thermal stratification has basically spread throughout the
tank section.
3.2. Effect of Different Coolant Inlet
Temperature
On the basis of 16-tube model effect of different coolant
inlet temperature has been researched. Coolant outlet
temperature changing through changing inlet temperature
is demonstrated in Table 3. It’s found that when inlet
temperature increases the outlet temperature also in-
creases. The reason is that when the whole flow is con-
stant, increasing inlet temperature means increasing heat
input, but the water loaded in IRWST is unchanged, so
the outlet temperature will become higher.
Although with the inlet temperature increasing the
outlet temperature has a clear upward trend, but PRHR
HX cooling rate is increased too, the cooling rate equa-
tion is as follows.
100%
inlet outlet
inlet
TT
T
−×
(8)
Tinlet and Toutlet are coolant inlet and outlet temperature
respectively. By calculation, when the inlet temperature
is 275˚C, 297.2˚C and 325˚C, the cooling rate is 24.9 9%,
25.87% and 26.87%. The reason is that when whole flow
is constant, coolant volume will expand with higher
temperature, and meanwhile the flow area is also con-
stant the flow velocity of the coolant will improve. Thus
the heat transfer coefficient [9] between the coolant and
heat transfer tube wall will be increased and the heat
transfer performance of PRHR HX will be enhanced.
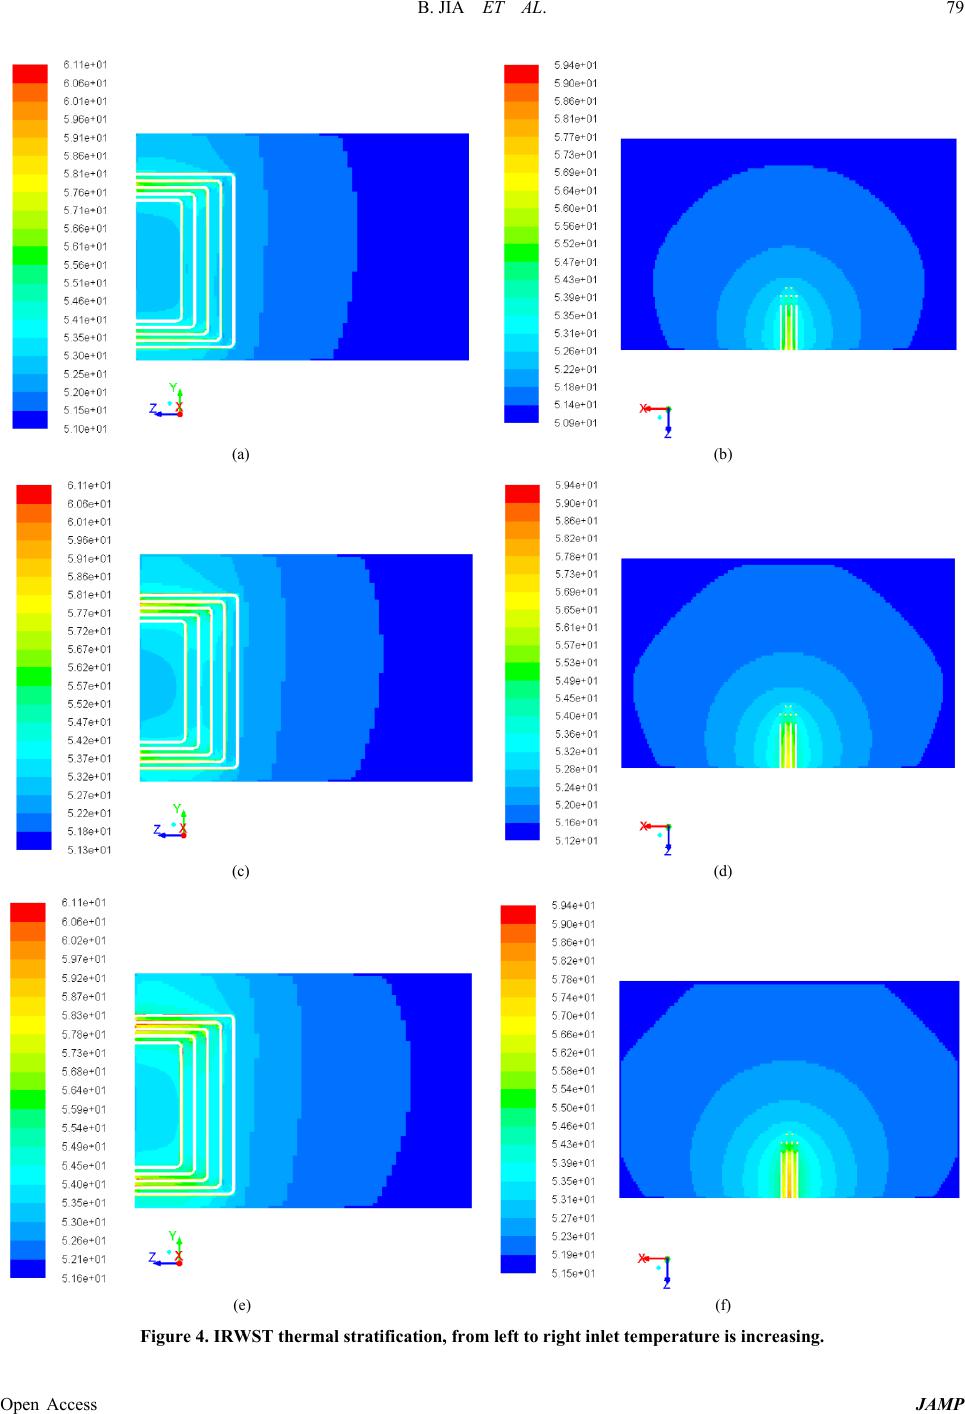
Figures 4(a)-(c) and (d)-(f) are the internal thermal
stratification diagrams of IRWST when temperature is
275˚C, 297.2˚C and 325˚C and respectively longitudinal
direction slitting figure along the width of the tank and
transverse direction s litting figure along the heigh t of the
tank. When the coolant inlet temperature increases the
water temperature of IRWST is also changing, the range
of thermal stratification is expanding gradually, it means
that the utilization of IRWST is improving. So once
again it confirms that with inlet temperature rising
Table 2. Outlet temperature of 8 and 16 tubes models at designed inlet temperature.
Unit (˚C) Tube 1 Tube 2 Tube 3 Tube 4 T ube 5 Tube 6 Tube 7 Tube 8 Average
Outlet temperature(8) 224.06 232.02 236.22 231.95 240.75 244 240.78 249.81 237.45
Outlet temperature(16)
Tube 1 Tube 2 Tube 3 Tube 4 T ube 5 Tube 6 Tube 7 Tube 8
220.32
201.68 201.67 209.72 213.39 213.52 209.76 219.29 224.03
Tube 9 Tube10 Tube 11 T ube 12 Tube 13 Tube 14 Tube 15 Tube 16
224.07 219.39 227.69 230.24 230.17 227.51 236.44 236.57