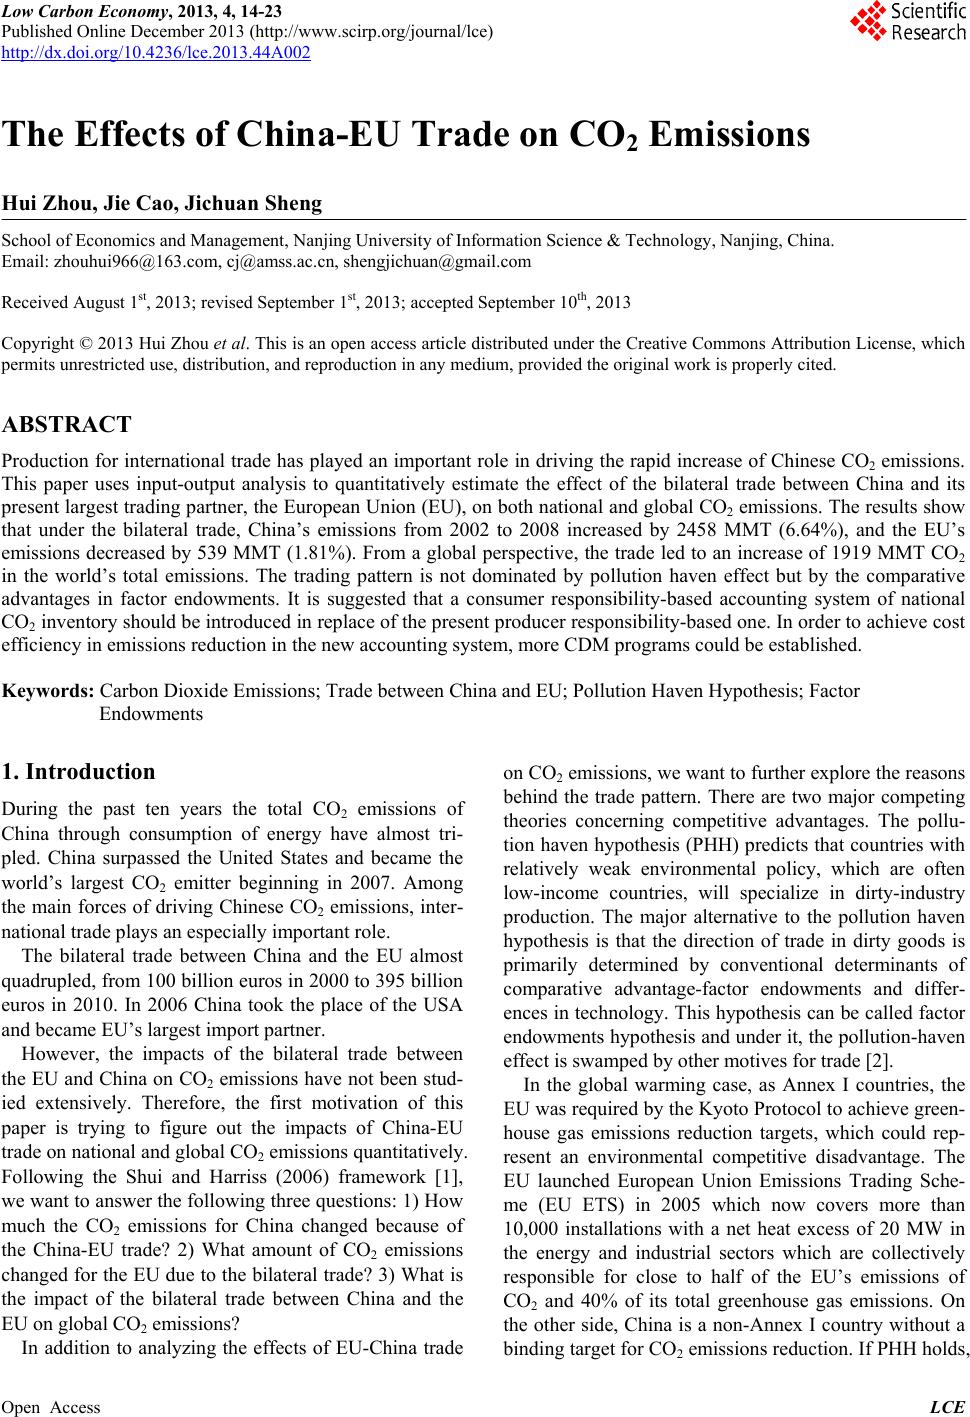
 Low Carbon Economy, 2013, 4, 14-23 Published Online December 2013 (http://www.scirp.org/journal/lce) http://dx.doi.org/10.4236/lce.2013.44A002 Open Access LCE The Effects of China-EU Trade on CO2 Emissions Hui Zhou, Jie Cao, Jichuan Sheng School of Economics and Management, Nanjing University of Information Science & Technology, Nanjing, China. Email: zhouhui966@163.com, cj@amss.ac.cn, shengjichuan@gmail.com Received August 1st, 2013; revised September 1st, 2013; accepted September 10th, 2013 Copyright © 2013 Hui Zhou et al. This is an open access article distributed under the Creative Commons Attribution License, which permits unrestricted use, distribution, and reproduction in any medium, provided the original work is properly cited. ABSTRACT Production for internation al trade has played an important role in driving the rapid increase of Chinese CO2 emissions. This paper uses input-output analysis to quantitatively estimate the effect of the bilateral trade between China and its present largest trading partner, the European Union (EU), on both national and global CO2 emissions. The results show that under the bilateral trade, China’s emissions from 2002 to 2008 increased by 2458 MMT (6.64%), and the EU’s emissions decreased by 539 MMT (1.81%). From a global perspective, the trade led to an increase of 1919 MMT CO2 in the world’s total emissions. The trading pattern is not dominated by pollution haven effect but by the comparative advantages in factor endowments. It is suggested that a consumer responsibility-based accounting system of national CO2 inventory shou ld be introdu ced in replace o f the present p roduc er responsibility-b ased one. In order to ach ieve co st efficiency in emissions reduction in the new accounting system, more CDM programs could be established. Keywords: Carbon Dioxide Emissions; Trade between China and EU; Pollution Haven Hypothesis; Factor Endowments 1. Introduction During the past ten years the total CO2 emissions of China through consumption of energy have almost tri- pled. China surpassed the United States and became the world’s largest CO2 emitter beginning in 2007. Among the main forces of driving Chinese CO2 emissions, inter- national trade plays an especially important role. The bilateral trade between China and the EU almost quadrupled, from 100 b illion euros in 2000 to 395 billion euros in 2010. In 2006 China took the place of the USA and became EU’s largest import partner. However, the impacts of the bilateral trade between the EU and China on CO2 emissions have not been stud- ied extensively. Therefore, the first motivation of this paper is trying to figure out the impacts of China-EU trade on national and global CO2 emissions quantitatively. Following the Shui and Harriss (2006) framework [1], we want to answer the followin g three questions: 1) How much the CO2 emissions for China changed because of the China-EU trade? 2) What amount of CO2 emissions changed for the EU due to the bilateral trade? 3) What is the impact of the bilateral trade between China and the EU on global CO2 emissions? In addition to analyzing the effects of EU-China trade on CO2 emissions, we want to further explore the reasons behind the trade pattern. There are two major competing theories concerning competitive advantages. The pollu- tion haven h ypothesis (PHH) predicts that co untries with relatively weak environmental policy, which are often low-income countries, will specialize in dirty-industry production. The major alternative to the pollution haven hypothesis is that the direction of trade in dirty goods is primarily determined by conventional determinants of comparative advantage-factor endowments and differ- ences in technology. This hypothesis can be called factor endowments hypothesis and under it, the pollution-haven effect is swamped by other motives for trade [2]. In the global warming case, as Annex I countries, the EU was required by the Kyoto Protocol to achieve green- house gas emissions reduction targets, which could rep- resent an environmental competitive disadvantage. The EU launched European Union Emissions Trading Sche- me (EU ETS) in 2005 which now covers more than 10,000 installations with a net heat excess of 20 MW in the energy and industrial sectors which are collectively responsible for close to half of the EU’s emissions of CO2 and 40% of its total greenhouse gas emissions. On the other side, China is a non-Annex I country without a binding target for CO2 emissions reduction. If PHH holds,  The Effects of China-EU Trade on CO2 Emissions 15 the EU has incentives to transfer energy-intensive indus- tries to China, or to directly import energy-intensively produced goods from China in order to reduce domestic carbon emissions. Therefore, has China become the “CO2 pollution haven” for the EU, or was the trade mainly driven by endowment facto rs? This is th e second motiva- tion of this paper and in order to an swer this qu estion, we will: 1) identify the pattern of the bilateral trade between China and EU; and 2) testify the pollution haven hy- pothesis for the carbon intensive sectors. According to the above research aims, the rest of the paper is organized as follows: Section two reviews recent literatures on the topic; section three introduces the methodologies, including input-output analysis and the indicator for PHH; sector four presents the data sources; section five proposes the main results; section six makes discussions on carbon leakage and the trade driving forces; and section seven concludes the paper. 2. Literature Review Many studies show that China is a net exporter of energy, and the energy embodied in exports tends to increase over time, which is driven by the consumptions in the developed world. Wang and Watson (2007) make an ini- tial assessment of the emissions from the goods and ser- vices that China exported in 2004, concluding that the net exports from China accounted for 23% of its total CO2 emissions. It supports the argument that the steep rise in China’s emissions has been fueled by exports of cheap goods from its factories to western consumers [3]. Weber, et al. (2008) find that in 2005, around one-third of Chinese CO2 emissions (1700 Million Metric Tons, MMT) were due to production of exports, and this pro- portion has risen from 12% (230 MMT) in 1987 and only 21% (760 MMT) as recently as 2002 [4]. According to the estimation of Guan, et al. (2009), half of China’s re- cent increase in carbon emissions has been driven by its production of goods for export—60% of which went to wealthy OECD states [5]. Lin and Sun (2010) show that about 3357 MMT CO2 emissions were embodied in the exports of China while the emissions avoided by imports were only 2333 MMT in 2005, implying that China was a net exporter of CO2 emissions [6]. There are other studies focusing on the carbon emis- sions embodied in bilateral trade between China and its top trading partners. The most relevant one is Yang et al. (2011) which also study the impact o f China- EU trade on climate change. They find out that the EU has outsourced its own emissions to an extent of ca 13.6% of its total energy-related CO2 emissions (2006/7) and the emissions embodied in China-EU trade were very imbalanced [7]. As for China and the US, about 7% - 14% of China’s CO2 emissions were a result of producing exports for US consumers during 1997-2003. US CO2 emissions would have increased from 3% to 6% if the goods imported from China had been produced in the US [1]. The de- composition analysis of embodied CO2 emissions in the trade between China and Japan reveals that the growth of exports (or activity change) had a large influence on the growth of embodied CO2 emissions during 1990-2000 [8]. Liu, et al. (2010) point out that the exported CO2 emissions from China to Japan greatly increased in the first half of the 1990s and had reduced from 1995 levels by 2000 [9]. It is estimated that through trade with China, the UK reduced its CO2 emissions by approximately 11% in 2004, compared with a non-trade s c e n ar io in which the same type and volume of goods were produced in the UK [10]. On the PPH, empirical evidences are mixed. Some stu- dies prove the existence of pollution havens. A study on Italy verifies that as a Kyoto and European Emissions Allowance Trading Scheme (EATS) complying country, evidence of a change in the trade patterns occurred on the basis of the PPH does exist [11]. Cole (2004) finds evi- dence of pollution haven effects, using detailed data on North-South trade flows for pollution intensive products, but such effects do not appear to be widespread and ap- pear to be relatively small compared to the roles played other explanatory variables [12]. Using a new dataset on the stringency and enforcement of environmental policy, Kellenberg (2009) is the first to find robust confirmation of a pollution haven effect in a cross-country context by accounting for strategically determined environment, trade, and intellectual property right policies [13]. However, some studies reject an association between environmental regulation and trade in dirty industries. Liddle (2001) find that the benefits of trade can be either positive or negative depending on country endowments, but their results do not support the pollution haven hy- pothesis [14]. Kearsley and Riddel (2010) reject the PHH because they find only very weak statistical evidence that dirty imports are correlated with higher emissions [15]. Dietzenbacher and Mukhopadhyay (2007) find out that the gains from trade have increased comparing 1996/ 1997 with 1991/1992, indicating that India has moved further away from being a pollution haven [16]. 3. Methodologies 3.1. The Input-Output Framework This paper first seeks to calculate the CO 2 emissions em- bodied in imports and exports. The embodied CO2 emis- sion of a product is an accounting methodology which aims to find the sum total of the carbon emissions in an entire product lifecycle. This lifecycle includes raw ma- terial extraction, transport, manufacture, assembly, in- stallation, disassembly, deconstruction and/or decompo- sition. Open Access LCE  The Effects of China-EU Trade on CO2 Emissions 16 The input-output analysis (IOA), which was first de- veloped by Wassily Leontief in 1936, is adopted in this paper for the purpose of estimating embodied emissions. Since the IO table is able to capture indirect environ- mental impacts caused by upstream production, it has frequently been used to analyze the emissions embodied in goods during the last few decades. Assuming that an economy includes n industries, the equation can be represented as: Ax y. (1) Where x is a column vector representing the total out- put of the entire economy. x is decomposed into two parts, the intermediate input for producing the total out- put, which is Ax, and the final demand, which is y. A is the direct requirement coefficients matrix, whose element aij (i, j = 1, … n) represents the amount of input from industry i required directly in order to produce one unit of output from industry j. The final demand y in the IO model includes household consumption, government consumption, investment and net export. The relationship between the final demand y and the total output x can be represented as: 1 IA y . (2) Where 1 A is called the Leontief inverse matrix, which is also called the cumulative demand coefficients matrix. Its element represents the amount of demand from industry i required directly and indirectly to pro- duce one unit final demand from industry j. The emissions C embodied in the final demand y is: 1 CEIA y . (3) Where E is a row vector representing the coefficients of direct CO2 emissions per unit output by sector. repr esents the coefficien ts matrix of cumula- tive CO2 emissions per unit output by sector. 1 EI A According to this framework, the amount of the avoid- ed CO2 emissions in the EU by importing goods from China is: 1 1 UCEE EU CE IAyRy UCE . (4) Where: EEU is the coefficients vector of the EU’s di- rect CO2 emissions per unit output and 1 EU EU U REIA represents the coefficients matrix of cumulative emissions per unit outpu t in the EU. yCE is the vector of the Chinese exports to the EU . The CO2 emissions embodied in the production of the exports from China to the EU are: 1 2CCE C CEIAy Ry CCE . (5) Where: EC is the coefficients vector of the China’s di- rect CO2 emissions per unit output and 1 CC C REIA represents the accordingly coefficients matrix of cumula- tive emissions per unit ou tput in China. On the other hand, the amount of avoided CO2 emis- sions in China by importing fro m the EU is: 1 3CEUEC C CEIAy Ry EUE . (6) Where: yEUE is the vector of the EU exports to China. The CO2 emissions embodied in the production of the exports from the EU to China are: 1 4 UEUEEU EUE EU CEIAy Ry . (7) In summary, the amount of CO2 emission change of China compared to a non-trade scenario is the difference between the emissions embodied in the exports to the EU and the avoided emissions embodied in the imports from EU, which is represented as: 12 CCC 3 . (8) Similarly, the amount of CO2 emission change of EU because of bilateral trade is the difference between the emissions embodied in the exports to China and the avoided emissions embodied in the imports from China, which is shown as: 24 CCC 1 . (9) The world’s total CO2 emissions changes due to the bilateral trade between China and the EU compared to the non-trade scenario is: 1 CCC 2 . (10) For the results of (8)-(10), a positive value means an increase of the emissions while the negative value im- plies a decrease of the emissions. 3.2. Indications about the Pollution Haven Hypothesis In this paper, the indicator of net export-domestic con- sumption ratio is used to testify whether the pollution haven hypothesis is true [11]. The indicator is defined as the following: kkk CE EUE NyyC k . (11) Where and k CE y k UE y, following the definition in the preceding section, represent respectively Chinese exports and imports of sector k toward or from the EU. represents the domestic apparent consumption of the products of sector k in China, which is obtained through: k C kkk CPIE k . (12) Where is the domestic total production of secto r k in China. k P k and are total import and export of sector k. k E Open Access LCE  The Effects of China-EU Trade on CO2 Emissions 17 If the indicator shows an increasing trend, the PHH may occur. On the converse, the PHH is rejected. 4. Data Sources 4.1. CO2 Emission factor for Chinese Industry We follow the method proposed by [17] to construct EC: the direct CO2 emissions coefficients vector in China. The data of final energy consumption by sector were collected from China Energy Statistical Yearbook (CE- SY) 2008. In this database, the entire economy is catego- rized into 44 sectors. In addition, we use the latest-available version of the Chinese input-output table of 2007 to acquire the basic matrix. There are two categorizations in the input-output table, which are 42 sectors and 135 sectors. However, neither of them is in accordance with the 44-sector cate- gorization in the CESY. So we made a match between the 42-sector of input-output table and the 44-sector of energy consumption, and re-categorized the entire econo- my into 29 sectors, listed in the Appendix 1. 4.2. CO2 Emission Factor for EU Industry EEU, the direct CO2 emissions coefficients vector in the EU, is obtained through the E3IOT database, and the avoided CO2 emissions in the EU and the embodied CO2 emissions for EU exports are calculated using the Chain Management by Life Cycle Assessment (CMLCA) soft- ware. Both the database and the software were developed by the Institute of Environmental Sciences of Leiden University, the Netherlands. The CMLCA is a software tool that supports the calcula tion of input-output analysis (IOA), including environmental input-output analysis (EIOA). The E3IOT database contains a high resolution, environmentally extended input-output table for Europe which covers production, consumption and waste man- agement sectors. It can be assumed to give a good esti- mate of total emissions and resource use (mostly fossil energy) related to final consumption in the EU-25 [18]. Because of lack of officially released input-output table of the EU, E3IOT database can serve as the best alterna- tive for the purpose of environmental extended input- output analysis of the EU in this paper. 4.3. Trade Data and Aggregation Because the E3IOT database was developed based on the area of EU-25, we focused on the trading between China and the EU-25. Because of data availability, we chose the study period to be 2002-2008. The data of bilateral trade between China and EU-25 during this period were ob- tained from the eurostat website of the European Com- mission. All the original trading data are in the form of a Har- monized System (HS) which divides the trading goods into 98 categories. In order to calculate the CO2 embod- ied in Chinese exports to the EU , we ma de a ma t c h o f the HS category with the 44-sector categorization in the Chinese input-output table, according to Appendix 4 of the Input-Output Tables of China 2007, and then aggre- gated them into the 29-sector category. On the other hand, in E3IOT datas et al most 500 pro- duction sectors are distinguished, based on the input- output table of the US. Therefore, in order to calculate the CO2 embodied in EU exports to China, we matched the EU exporting data in the HS category into the E3IOT category according to the Table of Concordance Between 2002 Input-Output Commodity Codes and Foreign Trade Harmonized Codes, which is available in the Bureau of Economic Analysis website in the US. 4.4. Data for Calculating PHH Indicator The data of total imports and exports of Chin a from 2002 to 2008 were collected from the International Trade Center website. The data of sector productions and in- vestments of China were collected from the China Statis- tical Yearbook 2003-2009. We used the exchange rates and the consumer price index (CPI) to convert the trading values, the productions and investments between years into a 2007 constan t price RMB value. 5. Results 5.1. The CO2 Emissions Embodied in Chinese Exports to the EU In 2002, China exported goods to the EU for about 90 billion euros. This number increased steadily to 245 bil- lion euros in 2008. In order to produce the goods ex- ported to the EU, China emitted large amount of CO2. The carbon emission embodied in the Chinese exports to the EU was 250 MMT in 2002 (7.21% of the total Chi- nese emissions in that year) and reached 769 MMT (12.30%) in 2007 (shown in Figure 1). The emission went down to 758 MMT in 2008. However, the percent- age of the CO2 emissions produced due to exports to the EU (referred to as EEE) to the total Chinese emissions decreased more rapidly than that of the EEE itself. This is because although the exports to the EU from China declined in 2008 due to the global economic downturn, the total Chinese emissions kept going upward during the same period. From 2002 to 2008 the accumulated CO2 emissions in China attributed to producing exports to the EU were 3736 MMT, about 10.09% of the Chinese total emissions. 5.2. The Avoided CO2 Emissions in the EU through Importing from China According to our estimation, through importing from Open Access LCE 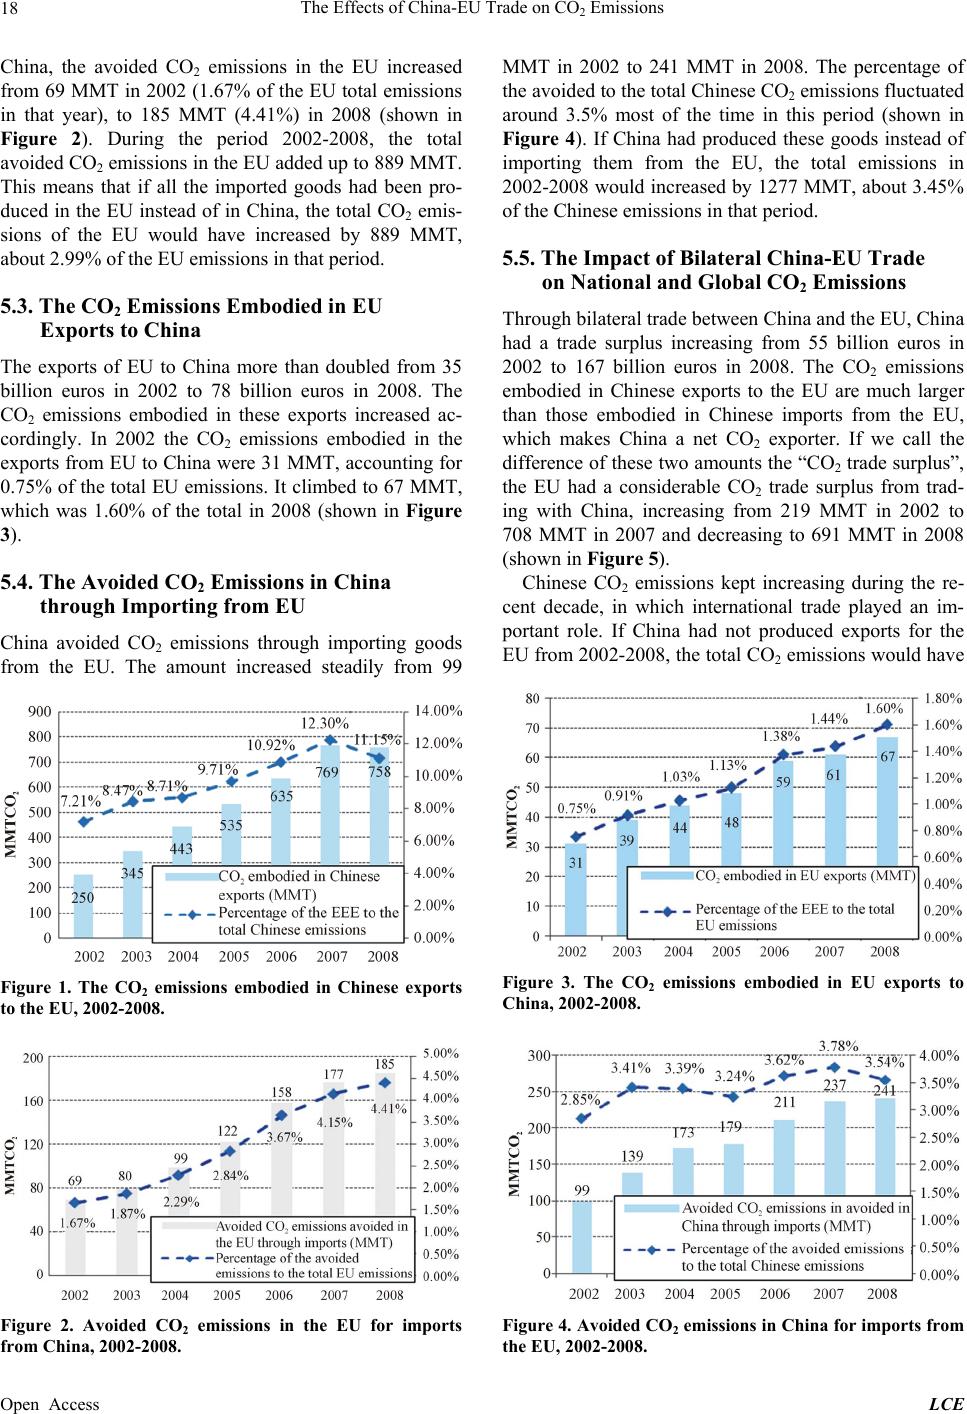 The Effects of China-EU Trade on CO2 Emissions 18 China, the avoided CO2 emissions in the EU increased from 69 MMT in 2002 (1.67% of the EU total emissions in that year), to 185 MMT (4.41%) in 2008 (shown in Figure 2). During the period 2002-2008, the total avoided CO2 emissions in the EU added up to 889 MMT. This means that if all the imported goods had been pro- duced in the EU instead of in China, the total CO2 emis- sions of the EU would have increased by 889 MMT, about 2.99% of the EU emissions in that period. 5.3. The CO2 Emissions Embodied in EU Exports to China The exports of EU to China more than doubled from 35 billion euros in 2002 to 78 billion euros in 2008. The CO2 emissions embodied in these exports increased ac- cordingly. In 2002 the CO2 emissions embodied in the exports from EU to China were 31 MMT, accounting for 0.75% of the total EU emissions. It climbed to 67 MMT, which was 1.60% of the total in 2008 (shown in Figure 3). 5.4. The Avoided CO2 Emissions in China through Importing from EU China avoided CO2 emissions through importing goods from the EU. The amount increased steadily from 99 Figure 1. The CO2 emissions embodied in Chinese exports to the EU, 2002-2008. Figure 2. Avoided CO2 emissions in the EU for imports from China, 2002-2008. MMT in 2002 to 241 MMT in 2008. The percentage of the avoided to the total Chinese CO2 emissions fluctuated around 3.5% most of the time in this period (shown in Figure 4). If China had produced these goods instead of importing them from the EU, the total emissions in 2002-2008 would increased by 1277 MMT, about 3.45% of the Chinese emissions in that period. 5.5. The Impact of Bilateral China-EU Trade on National and Global CO2 Emissions Through bilateral trade between China and the EU, China had a trade surplus increasing from 55 billion euros in 2002 to 167 billion euros in 2008. The CO2 emissions embodied in Chinese exports to the EU are much larger than those embodied in Chinese imports from the EU, which makes China a net CO2 exporter. If we call the difference of these two amounts the “CO2 trade surplus”, the EU had a considerable CO2 trade surplus from trad- ing with China, increasing from 219 MMT in 2002 to 708 MMT in 2007 and decreasing to 691 MMT in 2008 (shown in Figure 5). Chinese CO2 emissions kept increasing during the re- cent decade, in which international trade played an im- portant role. If China had not produced exports for the EU from 2002-2008, the total CO2 emissions would have Figure 3. The CO2 emissions embodied in EU exports to China, 2002-2008. Figure 4. Avoided CO2 emissions in China for imports from the EU, 2002-2008. Open Access LCE 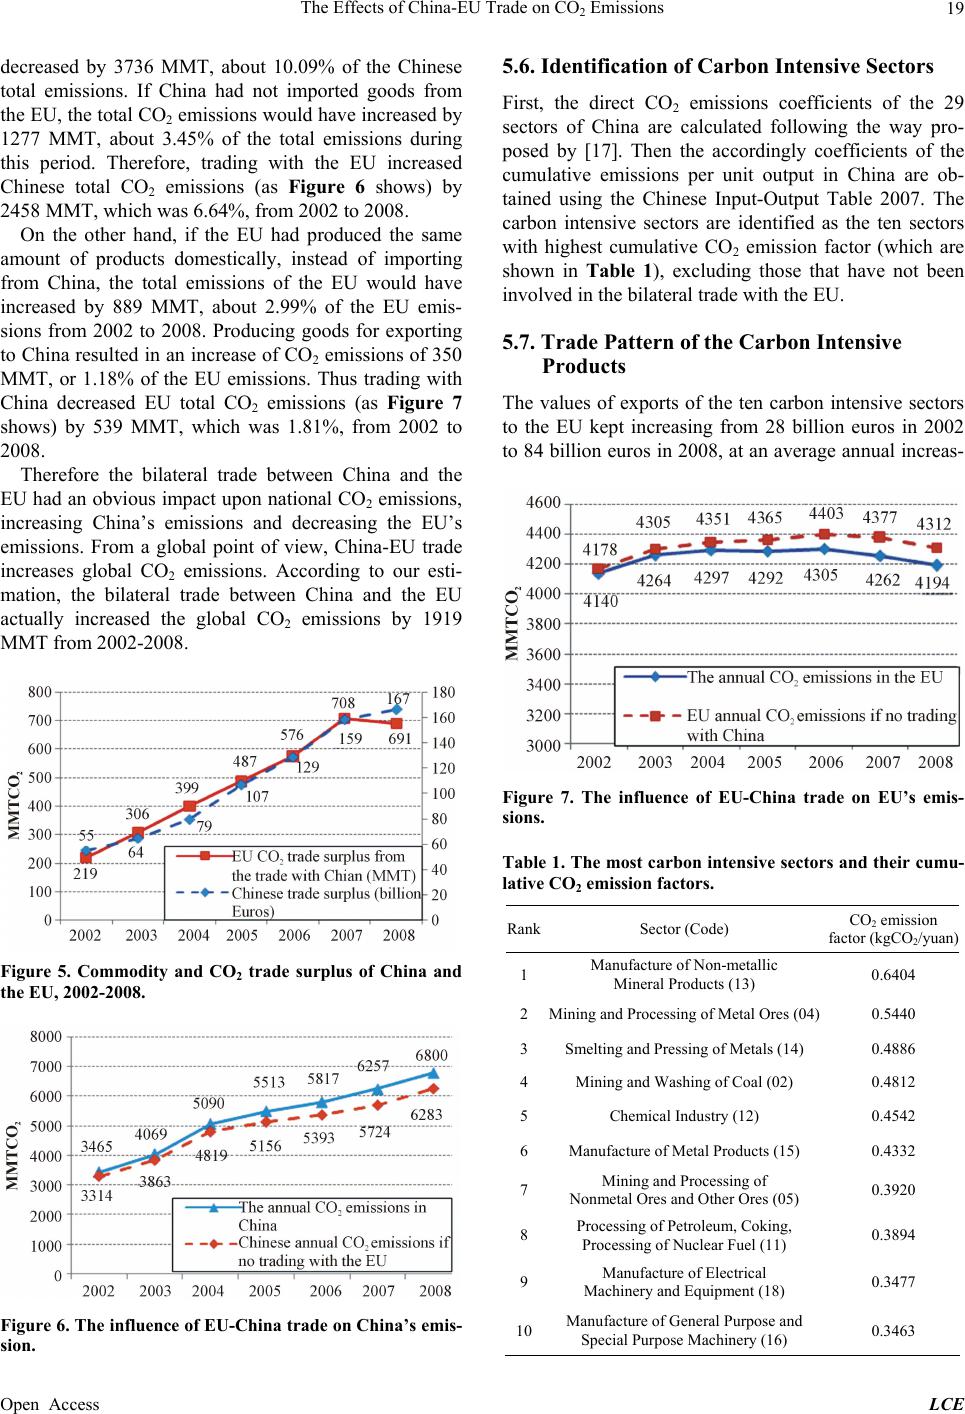 The Effects of China-EU Trade on CO2 Emissions 19 decreased by 3736 MMT, about 10.09% of the Chinese total emissions. If China had not imported goods from the EU, the total CO2 emissions would have increased by 1277 MMT, about 3.45% of the total emissions during this period. Therefore, trading with the EU increased Chinese total CO2 emissions (as Figure 6 shows) by 2458 MMT, which was 6.64%, fro m 20 02 to 2008. On the other hand, if the EU had produced the same amount of products domestically, instead of importing from China, the total emissions of the EU would have increased by 889 MMT, about 2.99% of the EU emis- sions from 2002 to 2008. Producing goods for exporting to China resulted in an increase of CO2 emissions of 350 MMT, or 1.18% of the EU emissions. Thus trading with China decreased EU total CO2 emissions (as Figure 7 shows) by 539 MMT, which was 1.81%, from 2002 to 2008. Therefore the bilateral trade between China and the EU had an obviou s impact upon national CO2 emissions, increasing China’s emissions and decreasing the EU’s emissions. From a global point of view, China-EU trade increases global CO2 emissions. According to our esti- mation, the bilateral trade between China and the EU actually increased the global CO2 emissions by 1919 MMT from 2002-2008. Figure 5. Commodity and CO2 trade surplus of China and the EU, 2002-2008. Figure 6. The influence of EU-China trade on China’s emis- sion. 5.6. Identification of Carbon Intensive Sectors First, the direct CO2 emissions coefficients of the 29 sectors of China are calculated following the way pro- posed by [17]. Then the accordingly coefficients of the cumulative emissions per unit output in China are ob- tained using the Chinese Input-Output Table 2007. The carbon intensive sectors are identified as the ten sectors with highest cumulative CO2 emission factor (which are shown in Table 1), excluding those that have not been involved in th e bilateral trade with the EU. 5.7. Trade Pattern of the Carbon Intensive Products The values of exports of the ten carbon intensive sectors to the EU kept increasing from 28 billion euros in 2002 to 84 billion euro s in 2008, at an average annu al increas- Figure 7. The influence of EU-China trade on EU’s emis- sions. Table 1. The most carbon intensive sectors and their cumu- lative CO2 emission factors. RankSector (Code) CO2 emission factor (kgCO2/yuan) 1Manufacture of Non-metallic Mineral Products (13) 0.6404 2Mining and Processing of Metal Ores (04) 0.5440 3Smelting and Pressing of Metals (14) 0.4886 4Mining and Washing of Coal (02) 0.4812 5Chemical Industry (12) 0.4542 6Manufacture of Metal Products (15) 0.4332 7Mining and Processing of Nonmetal Ores and Other Ores (05) 0.3920 8Processing of Petroleum, Coking, Processing of Nuclear Fuel (11) 0.3894 9Manufacture of Electrical Machinery and Equipment (18) 0.3477 10 Manufacture of General Purpose and Special Purpose Machinery (16) 0.3463 Open Access LCE 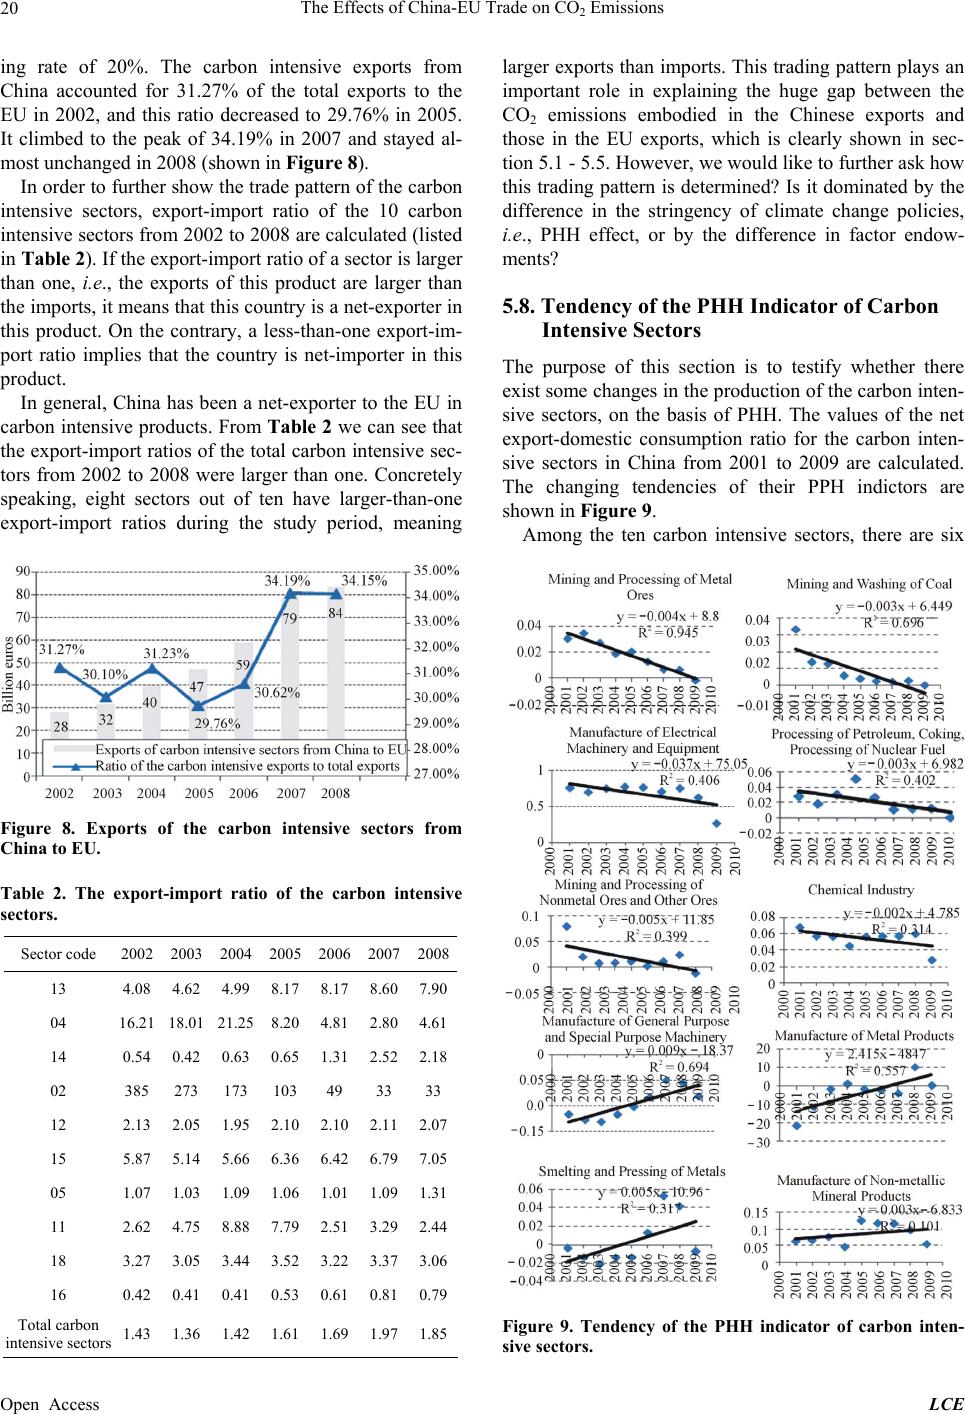 The Effects of China-EU Trade on CO2 Emissions 20 ing rate of 20%. The carbon intensive exports from China accounted for 31.27% of the total exports to the EU in 2002, and this ratio decreased to 29.76% in 2005. It climbed to the peak of 34.19% in 2007 and stayed al- most unchanged in 2008 (shown in Figure 8). In order to further show the trade pattern of the carbon intensive sectors, export-import ratio of the 10 carbon intensive sectors from 2002 to 2008 are calculated (listed in Ta ble 2 ). If the export-import ratio of a sector is larger than one, i.e., the exports of this product are larger than the imports, it means that this country is a net-exporter in this product. On the contrary, a less-than-one export-im- port ratio implies that the country is net-importer in this product. In general, China has been a net-exporter to the EU in carbon intensive products. From Table 2 we can see that the export-import ratios of the total carbon intensive sec- tors from 2002 to 2008 were larger than one. Concretely speaking, eight sectors out of ten have larger-than-one export-import ratios during the study period, meaning Figure 8. Exports of the carbon intensive sectors from China to EU. Table 2. The export-import ratio of the carbon intensive sectors. Sector code 2002 2003 20042005 2006 20072008 13 4.08 4.62 4.998.17 8.17 8.607.90 04 16.21 18.01 21.258.20 4.81 2.804.61 14 0.54 0.42 0.630.65 1.31 2.522.18 02 385 273 173103 49 33 33 12 2.13 2.05 1.952.10 2.10 2.112.07 15 5.87 5.14 5.666.36 6.42 6.797.05 05 1.07 1.03 1.091.06 1.01 1.091.31 11 2.62 4.75 8.887.79 2.51 3.292.44 18 3.27 3.05 3.443.52 3.22 3.373.06 16 0.42 0.41 0.410.53 0.61 0.810.79 Total carbon intensive sectors 1.43 1.36 1.421.61 1.69 1.971.85 larger exports than imports. This trading pattern plays an important role in explaining the huge gap between the CO2 emissions embodied in the Chinese exports and those in the EU exports, which is clearly shown in sec- tion 5.1 - 5.5. However, we would like to further ask how this trading pattern is determined? Is it dominated by the difference in the stringency of climate change policies, i.e., PHH effect, or by the difference in factor endow- ments? 5.8. Tendency of the PHH Indicator of Carbon Intensive Sectors The purpose of this section is to testify whether there exist some changes in the production of the carbon inten- sive sectors, on the basis of PHH. The values of the net export-domestic consumption ratio for the carbon inten- sive sectors in China from 2001 to 2009 are calculated. The changing tendencies of their PPH indictors are shown in Figure 9. Among the ten carbon intensive sectors, there are six Figure 9. Tendency of the PHH indicator of carbon inten- sive sectors. Open Access LCE 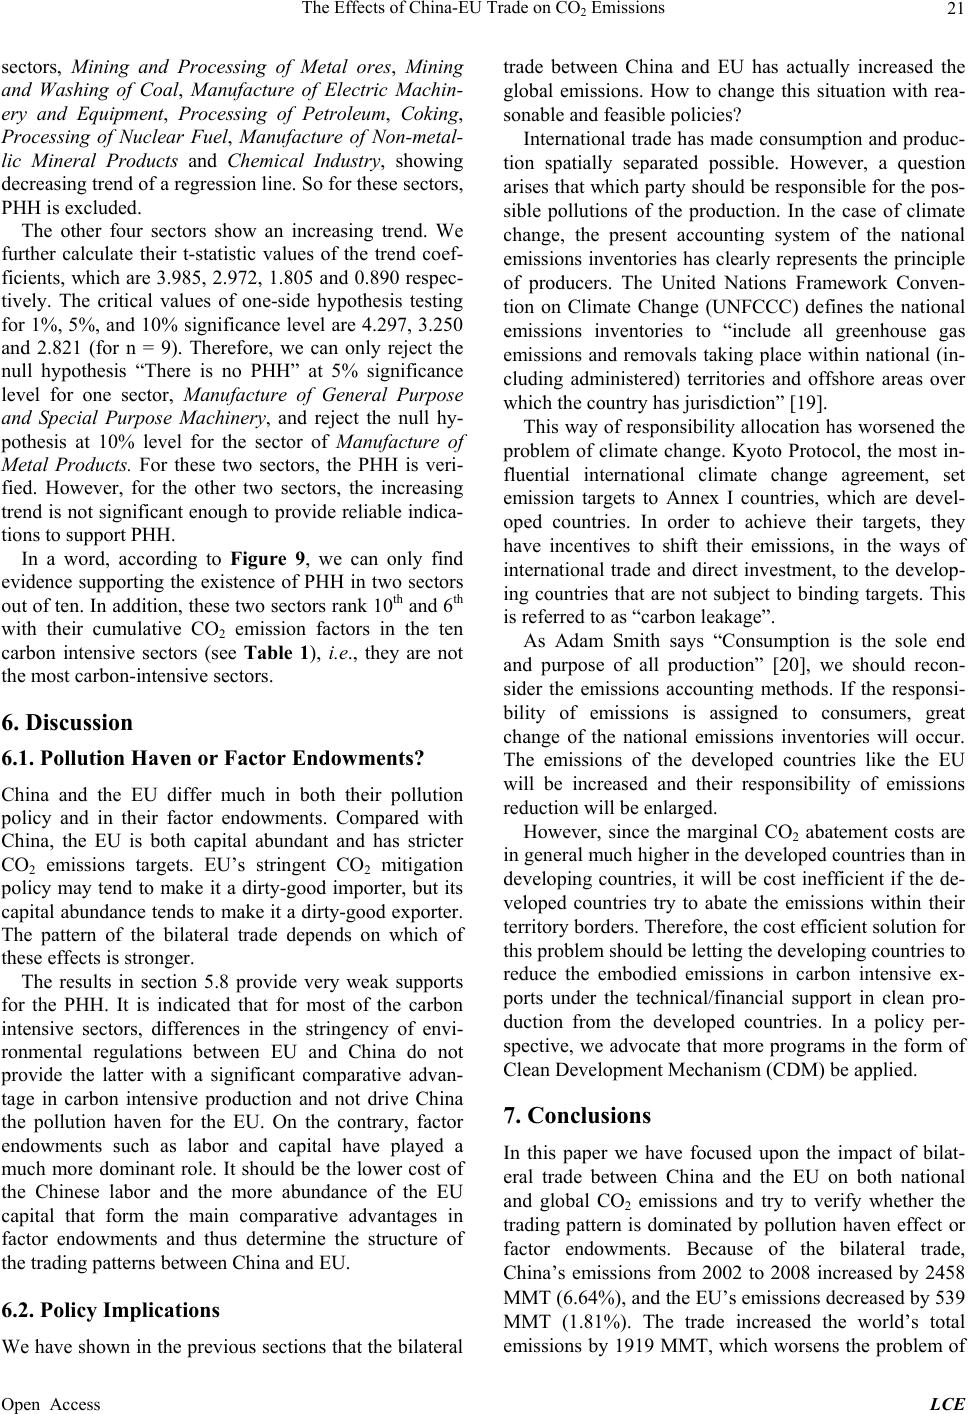 The Effects of China-EU Trade on CO2 Emissions 21 sectors, Mining and Processing of Metal ores, Mining and Washing of Coal, Manufacture of Electric Machin- ery and Equipment, Processing of Petroleum, Coki ng , Processing of Nuclear Fuel, Manufacture of Non-metal- lic Mineral Products and Chemical Industry, showing decreasing trend of a regression line. So for these sectors, PHH is excluded. The other four sectors show an increasing trend. We further calculate their t-statistic values of the trend coef- ficients, which are 3.985, 2.97 2, 1.805 and 0.890 respec- tively. The critical values of one-side hypothesis testing for 1%, 5%, and 10% significance level are 4.297, 3.250 and 2.821 (for n = 9). Therefore, we can only reject the null hypothesis “There is no PHH” at 5% significance level for one sector, Manufacture of General Purpose and Special Purpose Machinery, and reject the null hy- pothesis at 10% level for the sector of Manufacture of Metal Products. For these two sectors, the PHH is veri- fied. However, for the other two sectors, the increasing trend is not significant enough to provide reliab le indica- tions to support PHH. In a word, according to Figure 9, we can only find evidence supporting the existence of PHH in two sectors out of ten. In addition , these two sectors rank 10th and 6th with their cumulative CO2 emission factors in the ten carbon intensive sectors (see Table 1), i.e., they are not the most carbon-intensive sectors. 6. Discussion 6.1. Pollution Haven or Factor Endowments? China and the EU differ much in both their pollution policy and in their factor endowments. Compared with China, the EU is both capital abundant and has stricter CO2 emissions targets. EU’s stringent CO2 mitigation policy may tend to make it a dirty-good importer, but its capital abundance tends to make it a dirty-good exporter . The pattern of the bilateral trade depends on which of these effects is stronger. The results in section 5.8 provide very weak supports for the PHH. It is indicated that for most of the carbon intensive sectors, differences in the stringency of envi- ronmental regulations between EU and China do not provide the latter with a significant comparative advan- tage in carbon intensive production and not drive China the pollution haven for the EU. On the contrary, factor endowments such as labor and capital have played a much more dominant role. It should be the lower cost of the Chinese labor and the more abundance of the EU capital that form the main comparative advantages in factor endowments and thus determine the structure of the trading patterns b etween China and EU. 6.2. Policy Implications We have shown in th e previous sections that th e bilateral trade between China and EU has actually increased the global emissions. How to change this situation with rea- sonable and feasible po licies? International trade has made consumption and produc- tion spatially separated possible. However, a question arises that which party should be responsible for the pos- sible pollutions of the production. In the case of climate change, the present accounting system of the national emissions inventories has clearly represents the principle of producers. The United Nations Framework Conven- tion on Climate Change (UNFCCC) defines the national emissions inventories to “include all greenhouse gas emissions and removals taking place within national (in- cluding administered) territories and offshore areas over which the countr y has jurisdiction” [19 ]. This way of responsibility allocation has worsened the problem of climate change. Kyoto Protocol, the most in- fluential international climate change agreement, set emission targets to Annex I countries, which are devel- oped countries. In order to achieve their targets, they have incentives to shift their emissions, in the ways of international trade and direct investment, to the develop- ing countries that are not subject to binding targets. This is referred to as “carbon leakage”. As Adam Smith says “Consumption is the sole end and purpose of all production” [20], we should recon- sider the emissions accounting methods. If the responsi- bility of emissions is assigned to consumers, great change of the national emissions inventories will occur. The emissions of the developed countries like the EU will be increased and their responsibility of emissions reduction will be enlarged. However, since the marginal CO2 abatement costs are in general much higher in the developed countries than in developing countries, it will be cost inefficient if the de- veloped countries try to abate the emissions within their territory borders. Therefore, the cost efficient solution for this problem should be letting the dev eloping countries to reduce the embodied emissions in carbon intensive ex- ports under the technical/financial support in clean pro- duction from the developed countries. In a policy per- spective, we advocate that more programs in the form of Clean Development Mechanism (CDM) be applied. 7. Conclusions In this paper we have focused upon the impact of bilat- eral trade between China and the EU on both national and global CO2 emissions and try to verify whether the trading pattern is dominated by pollution haven effect or factor endowments. Because of the bilateral trade, China’s emissions from 2002 to 2008 increased by 2458 MMT (6.64%), and the EU’s emissions decreased by 539 MMT (1.81%). The trade increased the world’s total emissions by 1919 MMT, which worsens the problem of Open Access LCE  The Effects of China-EU Trade on CO2 Emissions 22 global warming. However, the trading pattern is not mainly determined by the difference of the stringency of climate change policies, but by the comparative advan- tages in factor endowments. In order to reduce the increased emissions caused by international trade, we propose a fundamental change of the accounting system of the national emissions invento- ries and allocate the responsibility of emissions to the consumers in replace of the producers. Furthermore, in order to simulate a cost efficient way of CO2 emissions reduction under the new accounting system, we propose that more CDM programs be established to help the de- veloping countries increase their energy efficiency in production techniques and thus reduce the emissions in their exports to the dev eloped countries. We notice that Yang et al. (2011) have studied the similar topic and get similar results that the emissions embodied in China-EU trade are very imbalanced. How- ever, our research differs from theirs in several ways. First, we cover more countries (EU-27 compared to EU- 15) and use a higher resolution in sector classifications (29 sectors compared to 15 ones); second, in addition to analyzing the impact of China-EU trade on CO2 emis- sions, we further detect the main driving force that lies behind the trading pattern; third, we make different pol- icy implications. We share the same idea with Yang et al. (2011) that a new consumer-based accounting system should be implemented. However, we suggest that by using CDMs instead of a cap-and-trade system, the dif- ficulty of including the developing countries and allocat- ing the initial emissions certificates to them could be circumvented. Besides, we do not agree with one alternative that is proposed by Yang et al. (2011) that the EU could intro- duce tariffs on CO2-intensive Chinese imports to main- tain the status quo. The rationality of imposing carbon tariffs on Chinese imports is to eliminate the difference in the stringency of the climate change regulations be- tween China and the EU. However, we have shown in our study that the trading pattern is actually not domi- nated by the pollution haven effect, but by the compara- tive advantage in factor endowments. Therefore, it will be fundamentally distortive to use the carbon tariffs in order to correct the trad ing pattern that is caused by labor and capital endowments, l et al. one that this kind of in- tervention might b e against the principles of free trading. 8. Acknowledgements The author would like to gratefully thank Dr. James E. Callaghan of Muskingum University and Professor Mo- hammad M. Ashraf of University of North Carolina at Pembroke in USA for helpful discussions and comments. This research was supported by the Humanities and So- cial Sciences Funds of Ministry of Education (Grant 13YJC790225, Grant 13YJCZH148) and the foundation of Nanjing University of Information Science & Tech- nology. REFERENCES [1] B. Shui and R. C. Harriss, “The Role of CO2 Embodiment in US-China Trade,” Energy Policy, Vol. 34, No. 18, 2006, pp. 4063-4068. http://dx.doi.org/10.1016/j.enpol.2005.09.010 [2] B. R. Copeland and M. S. Taylor, “Trade, Growth, and the Environment,” Journal of Economic Literature, Vol. 42, No. 1, 2004, pp. 7-71. http://dx.doi.org/10.1257/002205104773558047 [3] T. Wang and J. Watson, “Who Owns China’s Carbon Emissions?” Tyndall Center for Climate Change Re- search, No. 23, 2007, pp. 2-4. [4] C. L. Weber, G. P. Pete rs, D. Guan and K. Hubacek, “The Contribution of Chinese Exports to Climate Change,” Energy Policy, Vol. 36, No. 9, 2008, pp. 3572-3577. http://dx.doi.org/10.1016/j.enpol.2008.06.009 [5] D. Guan, G. P. Peters, C. L. Weber, and K. Hubacek, “Journey to World Top Emitter: An Analysis of the Driving Forces of China’s Recent CO2 Emissions Surge,” Geophysical Research Letters, Vol. 36, No. 4, 2009, Ar- ticle ID: L04709. http://dx.doi.org/10.1029/2008GL036540 [6] B. Lin, and C. Sun, “Evaluating Carbon Dioxide Emis- sions in International Trade of China,” Energy Policy, Vol. 38, No. 1, 2010, pp. 613-621. http://dx.doi.org/10.1016/j.enpol.2009.10.014 [7] L. Yang, Y. Yan, and J. Priewe, “The Impact of China- EU Trade on Climate Change,” Geopolitics, History, and International Relations, Wuhan, 12-14 August 2011, pp. 122-138. [8] Y. Dong, M. Ishikawa, X. Liu and C. Wang, “An Analy- sis of the Driving Forces of CO2 Emissions Embodied in Japan-China Trade,” Energy Policy, Vol. 38, No. 11, 2010, pp. 6784-6792. http://dx.doi.org/10.1016/j.enpol.2010.06.050 [9] X. Liu, M. Ishikawa, C. Wang, Y. Dong and W. Liu, “Analyses of CO2 Emissions Embodied in Japan-China Trade,” Energy Policy, Vol. 38, No. 3, 2010, pp. 1510- 1518. http://dx.doi.org/10.1016/j.enpol.2009.11.034 [10] Y. Li and C. N. Hewitt, “The Effect of Trade between China and the UK on National and Global Carbon Diox- ide Emissions,” Energy Policy, Vol. 36, No. 6, 2008, pp. 1907-1914. http://dx.doi.org/10.1016/j.enpol.2008.02.005 [11] I. Mongelli, G. Tassielli and B. Notarnicola, “Global Warming Agreements, International Trade and Energy/ Carbon Embodiments: An Input-Output Approach to the Italian Case,” Energy Policy, Vol. 34, No. 1, 2006, pp. 88-100. http://dx.doi.org/10.1016/j.enpol.2004.06.004 [12] M. A. Cole, “Trade, the Pollution Haven Hypothesis and the Environmental Kuznets Curve: Examining the Link- ages,” Ecological Economics, Vol. 48, No. 1, 2004, pp. 71-81. http://dx.doi.org/10.1016/j.ecolecon.2003.09.007 [13] D. K. Kellenberg, “An Empirical Investigation of the Open Access LCE  The Effects of China-EU Trade on CO2 Emissions Open Access LCE 23 Pollution Haven Effect with Strategic Environment and Trade Policy,” Journal of International Economics, Vol. 78, No. 2, 2009, pp. 242-255. http://dx.doi.org/10.1016/j.jinteco.2009.04.004 [14] B. Liddle, “Free Trade and the Environment-Develop- ment System,” Ecological Economics, Vol. 39, No. 1, 2001, pp. 21-36. http://dx.doi.org/10.1016/S0921-8009(01)00215-4 [15] A. Kearsley and M. Riddel, “A Further Inquiry into the Pollution Haven Hypothesis and the Environmental Kuz- nets Curve,” Ecological Economics, Vol. 69, No. 4, 2010, pp. 905-919. http://dx.doi.org/10.1016/j.ecolecon.2009.11.014 [16] E. Dietzenbacher and K. Mukhopadhyay, “An Empirical Examination of the Pollution Haven Hypothesis for India: towards a Green Leontief Paradox?” Environmental and Resource Economics, Vol. 36, No. 4, 2007, pp. 427-449. http://dx.doi.org/10.1007/s10640-006-9036-9 [17] G. P. Peters, C. Weber and J. Liu, “Construction of Chi- nese Energy and Emission Inventory,” Norwegian Uni- versity of Science and Technology, Trondheim, 2006, pp. 5939-5944. [18] G. Huppes, J. Guinée, R. Heijungs, L. Oers, R. Kleijn and A. Tukker, “Changes in Meat Product Consumption and Production Patterns in Europe. Annex: Description of E3IOT,” TNO Report, 2008. [19] IPCC, “Revised 1996 IPCC Guidelines for National Greenhouse Gas Inventories,” Intergovernmental Panel on Climate Change, 1996. [20] A. Smith, “An Inquiry into the Nature and Causes of the Wealth of Nations,” Shanxi People’s Publishing House, Xi’an, 2005. Appendix 1. Aggregated Sectors for Input-Output Analysis in China Code Sector CodeSector 01 Farming, Forestry, Animal Husbandry, Fishery & Water Conservancy16Manufacture of General Purpose and Special Purpose Machinery 02 Mining and Washing of Coal 17Manufacture of Transport Equipment 03 Extraction of Petroleum and Natural Gas 18Manufacture of Electrical Machinery and Equipment 04 Mining and Processing of Metal Ores 19Manufacture of Communication Equipment, Computers and Other Electronic Equipment 05 Mining and Processing of Nonmetal Ores and Other Ores 20Manufacture of Measuring Instruments and Machinery for Cultural Activity and Office Work 06 Manufacture of Foods and Tobacco 21Manufacture of Artwork and Other Manufacturing 07 Manufacture of Textile 22Recycling and Disposal of Waste 08 Manufacture of Textile Wearing Apparel, Footwear, Caps, Leather, Feather and Related Products 23Production and Distribution of Electric Power and Heat Power 09 Processing of Timber, Manufacture of Furniture 24Production and Distribution of Gas 10 Manufacture of Paper, Printing, Manufacture of Articles For Culture, Education and Sport Activity 25Production and Distribution of Water 11 Processing of Petroleum, Coking, Processing of Nuclear Fuel 26Construction 12 Chemical Industry 27Transport, Storage, Postal & Telecommunications Services 13 Manufacture of Non-metallic Mineral Products 28Wholesale, Retail Trade and Catering Service 14 Smelting and Pressing of Metals 29Other service activities 15 Manufacture of Metal Products
|