 Low Carbon Economy, 2013, 4, 1-13 Published Online December 2013 (http://www.scirp.org/journal/lce) http://dx.doi.org/10.4236/lce.2013.44A001 Open Access LCE 1 Bottom-Up Analysis of Energy Consumption and Carbon Emissions, with Particular Emphasis on Human Capital Investment Paula Castesana1, Salvador Enrique Puliafito1,2 1Universidad Tecnológica Nacional, Ciudad De Buenos Aires, Argentina; 2Consejo Nacional de Investigaciones Científicas y Técni- cas, Ciudad De Buenos Aires, Argentina. Email: pcastesana@gmail.com Received September 24th, 2013; revised October 22nd, 2013; accepted October 30th, 2013 Copyright © 2013 Paula Castesana, Salvador Enrique Puliafito. This is an open access article distributed under the Creative Com- mons Attribution License, which permits unrestricted use, distribution, and reproduction in any medium, provided the original work is properly cited. ABSTRACT Short-term and mid-term projections of energy consumption and carbon emissions raise significant concern about the availability of the necessary en ergy resources to meet the growing demand an d about the impact of emissions on global change. Different macroeconomic models address this issue through global variables, such as gross domestic product, production of goods and services, to tal population and natural resources ex traction. However, the relations among these variables are neither linear nor simple. In an attempt to base said relation s on a “bottom-up” perspective, the individual behavior of representative agents of economy, in terms of energy consumption and related carbon emissions, was stud- ied, with particular emphasis on their investment in human capital. It was found that a higher investment in human capital (e.g., education, research) was translated into a better distribution of consumption, with a higher level of energy efficiency and a slight improvement in carbon emissions intensity. Keywords: Carbon Emissions; Carbonization Index; Economic Growth; Energy Intensity Factor; Human Cap ital Investment 1. Introduction Short-term and mid-term projections of energy consump- tion and carbon emissions are generally assessed on a global scale, by using macroeconomic and social data such as gross domestic product (GDP), production of goods and services, total population, natural resources extraction and consumption, etc. The relations among these variables are neither linear nor simple, which g ives rise to a variety of economic growth theories [1-4]. Be- sides, the growing rate of energy consumption and its subsequent carbon emissions has raised multiple con- cerns about the availability and long-term sustainability of natural resources and about the impact of CO2 emis- sions on global climate change. This issue has led to an increasing interest in th e design of different models in an attempt to understand the complex relations among the variables involved, and to develop appropriate mitigation policies. However, many of these models offer a “top- down” perspective, based on global relations among the main variables, with a higher or lower level of detail [5-8]. These models provide a proper estimation of an- nual averages, but are less efficient when it comes to individual consumption (or behavior) per se. Apart from that, the international financial crisis that started in 2008 has challeng ed the app licability of curren t macroeconomic models, giving rise to a new “bottom- up” paradigm of study [9,10]. This trend has developed into a new science named Agent-based Computational Economics (ACE), which is closely related to complex dynamic systems, where economic processes are mod- eled after dynamic systems based on agents that interact among them [11-14]. This paper follows this new paradigm of computa- tional economic models’ assessment, and has the follow- ing specific purposes: 1) To analyze the relations be- tween economic and demographic variables that affect energy consumption and carbon emissions; 2) To study the effect of the individual behavior of representative  Bottom-Up Analysis of Energy Consumption and Carbon Emissions, with Particular Emphasis on Human Capital Investment 2 agents of the economy on said environmental variables; 3) To study the existence of any emergent behavior; and 4) To study the role o f human capital investment in relation to energy consumption and carbon emissions and their trends over time. 2. Methodology From a “top-down” perspective, global consumption of primary energy may be expressed as a multiplicative equation as follows [8,15-17]: e exex x (1) Where (e) is the annual consumption of fossil fuel per capita, (x) is the gross domestic product per capita (GDP/capita) and (ηe) is the energy intensity factor asso- ciated to said consumption, i.e., energy use per unit of GDP. Analogously, carbon emissions per capita (c) re- sulting from energy consumption may be expressed as a multiplicative equation following Kaya identity [18], which allows for the id entification of the main indicators responsible for such emissions: ec cxex cexi (2) Thus, carbon emission s are ex pressed as th e produ ct of the GDP/capita, the energy intensity factor and the car- bonization index (ic), which represents the amount of carbon emissions per unit of consumed energy. By taking logarithms and then differen tiating Equations (1 ) and (2), the percentage variations of the factors involved are ob- tained1: %% % e ex (3) %% %% ec cx i (4) Equations (3) and (4) show that the relative variation in energy consumption and carbon emissions of each in- dividual may be explained as the addition of the variation in their economic production and the variation in tech- nologic factors used by each individual to achieve said productio n [19,20]. In order to assess the behavior of representative agents, this paper provides a detailed analysis of the historical evolution of the factors involved in the multiplicative method, based on different variables related to individu- als’ behavior and development. The analysis was con- ducted in 57 countries2, for the 1970-2011 period and portions thereof. Said 57 countries present a wide avail- ability of data for the period and, nowadays, represent 76.13% of world population, 91.33% of GDP, 90.26% of energy consumption and 86. 86 % of carbo n emissions from energy consumption [21-23]. 2.1. Economic Growth Bibliograph y shows th at, within the scope of the study o f anthropogenic CO2 emissions, the factor related to the gross domestic product per capita (x) is analyzed from a macroeconomic approach, as per different output func- tions based on return to capital [5-7,24]. Barro and Salai- Martin [25] argue that if a closed economy based on one sector is considered, the output obtained from the return to capital may be used for consumption or investment by the representative agents of the economy. Moreover, they specify that in said closed economies, households are their only representative agents3, and that all the capital stock is owned by their residents. Taking the term capital in a broad sense, the output of each agent equals the quantities they have devoted to consumption (cons) and investment, both in physical capital (ik) and human capi- tal (ih): kh cons ii (5) In order to analyze the economic growth from a per- spective that considers individual behavior and decision making by the constituent ag ents of econo my, da ta on the different types of investments and levels of consumption of individuals was analyzed, based on their age and edu- cation level as separate indicators of human capital. To that end, average ranges of different expenditures were studied based on the age of the “head of household”, or of a representative individual of the household, for some of the countries analyzed. The behavior of economic variables such as level of investment in human capital, consumption expenditure and average income of house- holds were included, based on the education level of the representative individual of the household. Expenditures on education and culture were taken as indicators of in- vestment in human capital. The data represented corre- sponds to year 1997 for Argentina, and the average data of the 2002-2011 decade for USA and UK [26-28]. 2.2. Definition of Typical Agents In order to continue with the study from a perspective that considers individual behavior, it is further argued that each one of the countries analyzed may be regarded, in turn, as a group of individuals, symbolized by a single representative individual of each region, or a typical agent. In order to characterize these typical agents, val- ues per capita of the different variables analyzed were considered as representative values of the historical de- 3The authors argue that working with a model of different companies and households, or heterogeneity of households, is the same as work- ing with a model where households are the ones responsible for the output. 1For example, 1% dlncdx dtc dtc . 2The list of countries analyzed and the symbols used for each in the graphics included in this paper are shown in Appendix A. Open Access LCE  Bottom-Up Analysis of Energy Consumption and Carbon Emissions, with Particular Emphasis on Human Capital Investment 3 velopment of different types of individuals4 with differ- ent levels of technological development. Thus, for each year of the period under analysis, each representative individual would have developed with a given GDP (equal to the GDP/capita of the country by they repre- sented), a level of consumption, a level of investment in both types of capital, and an energy consumption and its subsequent carbon emissions, related to the values that said individual (or country) has used for the technologi- cal indicators under analysis. For this analysis, the countries were grouped accord- ing to their level of investment in human capital. To that end, data for the 1996-20 11 period was used (due to th eir availability), referring to the percentag e of GDP invested by countries in research and development (R&D) as a regional estimator of the level of human capital of the representative individuals of such countries [23]. Said groups were labeled based on increasing values of in- vestment in R&D: 1) Group 1 : Unfavorable human cap ital (investment in R&D below 0.5% of GDP). 2) Group 2: Medium human capital (investment in R &D above 0.5% and below 1.5% of GDP). 3) Group 3: Favorable human capital (investment in R &D above 1.5% and below 2.5% of GDP). 4) Group 4: Very favorable human capital (investment in R&D above 2.5% of GDP). Later, for the purposes of assessing different parts of the period under analysis and draw co mparisons between them, said classification was extended to the whole 1970- 2011 period, and the countries were grouped under one of the four categories of investment in R&D, based on their average investment level for the 1996-2011 period. Thus, the countries were classified as typical agents with upward or downward trend towards investment in human capital. Secondly, the following categories were defined based on the efficiency level of the energy intensity factor (ηe) used by each typical agent [21,23]: 1) Unfavorable in tensity (energy intensity v alues more than 1.5 times the world average value for 1970). 2) Medium intensity (less than 1.5 and more than 0.75 times the world average value for 1970). 3) Favorable intensity (less than 0.75 and more than 0.50 times the world average value for 1970). 4) Very favorable investment (less than 0.50 times the world average value for 1970). Lastly, three categories were created according to the efficiency level of carbon emissions of each typical agent, based on the carbonization index (ic) valued used by each one in each unit of time t (year) [21]: 1) Unfavorable carbonization (carbonization index values above 90% of the world average for 1 97 0 ). 2) Medium carbonization (below 90% and above 70% of the world average value for 1970). 3) Favorable carbonization (below 70% of the world average value for 1970). These groups and subgroups, together with those de- scribed in the economic section, present the basic char- acteristics of typical agents. In other words, each typical agent will be characterized by a level of investment in human capital and of consumption, a level of efficiency in energy consumption and emissions into the atmos- phere, and age, variables which could change in each agent dependi n g on the pe ri o d under analysis: agents = f (age, human capital investment, consump- tion level, energy intensity, carbonization). 2.3. Energy Intensity Factor The energy intensity factor (ηe) represents the amount of energy used per each dollar generated by the gross do- mestic product. Both at a global level and for the most developed regions, historical data shows a constant im- provement in energy intensity, which translates into en- ergy savings per unit of production [21,23]. Said im- provement may be explained by the use of more efficient technologies, which is directly linked to the levels of investment in research and development (R&D), or in terms of this paper, of investment in human capital. Firstly, the trends of the curves obtained by graphi- cally representing the energy intensity factor of the agents of the groups with lower investments in R&D on the one hand (groups 1 and 2), and the groups with higher investments on the other hand (groups 3 and 4), based on the annual household final consumption expen- diture per capita, as indicator of the annual consumption of each individual [23]. For both variables, data corre- sponds to each year of the 1970-2011 period. Moreover, apart from the trends in the curves, the values taken by the energy intensity factors of the agents of each group were analyzed, as compared to the world average value for year 1970. Secondly, an analysis was conducted on the frequency distribution of energy intensity values within each group of investment in R&D. For the pur- poses of assessing shifts or emerging trends over time, said analysis was performed on the values for the 1971- 1990 and 1996-2011 periods. 2.4. Carbonization Index 4It is worth mentioning that, even when considering the average values of each country as sole values related to representative individuals, the variability of each studied variable in each country is omitted, the analysis presented in this article is more qualitative-oriented. Efficiency of carbon emissions into the atmosphere is related to the carbonization index (ic), which represents Open Access LCE  Bottom-Up Analysis of Energy Consumption and Carbon Emissions, with Particular Emphasis on Human Capital Investment Open Access LCE 4 3. Results carbon emissions per unit of energy consumed. An analysis was conducted on the curves obtained from graphically representing such indicator based on time [21], for those agents representing the group s with lower investment in R&D on the one hand (groups 1 and 2), and the groups with higher investment on the other hand (groups 3 and 4) , based on ti me. 3.1. Economic Growth Figure 1(a) shows the curves obtained by representing education and culture expenditure data (expressed as weekly expenditure per person) as indicators of house- hold investment in human capital, based on the age of the representative individual. On the other hand, part (b) of the figure shows the curves representing the weekly ex- penditure per person related to household consumption (the human capital expenditure being deducted) based on the age of the representative individual [26-28]. The data has been expressed relatively to the maximum value taken by the variable under analysis in each series. Thus, the values obtained may be read as proportions to the maximum (equal to 1 in each series), allowing for the observation of trends in the curves and the making of comparisons between data from different countries, thus avoiding the use of different scales. In all cases, the data represented for Argentina corresponds to year 1997, and for USA and UK, the average values for the 2002-2011 decade. Figure 2 shows the relative increase (as com- pared to the value of the group of individuals with a lower education level) in income, consumption and in- vestment in human capital of households per capita, based on the education level of the representative indi- vidual of the household [27]. Figure 3 shows expendi- ture of households per capita in education (a), and in consumption (b), both as percentag es of the total income of the representative individual, based on their education level [26,27]. Besides, a further analysis was conducted on the evo- lution over time of the proportions of the sources of en- ergy used by a group of countries selected as per the dis- tribution of their energy matrix [21]. Said countries in- clude some with strong economies and high percentages of nuclear (France) and hydraulic (Norway, Brazil) en- ergy use, countries with emerging economies and high percentages of use of carbon (China and India), a fuel with an emission factor above the average of fossil fuels, countries with a high percentage of gas (Argentina) and oil consumption (Ecuador), as compared to the world- wide trend. Graphics were prepared to show the propor- tions of the sources of energy used, and the historical curves of the carbonization index related to the represen- tative agents of said countries, for the 1970-2011 period, were also included. Moreover, the values for the carbonization index for the 1996-2011 period were also analyzed, based on the percentage of GDP invested in R&D of each agent. Said data was represented graphically, and 4 divisions were made on the horizontal scale as per the different ranges of the human capital indicator, while 3 divisions were made on the vertical scale, as per the efficiency catego- ries used by the indicator. Besides, an analysis was conducted on the frequency distribution of the carbonization indexes used by the agents, as per the 4 groups of investment in R&D. As in the previous section , said an alysis covered the 19 71 -1990 and 1996-2011 period s. 3.2. Energy Intensity Figure 4 shows energy intensity curves based on con- sumption, divided into agents with downward trend to- Figure 1. (a) Investment in human capital of households, and (b) Consumption expenditure per capita as per the age of the representative individual (Argentina, USA and UK).  Bottom-Up Analysis of Energy Consumption and Carbon Emissions, with Particular Emphasis on Human Capital Investment 5 Figure 2. Income, consumption and investment in human capital per capita by households as per the education level of the representative individual (USA). Figure 3. (a) Education expenditure and (b) Consum ption expenditure per capita, as per education le ve l. Figure 4. Energy intensity as per the annual expenditure on final consumption of households for investment in R&D below 1.50% of GDP (a), and above 1.50% of GDP (b). Open Access LCE  Bottom-Up Analysis of Energy Consumption and Carbon Emissions, with Particular Emphasis on Human Capital Investment Open Access LCE 6 Table 2. Proportions of specific data in each of the catego- ries of energy efficiency and investment in R&D. wards investment in human capital (a), and agents with upward trend towards investment (b). Table 1 shows the average value of this indicator for each of the 4 groups of investment in R&D, together with the related category as Human capital Group 1Group 2 Group 3 Group 4 Efficiency level 1971-1990 period Total by efficiency Unfavorable 2.4%11.4% 0.0% 0.0%13.9% Medium 11.8%7.2% 11.3% 2.1%32.4% Favorable 12.3%5.6% 13.5% 4.9%36.3% Very favorable 6.4%4.3% 3.1% 3.6% 17.5% Total by human capital32.9%28.5% 27.9% 10.6%100% Efficiency level 1996-2011 period Total by efficiency Unfavorable 10.3% 16.4% 0.0% 0.0%26.7% Medium 11.1% 8.7% 5.0% 0.9% 25.7% Favorable 8.3%7.7% 6.8% 3.6%26.4% Very favorable 1.1%5.3% 8.4% 6.4% 21.3% Total by human capital30.8%38.1% 20.3% 10.8%100% per the energy efficiency level, for the 1971-1990 and 1996-2011 periods. Moreover, said table also shows the values obtained for the standard deviation ( ), and the levels of maximum and minimum values taken by the indicator in each data group for both periods. Table 2 shows the proportions of specific data for each of the categories determined (level of energy efficiency and investment in R&D), for both periods. This information is supplemented by Figure 5, which shows the distribu- tion in each period of the values taken by the energy in- tensity factor as per its efficiency level, in each of the groups of investment in R&D or human capital. Table 1. Characteristics of energy intensity values for each group of investment in human capital. Human capital Group 1 Group 2 Group 3 Group 4 Energy intensity 1971-1990 period Average ηe (± ) 0.88 (0.67) 1.76 (1.77) 0.74 (0.22) 0.60 (0.22) Maximum ηe 6.93 9.22 1.39 1.06 Minimum ηe 0.24 0.40 0.33 0.25 Efficiency level medium unfavorable favorable favorable Energy intensity 1996-2011 period Average ηe (± ) 1.71 (1.38) 1.97 (2.13) 0.62 (0.25) 0.46 (0.17) Maximum ηe 7.39 11.21 1.47 1.00 Minimum ηe 0.23 0.25 0.29 0.25 Efficiency level unfavorable unfavorable favorable very favorable 3.3. Carbonization Index Figure 6 shows the historical trend of the carbonization index of agents, divided as per their trend towards in- vestment in R&D. For its part, Figure 7 shows, in over- lap, the curves fo r the carbonization ind ex and the evolu- tion over time of the proportions of the sources of energy used as from 1970 [21], for three sectors with different types of consumption: energy consumption based on non-emission sources (France, Norway and Brazil), con- sumption based on medium-emission sources (Argentina and Ecuador), and consumption based mainly on “dirty fuels” (China and India), as compared to the worldwide trend. Figure 8 shows the values of the carbonization Figure 5. Distribution of energy intensity values within each group of investment in R&D, for the 1971-1990 (a) and 1996- 2011 (b) periods.  Bottom-Up Analysis of Energy Consumption and Carbon Emissions, with Particular Emphasis on Human Capital Investment 7 Figure 6. Carbonization index as per time, for countries with investment in R&D below 1.50% of GDP (a), and above 1.50% of GDP (b). index corresponding to the representative individuals of the different countries for the 1996-2011 period, as per the percentage of GDP invested in R&D, together with the divisions on the horizontal and vertical scales men- tioned in the above section. Besides, the average values of the carbonization index were calculated for the 4 groups divided according to their levels of investment in R&D. Said values are shown in Table 3, together with the standard deviation (σ), the levels of maximum and minimum values, and the categories for the indicator as per its efficiency level, for the 1971-1990 and 1996-2 011 periods. Table 4 shows the proportions of specific data for the categories related to the carbonization index and to the level of investment in R&D, for both periods. In turn, Figure 9 was prepared based on the analysis of fre- quency distribution performed for this indicator, and it shows the distributions of the carbonization index values for the countries under analysis within each of the groups classified according to their level of investment in R&D, for the 1971-1990 and 1996-2 011 periods. 4. Discussion 4.1. Economic Growth It may be observed that when representing the expendi- ture in consumption and education of the representative individuals of the households according to their ages, the curves obtained show an evolution in the form of an in- verted bell, with a maximum located at a given time of each individual’s life. The age corresponding to said maxima is dependent, in turn, on the type of expenditure, the period under analysis and the idiosyncrasy of the represented group of humans. On the other hand, when representing the economic variables analyzed according to the education level of individuals, it may be observed that when such increases, the proportion of the total in- come invested in human capital shows a significant in- Table 3. Characteristics of carbonization index values for each group of investment in human capital. Human capital Group 1Group 2 Group 3Group 4 Carbonization index1971-1990 period Average ic (± ) 0.91 (0.10)0.96 (0.16) 0.89 (0.21)0.76 (0.18) Maximum ic 1.16 1.24 1.12 1.00 Minimum ic 0.72 0.57 0.30 0.40 Efficiency level of emissions unfavorable unfavorable mediummedium Carbonization index1996-2011 period Average ic (± ) 0.86 (0.11) 0.90 (0.16) 0.79 (0.20)0.74 (0.19) Maximum ic 1.14 1.20 1.07 0.98 Minimum ic 0.58 0.53 0.31 0.36 Efficiency level of emissions mediumunfavorable mediummedium Table 4. Proportions of specific data in each of the catego- ries for carbonization index and investment in R&D. Human capital Group 1Group 2 Group 3 Group 4 Carbonization index1971-1990 period Total by efficiency Unfavorable 17.1%26.3% 15.9% 3.7%63.1% Medium 14.2% 5.9% 3.9% 2.3% 26.3% Favorable 0.0%3.1% 3.7% 3.8% 10.6% Total by human capital31.3%35.2% 23.6% 9.8%100% Carbonization index1996-2011 period Total by efficiency Unfavorable 9.6%15.5% 7.5% 3.1%35.7% Medium 19.0% 18.3% 6.2% 3.3%46.8% Favorable 2.0%4.7% 6.4% 4.4% 17.4% Total by human capital30.6%38.4% 20.1% 10.8%100% Open Access LCE  Bottom-Up Analysis of Energy Consumption and Carbon Emissions, with Particular Emphasis on Human Capital Investment 8 Figure 7. Carbonization index and evolution over time of proportions of energy sources used by different countries. crease, while the proportion devoted to consumption de- creases. It may be further observed that the higher the education level of the representative individuals, the higher their income. Nevertheless, the relative in crease in investment in human capital of individuals with higher education levels, as compared to the individuals with lower levels, is broadly higher than the relative increase in income. This means that the proportion of income al- lotted to consumption or investment in education and culture is closely related to the level of human capital of individuals and their trend towards invest in such, and, indeed, to other socioeconomic and cultural factors be- Open Access LCE  Bottom-Up Analysis of Energy Consumption and Carbon Emissions, with Particular Emphasis on Human Capital Investment 9 Figure 8. Carbonization index (compared to the world value for 1970) as per investment in R&D as % GDP. Figure 9. Distribution of carbonization index values within each group of investment in R&D. yond the scope of this paper. It may be concluded from this analysis that, in general terms, the greater th e human capital, the higher the level of investment in human capi- tal. In turn, those individuals who invest more of their time in education, or in accumulating human capital, obtain a higher income and devote a lower proportion of their production to consumption as compared to other individuals. Figures 2 and 3 show that the groups with higher education (despite having higher incomes) pro- portionately spend more in human capital (>10 times) than those with a lower education level. 4.2. Energy Intensity Factor In general terms, it may be observed that energy intensity significantly decreases for increasing levels of consump- tion per capita. The trends of the curves representing those agents less likely to investment in human capital are not that clear in all cases. Nevertheless, in some cases, and even more in the curves representing those agents more inclined to said type of investment, it is possible to find some emerging patterns. By analyzing said series separately, 3 types of trends or “sections” of a hypothe- tical path may be found: increasing trends (section a), local maxima (section b), and decreasing trends (section c). In turn, it may be observed that some agents go through the 3 described sections in their curves, so that they show, for lower levels of consumption, an increas- ing trend up to reaching a maximum where their energy intensity factor starts to decrease, a trend which is main- tained for increasing values of consumption, whereas other agents only present, up to date, just 1 or 2 of the sections described. The level of consumption by itself does not seem to explain this behavior, since it is not possible to assign a value to it from which the curves Open Access LCE  Bottom-Up Analysis of Energy Consumption and Carbon Emissions, with Particular Emphasis on Human Capital Investment 10 show this or that trend. That is to say, for a given range of consumption values, it is possible to find increasing or decreasing curves or even local maxima based on said consumption; or in other words, there are agents who, while increasing their consumption, lower its efficiency, there are others who improve it, and others who shift its trend, within the same range. However, if countries are grouped according to their level of investment in human capital, the trend of the curves of some of them becomes clearer. In Figure 4(b), it may be observed that said curves are currently in the last of the sections described (section c) of the hypo- thetical path, or in other words, with trends more and more efficient. Besides, when comparing the vertical scales of Figure 4(a) with Figure 4(b), it may be ob- served that the latter shows significantly more efficient values of energy inten sity. Apart from that, when analyzing the energy intensity factors as specific data grouped according to the related levels of investment in R&D, it may be observ ed that the averages of the values taken by the indicator in the groups with higher investment in human capital, and their variability range, are significantly smaller than those of the groups with lower investment, both for the 1971-1990 and the 1996-2011 periods (Table 1). Going into further detail, Table 1 shows that in both periods the less efficient values of energy intensity are those of the second group of investment in human capital (group 2). In turn, it may be observed that the two groups with higher investment show an improvement in their energy efficiency over the years, while the two groups with lower investment show a shift to less favorable values. When analyzing th e d istribu tio n of the lev els of en ergy efficiency within each group, it may be observed that for the 1971-1990 p er iod, g rou ps 1, 3 an d 4 show a Ga ussian distribution, around favorable efficiency levels for the last groups and around medium and favorable values for the first one (Figure 5(a)). It may be further observed that the curve for group 4 is inclined to more favorable values than that for group 3. If the fr equency distribution curves of these same gr oups fo r the 1996- 201 1 per iod ar e analyzed, it may be observed that they have experienced a sort of shift. In the curves of the groups with higher investment in R&D, said shift took place towards more favorable values, whereas in the group with lower in- vestment, such shift occurred towards less efficient val- ues of energy intensity. This event, together with that described in the previous paragraph, reflects, in turn, an increase in the existing inequality among the different groups of agents over time. For its part, group 2 is the only group which, in both periods, shows its higher pro- portion of energy intensity values in the unfavorable category. Moreover, in both periods, such group shows a decreasing trend in its distribution curves as the effi- ciency of the indicator under analysis increa ses. Apart from that, when analyzing Table 2, it may be observed that for th e 1971-1990 period, th e main propor- tion of data correspond s to energy intensity valu es of the favorable category, with a high proportion of medium values. However, a more homogenous distribution (or a flatter distribution curve) may be observed for the 1996- 2011 period, with an increase in the proportion of data corresponding to the level of higher energy efficiency, and in turn, an increase in the proportion of data corre- sponding to the level of lower efficiency, as compared to the previous period. By comparing both periods, it may be observed that the main contributors to the improve- ment in the proportion of very favorable values have been the groups with higher investment in R&D, and, at the opposite end, the main responsible agents for the un- favorable data increase have been the groups with lower investment in human capital. It may be further observed that for both periods, there is no data corresponding to the groups with higher investment in human capital that show inefficient energy intensity values. Bearing in mind the parallelism observed between countries and individuals representing such or typical agents, all the above may be expressed as if the individu- als who invest the more in human capital are those who use, on average, more efficient values of energy intensity, with variability ranges more restricted to higher effi- ciency values. Nevertheless, the relation between these two variables is not that linear, since the average energy intensity of the group of individuals with downward trend towards investment in human capital is more effi- cient than that of the following group. A “hypothetical path” may be again considered, where, rather than the passage of time or an increase in consumption, it is the increase in human capital that determines the direction of development. And said development, in terms of the in- dicator under analysis, implies consuming, at a very be- ginning, more and more energy so as to achieve eco- nomic growth, up to reaching a maximum from which the reduction of said consumption is possible, without jeopardizing the growth. 4.3. Carbonization Index It may be observed that most of the curves obtained by representing the carbonization index based on time, show a weak downward trend, despite their slight slopes. By comparing the graphics obtained after dividing the agents according to their higher or lower willingness to invest- ment in human capital, it may be observed that those with higher investment show more efficient values for the indicator under analysis. This fact would indicate again that investment in human capital, whether consid- Open Access LCE  Bottom-Up Analysis of Energy Consumption and Carbon Emissions, with Particular Emphasis on Human Capital Investment 11 ered on an individual or collective basis (as indicator of the technological development reached), helps to im- prove the efficiency of emissions. However, the response of this indicator to variations in investment in human capital is not as fast as in the case of the energy in tensity factor. By analyzing Figure 8 and its subdivisions, it may be observed that, even when, in general terms, in- creases in human capital investment are related to im- provements in the carbonization index efficiency, a sig- nificant vertical variability also exists. Said variability could be the result of the availability of existing energy sources in each country, or the energy sources used by the representative individuals of such countries. It may be observed in the representations of Figure 7 that those countries with high percentages of nuclear (France) or hydraulic (Norway and Brazil) energy use show very favorable values of carbonization index, while those ar- eas with high percentages of use of carbon (a fuel with an emission factor above the average of fossil fuels), such as China and India, show very unfavorable values. It may be further observed that variations in the energy sources used are rapidly reflected in the carbonization index, which shows that said factor is closely related to the technology used in the energy production. Since that production is, at a global level, controlled by the large power plants of carbon used in China and India, with poor technological efficiencies, the worldwide trend shows that, currently, said index is slightly increasing. Other contributing factors are, among others, the age of many power plants, and the long time elapsed between design and start up of a new power plant and closing of the older plant. Besides, from the frequency distribution analysis per- formed, it may be observed that even when in the 1971- 1990 period most of the individuals within each group have experienced a development using unfavorable car- bonization indexes, as the investment in human capital increases, the proportion of individuals of each group who use more efficient carbonization indexes becomes relevant. Nevertheless, as described for the energy inten- sity factor, Table 3 shows, again, that it is group 2 that stands out from the other groups, for having the least efficient average of values for both periods. Likewise, by comparing the distributions of both period under analysis, it may be observed that, over time, all groups show a shift in the levels of th e indicator toward s more favorable levels, a fact which is also reflected in the values repre- sented in Table s 3 an d 4. Th e latter show s that, ov er time, the groups with lower investment significantly reflect the improvements in the efficiency of their average carboni- zation levels. For its part, group 4 had already showed, in the first analyzed period, a distribution of values much more efficient than that of the other groups, and over time the improvement of such distribution has not been so evident. This event could be translated into the idea that the carbonization index used by individuals, due to its strong dependence on the energy sources used, may be significantly improved up to a given peak, from which the effort needed to improve it further becomes higher. 5. Conclusions The main world economic variables affecting energy consumptions and its subsequent carbon emissions have been studied in this paper. An analysis was co nducted on these variables based on the individual behavior of the representative agents of the economy, with particular emphasis on the role played by investment in human capital. It was observed that investment in human capital has a positive (favorable) effect on each of the analyzed compounding factors. At an individual level, the accu- mulation of said capital, translated into high education levels of the representativ e individuals of the economy, is reflected in a relative reduction in individual consump- tion levels, accompanied by upward trends towards in- vestment in human capital as said accumulation increases. From an energy point of view, the analysis showed that the individuals capable of improving the efficiency of their energy consumption are those who invest the most in human capital, or those whose time in their lives is mostly devoted to such accumulation. If we consider that it is human capital that determines the direction of the development of societies or groups of individuals, the promotion of investment in said type of capital, both at individual and national level, would lead to societies with behaviors of lower consumption in rela- tive terms, and of higher efficiency in energy and envi- ronmental terms. 6. Acknowledgements The authors acknowledge the funding of research grants from the National Technological University and the Na- tional Agency of Scien tific and Technological Promotion (AGENCIA), and the support and funding of the Buenos Aires Regional Faculty (UTN-FRBA) and the National Council Research of Argentina (CONICET). REFERENCES [1] G. Becker, K. Murphy and R. Tamura, “Human Capital, Fertility and Economic Growth,” Journal of Political Economy, Vol. 98, No. 5, 1990, pp. S12-S37. http://dx.doi.org/10.1086/261723 [2] C. Jones, “R & D-Based Models of Economic Growth,” Journal of Political Economy, Vol. 103, No. 4, 1995, pp. 759-784. http://dx.doi.org/10.1086/262002 [3] P. Romer, “Increasing Returns and Long-Run Growth,” Open Access LCE  Bottom-Up Analysis of Energy Consumption and Carbon Emissions, with Particular Emphasis on Human Capital Investment Open Access LCE 12 The Journal of Political Economy, Vol. 94, No. 5, 1986, pp. 1002-1037. http://dx.doi.org/10.1086/261420 [4] R. Solow, “A Contribution to the Theory of Economic Growth,” The Quarterly Journal of Economics, Vol. 70, No. 1, 1956, pp. 65-94. http://dx.doi.org/10.2307/1884513 [5] T. Fiddaman, “Feedback Complexity in Integrated Climate- Economy Models,” Ph.D. Thesis, MIT Sloan School of Management, Cambridge, 1997. [6] B. Huang, M. Hwang and C. Yang, “Causal Relationship between Energy Consumption and GDP Growth Revis- ited: A Dynamic Panel Data Approach,” Ecological Eco- nomics, Vol. 67, No. 1, 2008, pp. 41-54. http://dx.doi.org/10.1016/j.ecolecon.2007.11.006 [7] W. Nordhaus, “Managing the Global Commons: The Economics of Climate Change,” The MIT Press, London, 1994, p. 223. [8] E. Puliafito, J. Puliafito and M. Conte Grand, “Modeling Population Dynamics and Economic Growth as Compet- ing Species: An Application to CO2 Global Emissions,” Ecological Economics, Vol. 65, No. 3, 2008, pp. 602-615. http://dx.doi.org/10.1016/j.ecolecon.2007.08.010 [9] F. Schweitzer, G. Fagiolo, D. Sornette, F. Vega-Redondo, A. Vespignani and D. R. White, “Economic Networks: The New Challenges,” Science, Vol. 325, No. 5939, 2009, pp. 422-425. [10] J. Farmer and D. Foley, “The Economy Needs Agent- Based Modelling,” Nature, Vol. 460, No. 7256, pp. 685- 686. http://dx.doi.org/10.1038/460685a [11] L. Tesfatsion, “Agent-Based Computational Economics: A Constructive Approach to Economic Theory,” Compu- tational Economics, Vol. 2, No. October 2003, 2006, pp. 831-880. [12] N. Vriend, “ACE Models of Endogenous Interaction,” Handbook of Computational Economics Agent Based Computational Economics, Vol. 2, No. 05, 2006, pp. 1047-1079. [13] G. Fagiolo and G. Dosi, “Exploitation, Exploration and Innovation in a Model of Endogenous Growth with Lo- cally Interacting Agents,” Structural Change and Eco- nomic Dynamics, Vol. 14, No. 3, 2003, pp. 237-273. http://dx.doi.org/10.1016/S0954-349X(03)00022-5 [14] L. Tesfatsion, “Agent-Based Computational Economics: Growing Economies from the Bottom up,” Artificial Life, Vol. 8, No. 1, 2002, pp. 55-82. http://dx.doi.org/10.1162/106454602753694765 [15] J. Canadell, C. Le Quéré, M. Raupach, C. Field, E. Buitenhuis, P. Ciais, T. Conway, N. Gillett, R. Houghton and G. Marland, “Contributions to Accelerating Atmos- pheric CO2 Growth from Economic Activity, Carbon In- tensity and Efficiency of Natural Sinks,” Proceedings of the National Academy of Sciences of the United States of America, Vol. 104, No. 47, 2007, pp. 18866-18870. http://dx.doi.org/10.1073/pnas.0702737104 [16] E. Puliafito and P. Castesana, “Influencia del Crecimiento Económico y Poblacional en el Balance del Ciclo de Car- bono,” Avances en Energías Renovables y Medio Ambi- ente, Vol. 13, 2009, pp. 25-32. [17] M. Raupach, J. Canadell and C. Le Quéré, “Anthropo- genic and Biophysical Contributions to Increasing At- mospheric CO2 Growth Rate and Airborne Fraction,” Bio- geosciences, Vol. 5, No. 6, 2008, pp. 1601-1613. http://dx.doi.org/10.5194/bg-5-1601-2008 [18] Y. Kaya, “Impact of Carbon Dioxide Emission Control on GNP Growth: Interpretation of Proposed Scenarios,” IPCC Response Strategies Working Group Memorandum 1989. IPCC Energy and Industry Subgroup, Response Strategies Working Group, 1990. [19] N. Gürer and J. Ban, “Factors Affecting Energy-Related CO2 Emissions: Past Levels and Present Trends,” OPEC Review Energy Economics Related Issues, Vol. 21, No. 4, 1997, pp. 309-335. [20] G. Cranston and G. Hammond, “Egalité, Fraternité, Sus- tainabilité: Evaluating the Significance of Regional Af- fluence and Population Growth on Carbon Emissions,” International Journal of Global Warming, Vol. 2, No. 3, 2010, pp. 189-210. http://dx.doi.org/10.1504/IJGW.2010.036132 [21] British Petroleum, “British Petroleum Statistical Review of World Energy June 2012, London, United Kingdom,” 2012. www.bp.com/statisticalreview [22] United Nations, “Population Division of the Department of Economic and Social Affairs of the United Nations Secretariat. World Population Prospects: The 2010 Revi- sion,” 2010. www.un.org/esa/population/unpop.htm [23] World Bank, “World Bank database. World Development Indicators (WDI) and Global Development Finance (GDF), Washington (D.C.), USA,”2011. http://databank.worldbank.org/ [24] M. Janssen and B. De Vries, “The Battle of Perspectives: A Multi-Agent Model with Adaptive Responses to Cli- mate Change,” Ecological Economics, Vol. 26, 1998, pp. 43-65. http://dx.doi.org/10.1016/S0921-8009(97)00062-1 [25] R. Barro and X. Sala-i-Martin, “Two-Sector Models of Endogenous Growth (with Special Attention to the Role of Human Capital),” In: R. Barro and X. Sala-i-Martin, Eds., Economic Growth, 2nd Edition, The MIT Press, Cambridge, 2004, pp. 239-284. [26] ENGH, “Encuesta Nacional de Gastos de los Hogares 1996/97. Instituto Nacional de Estadística y Censos, Ar- gentina,” 1997. http://www.indec.gov.ar [27] BLS, “US Bureau of Labor Statistics: Consumer Expen- diture Surveys, Washington (D.C.), USA,” 2012. http://www.bls.gov/cex/csxstnd.htm#top [28] ONS, “Office for National Statistics. Adapted from data from the Office for National Statistics licensed under the Open Government Licence v.1.0., United Kingdom,” 2012. http://www.ons.gov.uk/ons/datasets-and-tables/index.htm l 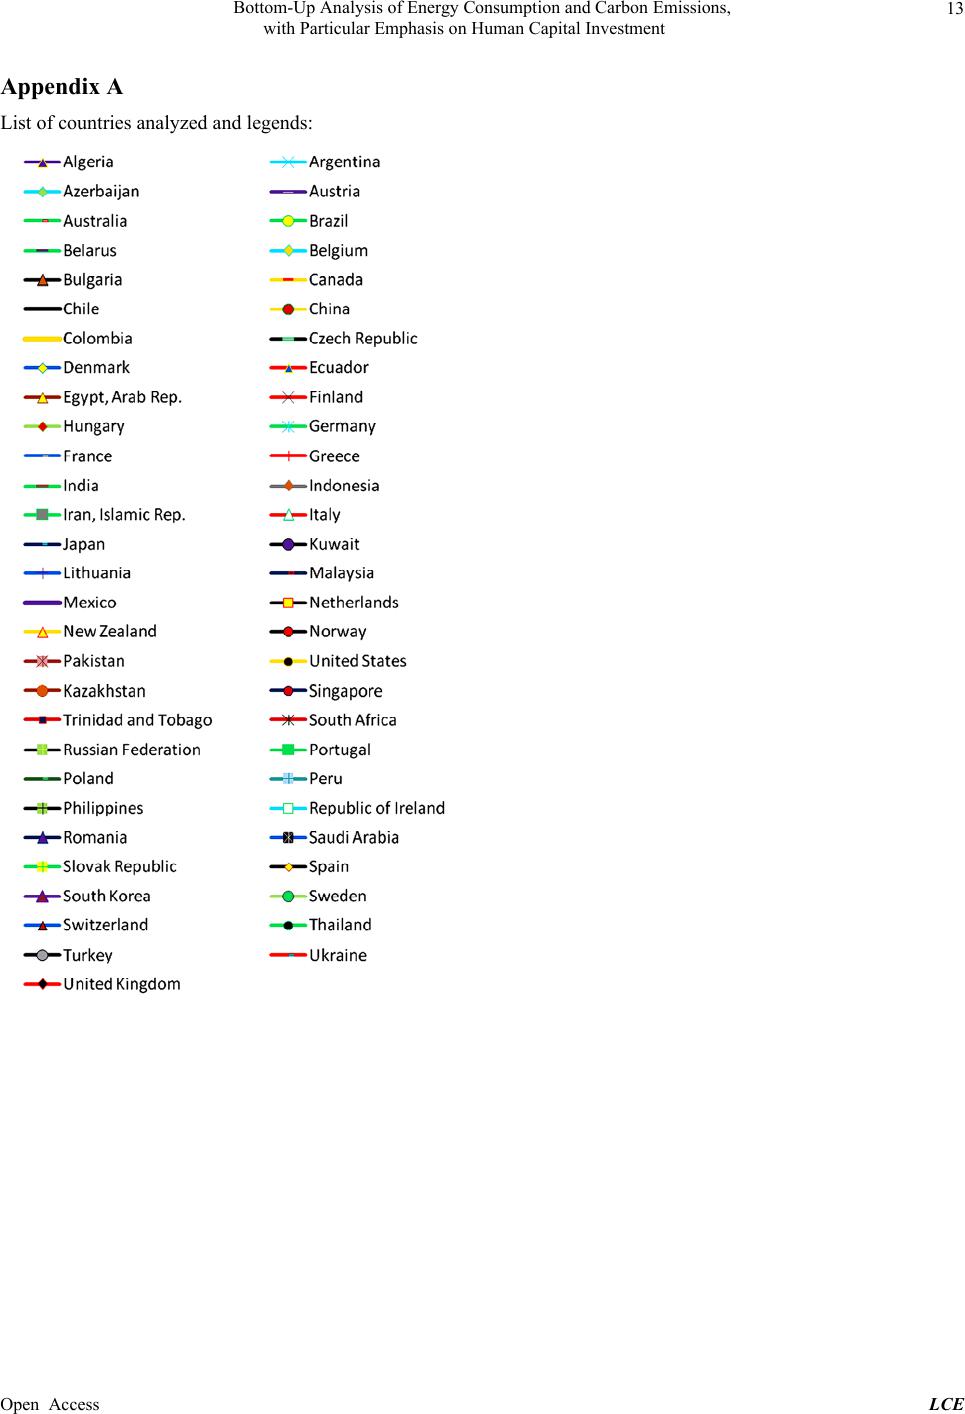 Bottom-Up Analysis of Energy Consumption and Carbon Emissions, with Particular Emphasis on Human Capital Investment 13 Appendix A List of countries analyzed and legends: Open Access LCE
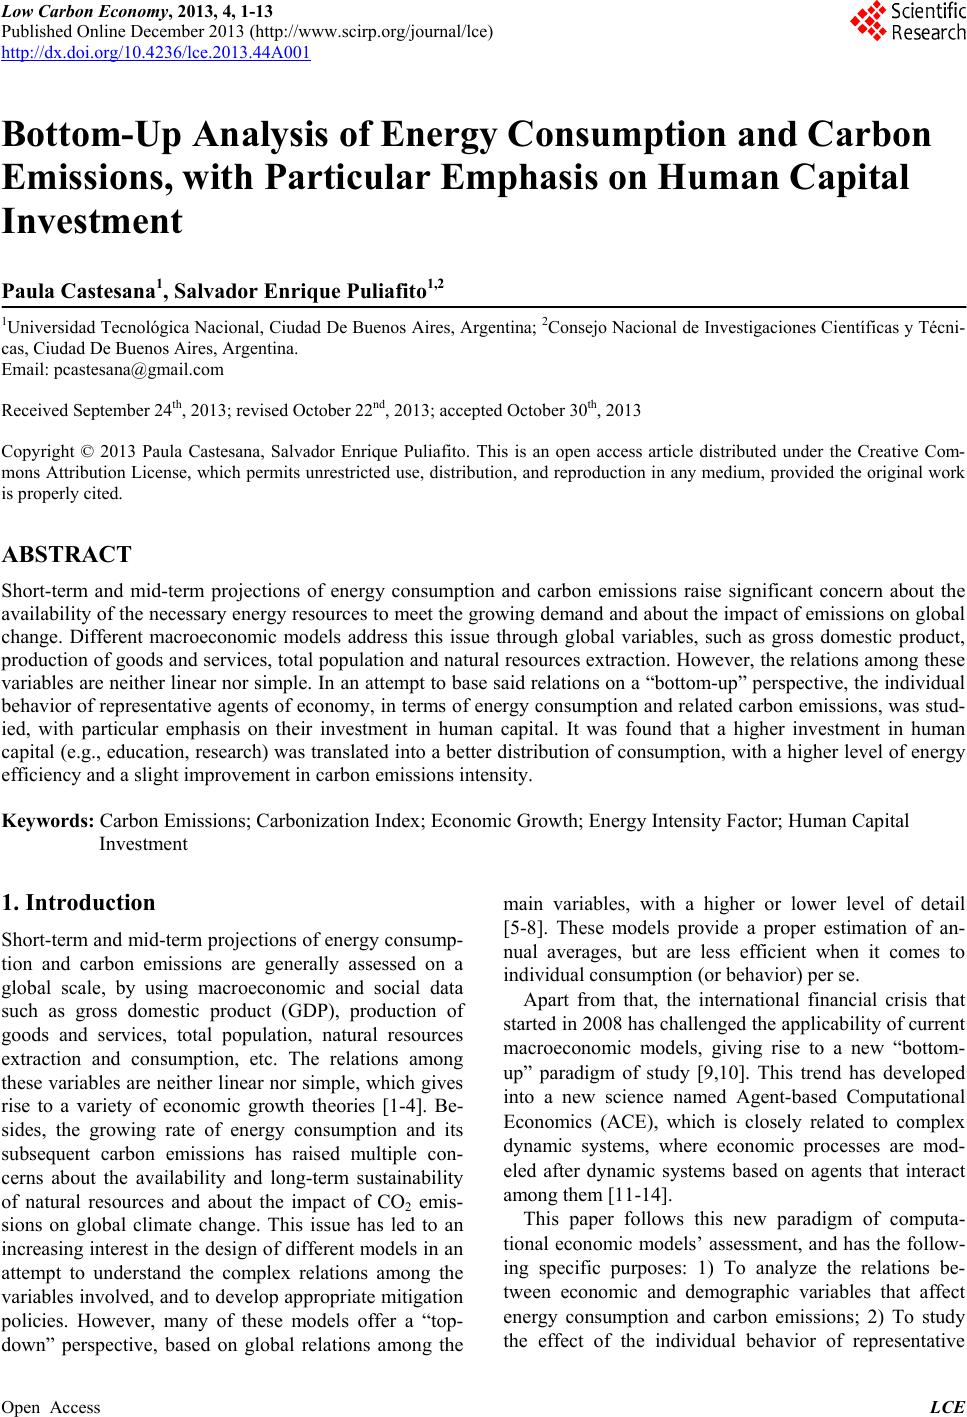
|