 Engineering, 2013, 5, 997-1005 Published Online December 2013 (http://www.scirp.org/journal/eng) http://dx.doi.org/10.4236/eng.2013.512121 Open Access ENG Analysis of the C aus e for the Collapse of a Temporary Bridge Using Numerical Simulation Changsung Kim, Jongtae Kim, Joongu Kang Water Resource Research Department, Korea Institute of Construction Technology, Goyang, Korea Email: csckim@kict.re.kr Received October 1, 2013; revised November 1, 2013; accepted November 8, 2013 Copyright © 2013 Changsung Kim et al. This is an open access article distributed under the Creative Commons Attribution License, which permits unrestricted use, distribution, and reproduction in any medium, provided the original work is properly cited. ABSTRACT The purpose of this study was to suggest the measures and methods for securing the stability of temporary bridges by analyzing the caus e for the collapse of the tempor ary bridge built for the constru ction of the GunNam flo od control res- ervoir located at the main channel of the Im-Jin River. Numerical simulations (one-, two-, and three-dimensional) were performed by collecting field data, and the results showed that the collapse occurred because the height of the tempo- rary bridge was lower than the water level at the time of the co llapse. Also, the drag force calculatio n show ed that when the guardrail installed on the upper deck structure was not considered, there was no problem as the calculated values were lower than the design load, whereas when the guard rail was considered, the stability was not secured as the calcu- lated values were higher than the design load, 37.73 kN/m. It is thought that the actual force of the water flow applied on the bridge increased due to the accumulation of debris on the guardrail as well as the upper deck. Keywords: Flood Control Reservoir; Temporary Bridge; Numerical Simulation; Drag Force 1. Introduction Due to the seasonal characteristics, most precipitation occurs during the summer season in Korea, and concen- trated heavy rain during summer from typhoon, etc., brings about diverse damage such as landslides, destruc- tion of structures from floods, and flooded roads. Also, these problems are not local phenomena, and could occur in any part of the country. Recently, the damage of hy- draulic structures including bridges has increased be- cause of climate change, etc. Due to the fact that the con- centrated heavy rain started from August 4, 2002 and Typhoon Rusa, 83 bridges and 504 small bridges were damaged during a week all over Korea. Also, in 2006, due to Typhoon Ewiniar, 261 bridges were damaged all ov er the country (NIDP [1], Yoon [2], Woo and Park [3 ]) . A bridge refers to a structure that is built on a river, and it should have stability against disasters in order to fulfill its function. A bridge built on a river could cause flood disasters such as river inundation by reducing the water flow communication capability of the river channel, and secondary damage could occur due to the loss or destruc- tion of the bridge (Lee [4]). Thus, domestic design crite- ria emphasize the compliance with the design criteria to secure stability during floods. Howev er, the collapse of a bridge could occur if there are many piers or if the height of the bridge upper deck is lower than the levee height. Studies using field experiments are currently in pro- gress throughout the world to minimize bridge damage, and especially, the Federal Highway Administration [5,6] suggested various coefficients based on a lot of experi- ments. In Korea, many studies on the analysis of the ef- fect of water level increase on bridge structures have been conducted by using experiments and numerical ana- lysis, and techniques appropriate for domestic circum- stances have been developed (Choi, Yoon and Cho [7], Lee, Jung, Kim and Lee [8], Kim [9]). However, for temporary bridges that are temporarily built for the con- struction of large structures, design criteria and relevant studies are scarce due to the nature of the structure, and conservative design that secures stability is generally not available as they are temporary structures. Also, a num- ber of studies on the materials and construction methods of temporary bridges have been performed, but studies on the stability analysis considering scour and flood wa- ter level are insufficient. Especially, as the demand for temporary bridges is increasing due to the recent new road construction and the existing road expansion work, it is essential to secure stab ility against the flow of water (Kim [10], Joo, Lee, Lee and Yoon [11]). 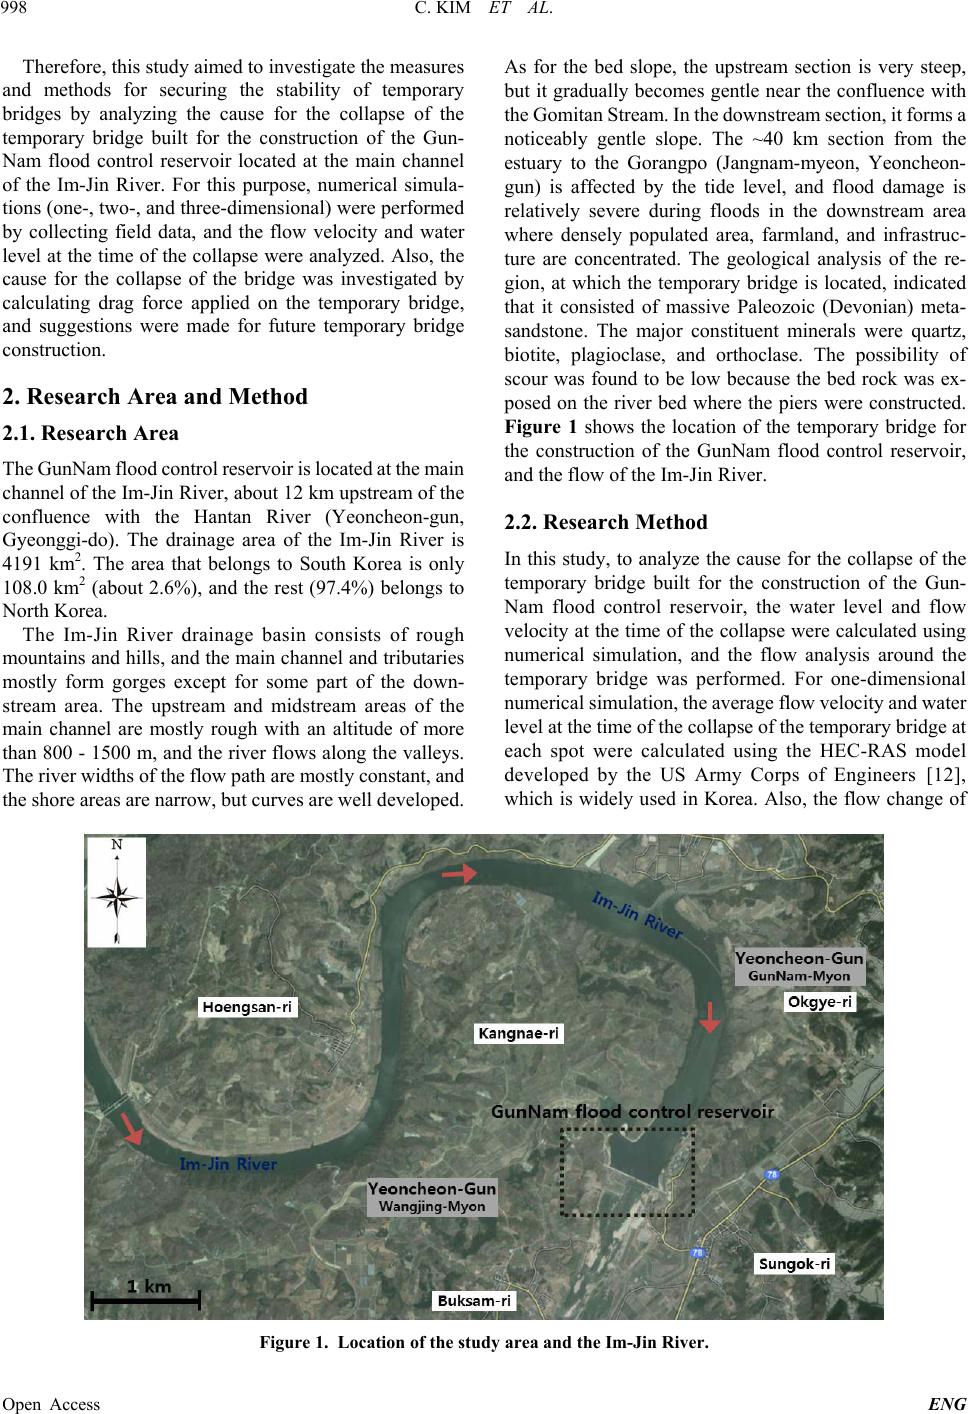 C. KIM ET AL. 998 Therefore, this study aimed to investigate the measures and methods for securing the stability of temporary bridges by analyzing the cause for the collapse of the temporary bridge built for the construction of the Gun- Nam flood control reservoir located at the main channel of the Im-Jin River. For this purpose, numerical simula- tions (one-, two-, and three-dimensional) were performed by collecting field data, and the flow velocity and water level at the time of the collapse were analyzed. Also, the cause for the collapse of the bridge was investigated by calculating drag force applied on the temporary bridge, and suggestions were made for future temporary bridge construction. 2. Research Area and Method 2.1. Research Area The GunNam flood control reservoir is located at the main channel of the Im-Jin River, about 12 km upstream of the confluence with the Hantan River (Yeoncheon-gun, Gyeonggi-do). The drainage area of the Im-Jin River is 4191 km2. The area that belongs to South Korea is only 108.0 km2 (about 2.6%), and the rest (97.4%) belongs to North Korea. The Im-Jin River drainage basin consists of rough mountains and hills, and the main channel and tributaries mostly form gorges except for some part of the down- stream area. The upstream and midstream areas of the main channel are mostly rough with an altitude of more than 800 - 1500 m, and th e river flows along the valleys. The river widt hs of t he fl ow path are m ostly const ant, a nd the shore areas are narrow, but curves are we ll developed. As for the bed slope, the upstream section is very steep, but it gradually becomes gentle near the confluence with the Gomitan Stream. In the downstream section, it form s a noticeably gentle slope. The ~40 km section from the estuary to the Gorangpo (Jangnam-myeon, Yeoncheon- gun) is affected by the tide level, and flood damage is relatively severe during floods in the downstream area where densely populated area, farmland, and infrastruc- ture are concentrated. The geological analysis of the re- gion, at which the temporary bridge is located, indicated that it consisted of massive Paleozoic (Devonian) meta- sandstone. The major constituent minerals were quartz, biotite, plagioclase, and orthoclase. The possibility of scour was found to be low because the bed rock was ex- posed on the river bed where the piers were constructed. Figure 1 shows the location of the temporary bridge for the construction of the GunNam flood control reservoir, and the flow of the Im -Jin River. 2.2. Research Method In this study, to analyze the cause for the collapse of the temporary bridge built for the construction of the Gun- Nam flood control reservoir, the water level and flow velocity at the time of th e collapse were calculated using numerical simulation, and the flow analysis around the temporary bridge was performed. For one-dimensional numerical sim ulation, t he ave rage flow velocit y and water level at the time of the collapse of the temporary bridge at each spot were calculated using the HEC-RAS model developed by the US Army Corps of Engineers [12], which is widely used in Korea. Also, the flow change of Figure 1. Location of the study area and the Im-Jin River. Open Access ENG 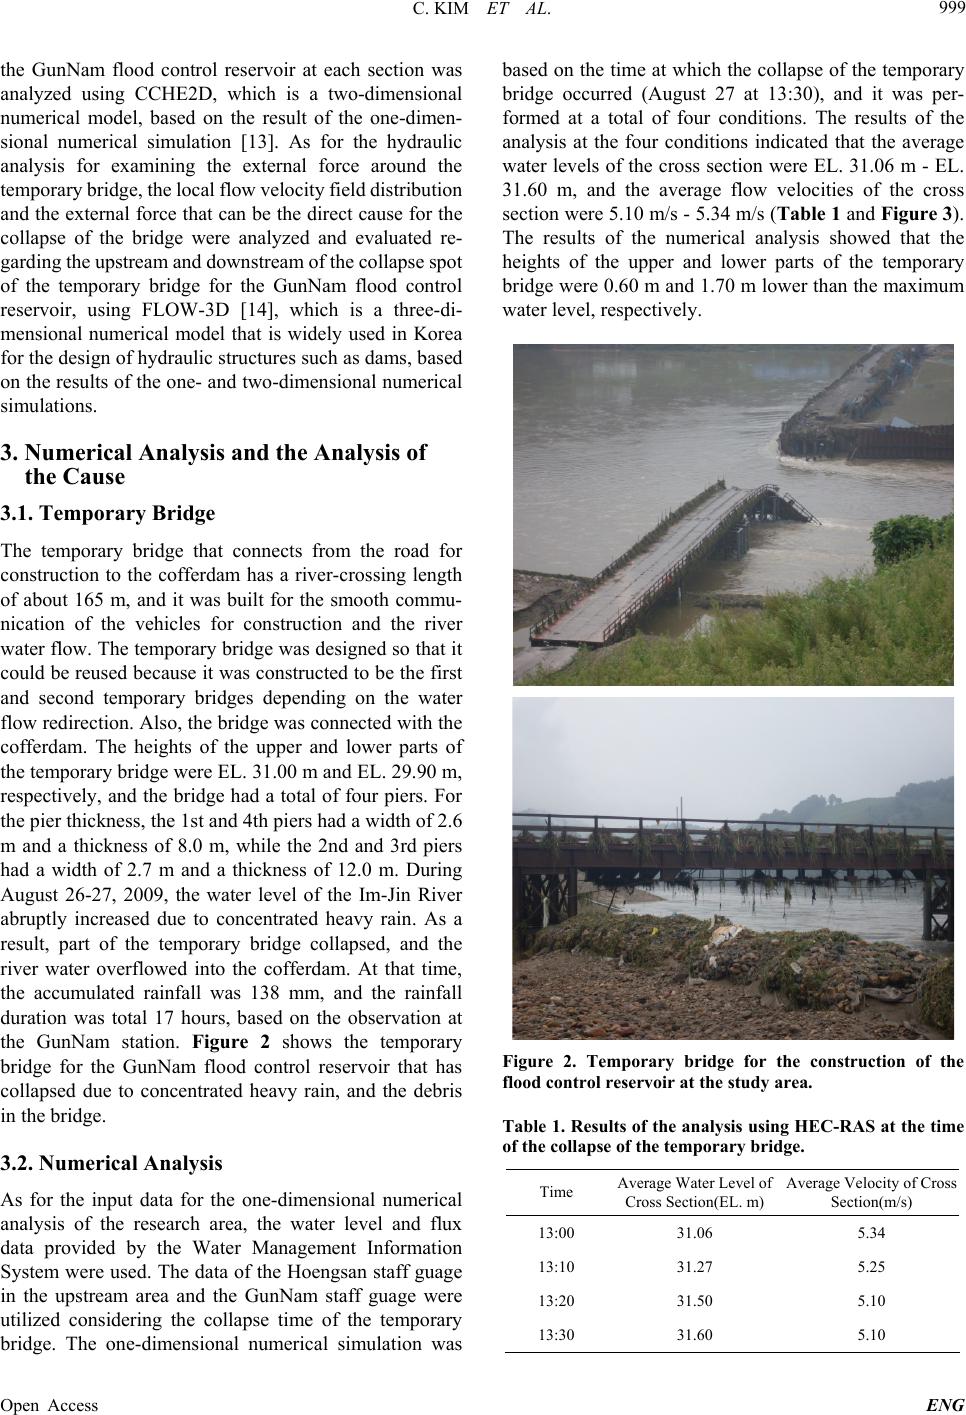 C. KIM ET AL. 999 the GunNam flood control reservoir at each section was analyzed using CCHE2D, which is a two-dimensional numerical model, based on the result of the one-dimen- sional numerical simulation [13]. As for the hydraulic analysis for examining the external force around the temporary bri dge, the local fl ow velocity field di stribution and the external force that can be the direct cause for the collapse of the bridge were analyzed and evaluated re- garding the u pstream and downstream of the collapse spot of the temporary bridge for the GunNam flood control reservoir, using FLOW-3D [14], which is a three-di- mensional numerical model that is widely used in Korea for the design of hydraulic structures such as dams, based on the results of the one- and two-dimensional numerical simulations. 3. Numerical Analysis and the Analysis of the Cause 3.1. Temporary Bridge The temporary bridge that connects from the road for construction to the cofferdam has a river-crossing length of about 165 m, and it was built for the smooth commu- nication of the vehicles for construction and the river water flow. The temporary bridge was designed so that it could be reused because it was constructed to be the first and second temporary bridges depending on the water flow redirection. Also, the bridge was connected with the cofferdam. The heights of the upper and lower parts of the temporary bridge were EL. 31.00 m and EL. 29.90 m, respectively, and the bridge had a total of fo ur piers. For the pier thickness, the 1st and 4th piers had a width of 2.6 m and a thickness of 8.0 m, while the 2nd and 3rd piers had a width of 2.7 m and a thickness of 12.0 m. During August 26-27, 2009, the water level of the Im-Jin River abruptly increased due to concentrated heavy rain. As a result, part of the temporary bridge collapsed, and the river water overflowed into the cofferdam. At that time, the accumulated rainfall was 138 mm, and the rainfall duration was total 17 hours, based on the observation at the GunNam station. Figure 2 shows the temporary bridge for the GunNam flood control reservoir that has collapsed due to concentrated heavy rain, and the debris in the bridge. 3.2. Numerical Analysis As for the input data for the one-dimensional numerical analysis of the research area, the water level and flux data provided by the Water Management Information System were used. The data of the Hoengsan staff guage in the upstream area and the GunNam staff guage were utilized considering the collapse time of the temporary bridge. The one-dimensional numerical simulation was based on the time at which the collapse of the temporary bridge occurred (August 27 at 13:30), and it was per- formed at a total of four conditions. The results of the analysis at the four conditions indicated that the average water levels of the cross section were EL. 31.06 m - EL. 31.60 m, and the average flow velocities of the cross section were 5.10 m/s - 5.34 m/s (Table 1 and Figure 3). The results of the numerical analysis showed that the heights of the upper and lower parts of the temporary bridge were 0.60 m and 1.70 m lower than the maximum water level, respectively. Figure 2. Temporary bridge for the construction of the flood control reservoir at the study area. Table 1. Results of the analysis using HEC-RAS at the time of the collapse of the temporary bridge. Time Average Water Level of Cross Section(EL. m) Average Velocityof Cross Section(m/s) 13:00 31.06 5.34 13:10 31.27 5.25 13:20 31.50 5.10 13:30 31.60 5.10 Open Access ENG  C. KIM ET AL. 1000 13:00 13:10 13:20 13:30 Figure 3. Water-level of the temporary bridge. Open Access ENG 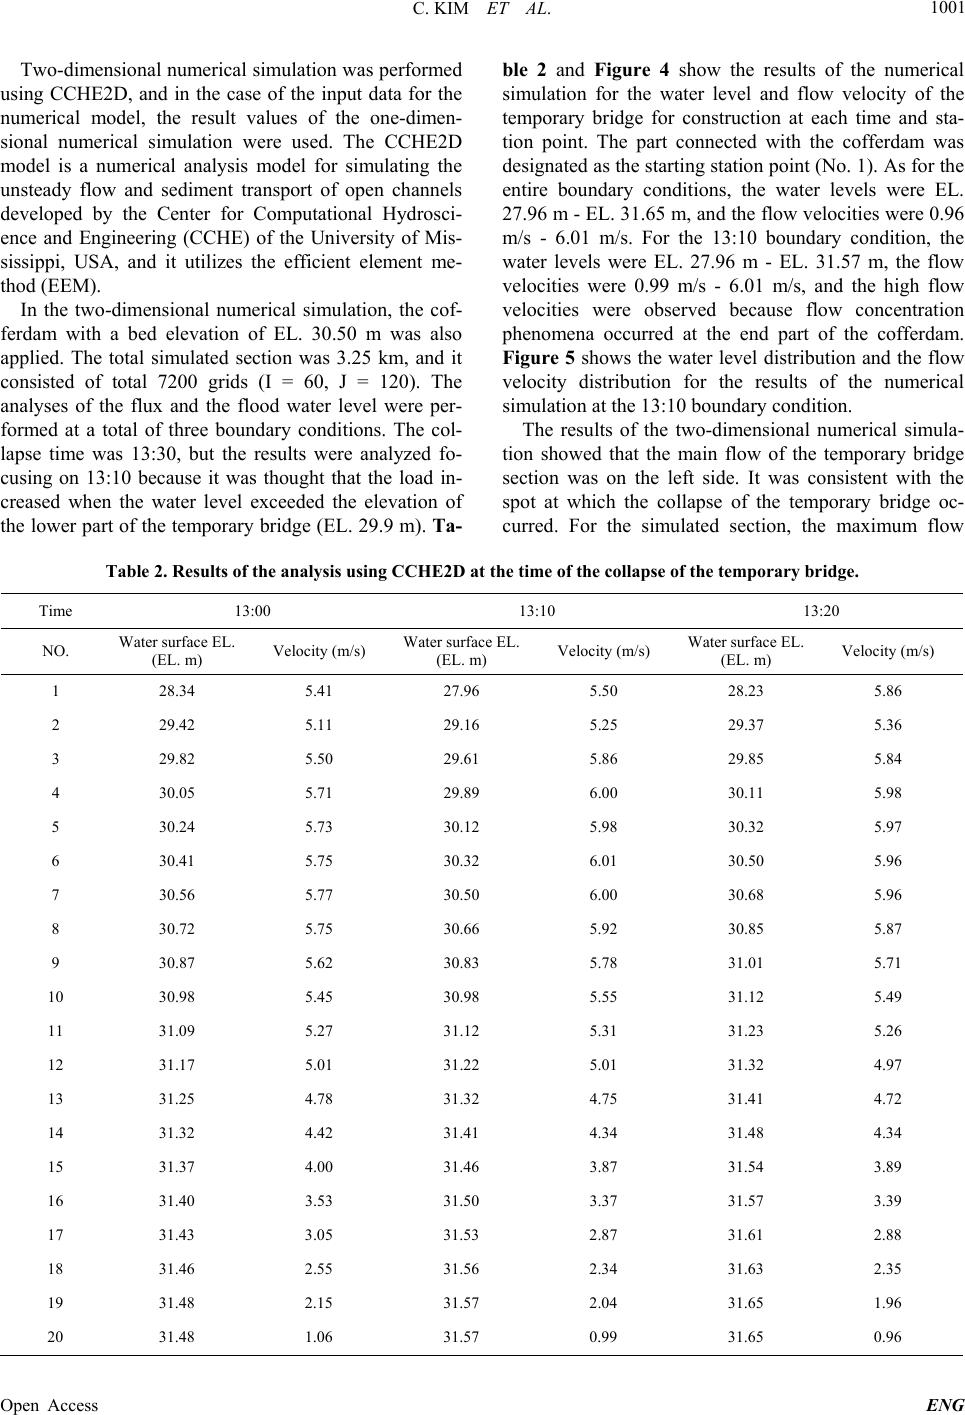 C. KIM ET AL. 1001 Two-dimensional numerical simulation was performed using CCHE2D, and in the case of the input data for the numerical model, the result values of the one-dimen- sional numerical simulation were used. The CCHE2D model is a numerical analysis model for simulating the unsteady flow and sediment transport of open channels developed by the Center for Computational Hydrosci- ence and Engineering (CCHE) of the University of Mis- sissippi, USA, and it utilizes the efficient element me- thod (EEM). In the two-dimensional numerical simulation, the cof- ferdam with a bed elevation of EL. 30.50 m was also applied. The total simulated section was 3.25 km, and it consisted of total 7200 grids (I = 60, J = 120). The analyses of the flux and the flood water level were per- formed at a total of three boundary conditions. The col- lapse time was 13:30, but the results were analyzed fo- cusing on 13:10 because it was thought that the load in- creased when the water level exceeded the elevation of the lower part of the temporary bridge (EL. 29.9 m). Ta- ble 2 and Figure 4 show the results of the numerical simulation for the water level and flow velocity of the temporary bridge for construction at each time and sta- tion point. The part connected with the cofferdam was designated as the starting station point (No. 1). As for the entire boundary conditions, the water levels were EL. 27.96 m - EL. 31.65 m, and the flow velocities were 0.96 m/s - 6.01 m/s. For the 13:10 boundary condition, the water levels were EL. 27.96 m - EL. 31.57 m, the flow velocities were 0.99 m/s - 6.01 m/s, and the high flow velocities were observed because flow concentration phenomena occurred at the end part of the cofferdam. Figure 5 shows the water level distribution and the flow velocity distribution for the results of the numerical simulation at the 13:10 bound ary condition. The results of the two-dimensional numerical simula- tion showed that the main flow of the temporary bridge section was on the left side. It was consistent with the spot at which the collapse of the temporary bridge oc- curred. For the simulated section, the maximum flow Table 2. Results of the analysis using CCHE2D at the time of the collapse of the temporary bridge. Time 13:00 13:10 13:20 NO. Water surface EL. (EL. m) Velocity (m/s) Water surface EL. (EL. m) Velocity (m/s) Water surface EL. (EL. m) Velocity (m/s) 1 28.34 5.41 27.96 5.50 28.23 5.86 2 29.42 5.11 29.16 5.25 29.37 5.36 3 29.82 5.50 29.61 5.86 29.85 5.84 4 30.05 5.71 29.89 6.00 30.11 5.98 5 30.24 5.73 30.12 5.98 30.32 5.97 6 30.41 5.75 30.32 6.01 30.50 5.96 7 30.56 5.77 30.50 6.00 30.68 5.96 8 30.72 5.75 30.66 5.92 30.85 5.87 9 30.87 5.62 30.83 5.78 31.01 5.71 10 30.98 5.45 30.98 5.55 31.12 5.49 11 31.09 5.27 31.12 5.31 31.23 5.26 12 31.17 5.01 31.22 5.01 31.32 4.97 13 31.25 4.78 31.32 4.75 31.41 4.72 14 31.32 4.42 31.41 4.34 31.48 4.34 15 31.37 4.00 31.46 3.87 31.54 3.89 16 31.40 3.53 31.50 3.37 31.57 3.39 17 31.43 3.05 31.53 2.87 31.61 2.88 18 31.46 2.55 31.56 2.34 31.63 2.35 19 31.48 2.15 31.57 2.04 31.65 1.96 20 31.48 1.06 31.57 0.99 31.65 0.96 Open Access ENG 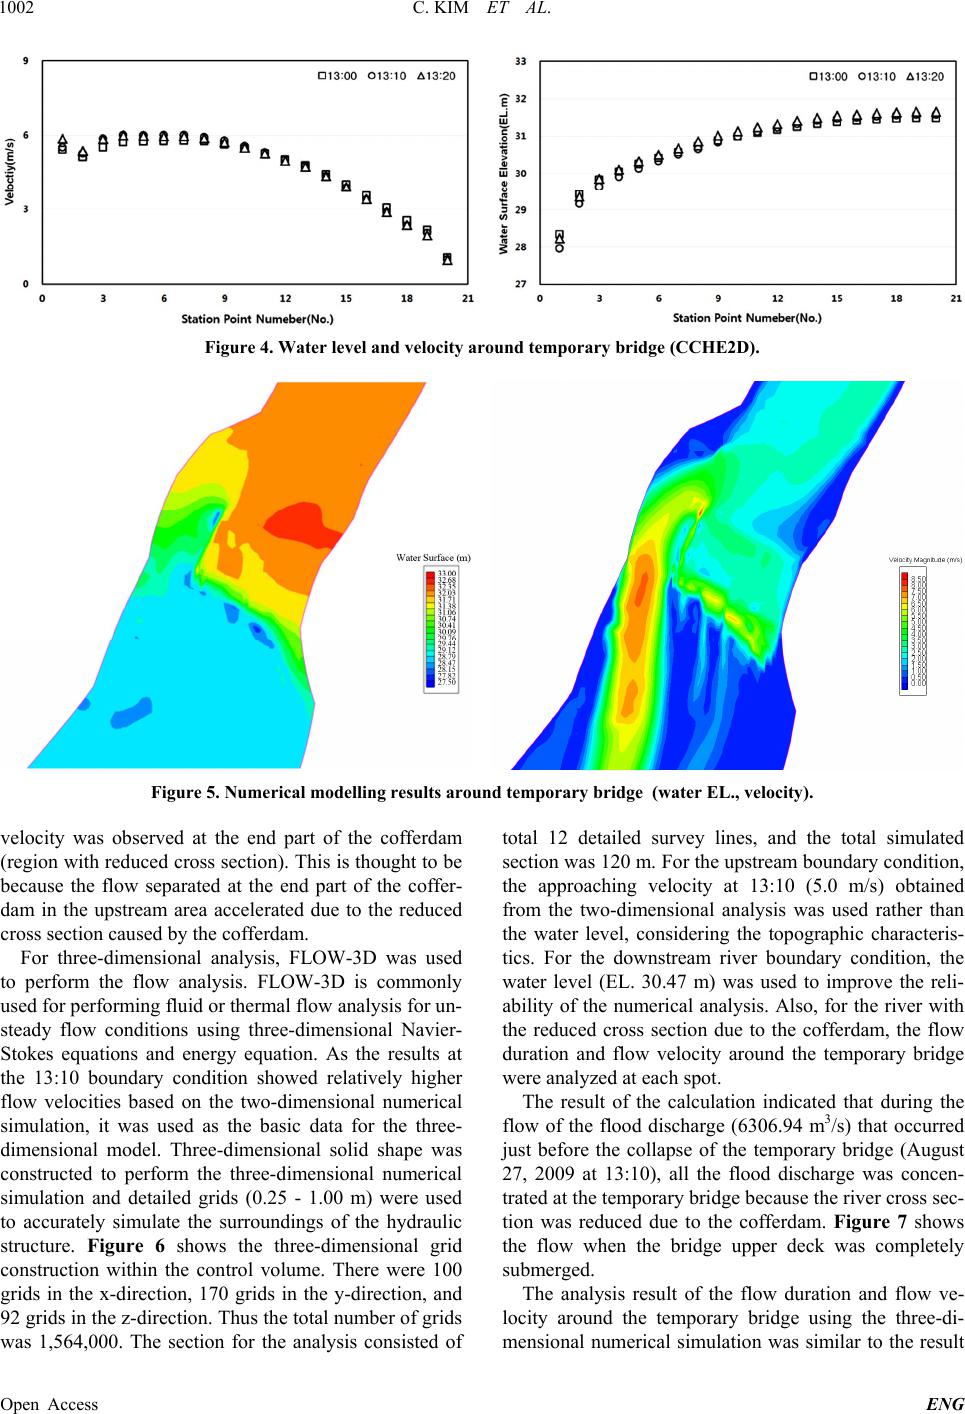 C. KIM ET AL. 1002 Figure 4. Water level and velocity around te mpor ary bridge (CCHE2D). Figure 5. Numerical modelling results around tempor ary bridge (water EL., veloci ty). velocity was observed at the end part of the cofferdam (region with reduced cro ss section). This is thought to be because the flow separated at the end part of the coffer- dam in the upstream area accelerated due to the reduced cross section caused by the cofferdam. For three-dimensional analysis, FLOW-3D was used to perform the flow analysis. FLOW-3D is commonly used for performing fluid or thermal flow analysis for un- steady flow conditions using three-dimensional Navier- Stokes equations and energy equation. As the results at the 13:10 boundary condition showed relatively higher flow velocities based on the two-dimensional numerical simulation, it was used as the basic data for the three- dimensional model. Three-dimensional solid shape was constructed to perform the three-dimensional numerical simulation and detailed grids (0.25 - 1.00 m) were used to accurately simulate the surroundings of the hydraulic structure. Figure 6 shows the three-dimensional grid construction within the control volume. There were 100 grids in the x-direction, 170 grids in the y-direction, and 92 grids in the z-direction. Thus the to tal number of grids was 1,564,000. The section for the analysis consisted of total 12 detailed survey lines, and the total simulated section was 120 m. For the upstream boundary conditio n, the approaching velocity at 13:10 (5.0 m/s) obtained from the two-dimensional analysis was used rather than the water level, considering the topographic characteris- tics. For the downstream river boundary condition, the water level (EL. 30.47 m) was used to improve the reli- ability of the numerical analysis. Also, for the river with the reduced cross section due to the cofferdam, the flow duration and flow velocity around the temporary bridge were analyzed at each spot. The result of the calculation indicated that during the flow of the flood discharge (6306.94 m3/s) that occurred just before the collapse of the temporary bridge (August 27, 2009 at 13:10), all the flood discharge was concen- trated at the temporary bridge because the river cross sec- tion was reduced due to the cofferdam. Figure 7 shows the flow when the bridge upper deck was completely submerged. The analysis result of the flow duration and flow ve- locity around the temporary bridge using the three-di- mensional numerical simulation was similar to the result Open Access ENG 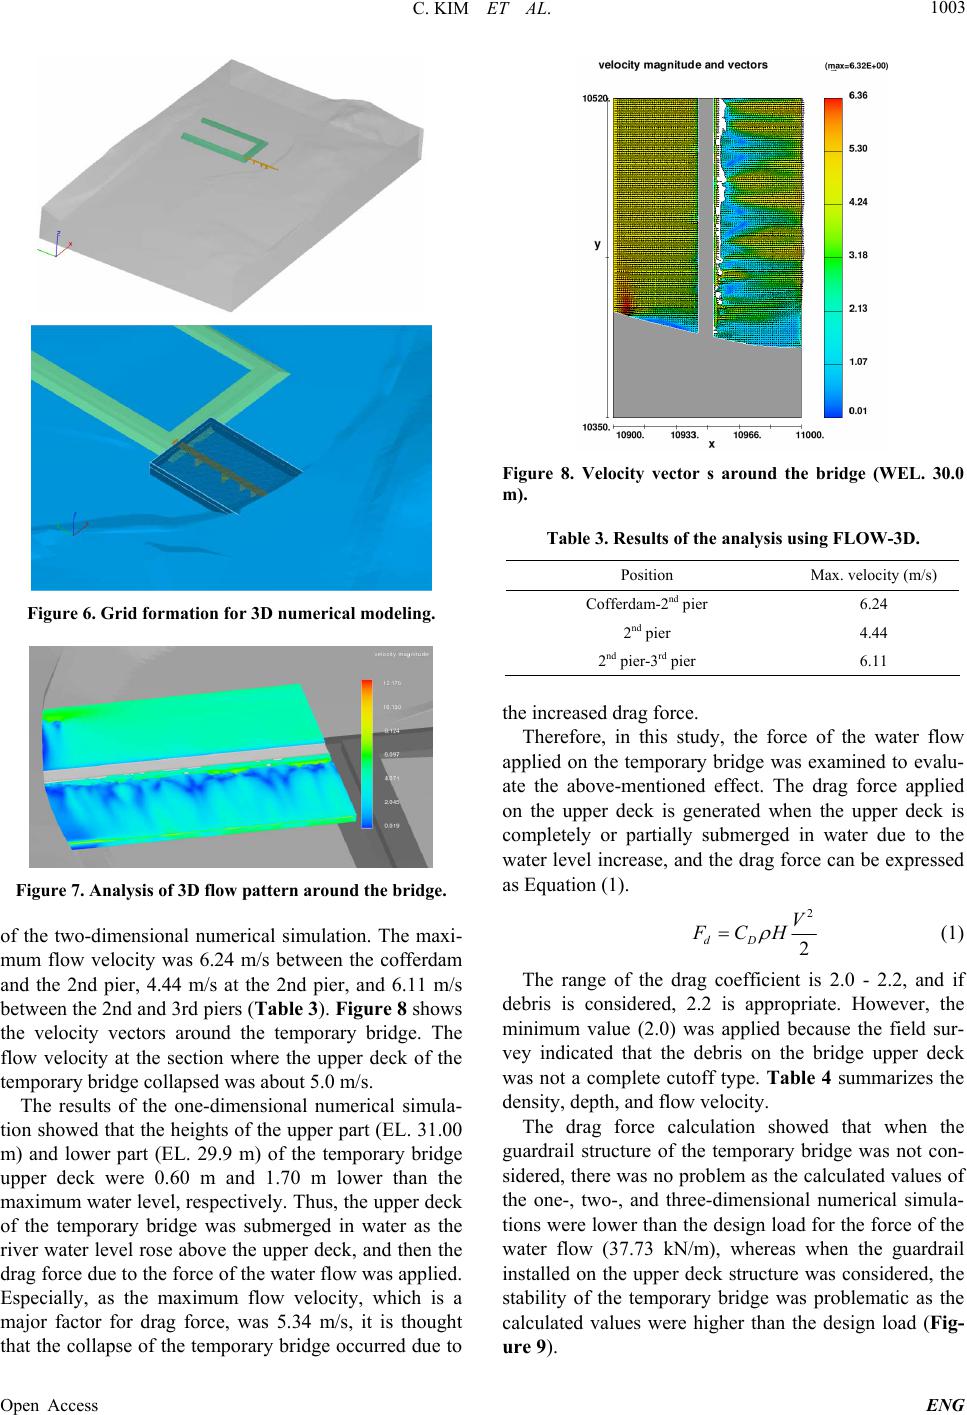 C. KIM ET AL. 1003 Figure 6. Grid formation for 3D numerical modeling. Figure 7. Analysis of 3D flow pattern around the br idge . of the two-dimensional numerical simulation. The maxi- mum flow velocity was 6.24 m/s between the cofferdam and the 2nd pier, 4.44 m/s at the 2nd pier, and 6.11 m/s between the 2nd and 3rd piers (Table 3). Figure 8 shows the velocity vectors around the temporary bridge. The flow velocity at the section where the upper deck of the temporary bridge collapsed was about 5.0 m/s. The results of the one-dimensional numerical simula- tion showed that the heights of the upper part ( EL. 31.00 m) and lower part (EL. 29.9 m) of the temporary bridge upper deck were 0.60 m and 1.70 m lower than the maximum water level, respectively. Thus, the upper deck of the temporary bridge was submerged in water as the river water level rose above the upper deck, and then the drag force due to the force of the water flow was applied. Especially, as the maximum flow velocity, which is a major factor for drag force, was 5.34 m/s, it is thought that the collapse of the temporary br idge occurred due to Figure 8. Velocity vector s around the bridge (WEL. 30.0 m). Table 3. Results of the analysis using FLOW-3D. Position Max. velocity (m/s) Cofferdam-2nd pier 6.24 2nd pier 4.44 2nd pier-3rd pier 6.11 the increased drag force. Therefore, in this study, the force of the water flow applied on the temporary bridge was examined to evalu- ate the above-mentioned effect. The drag force applied on the upper deck is generated when the upper deck is completely or partially submerged in water due to the water level increase, and the drag force can be expressed as Equation (1). 2 2 dD V FCH (1) The range of the drag coefficient is 2.0 - 2.2, and if debris is considered, 2.2 is appropriate. However, the minimum value (2.0) was applied because the field sur- vey indicated that the debris on the bridge upper deck was not a complete cutoff type. Table 4 summarizes the density, depth, and flow velocity. The drag force calculation showed that when the guardrail structure of the temporary bridge was not con- sidered, there was no problem as the calculated values of the one-, two-, and three-dimensional numerical simula- tions were lower than the design load for the force of the water flow (37.73 kN/m), whereas when the guardrail installed on the upper deck structure was considered, the stability of the temporary bridge was problematic as the calculated values were higher than the design load (Fig- ure 9). Open Access ENG 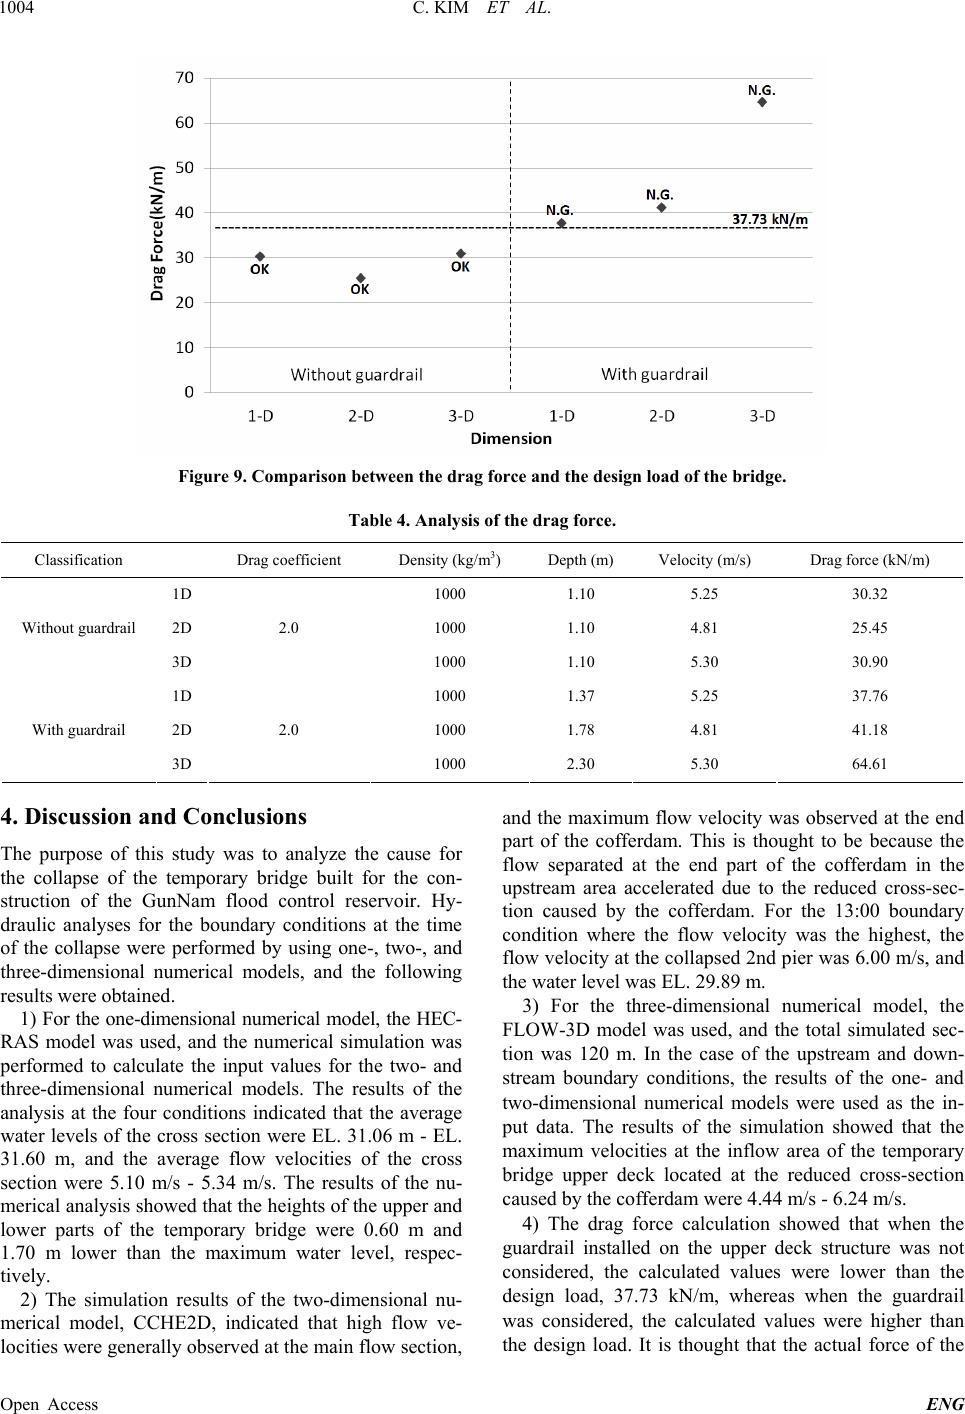 C. KIM ET AL. Open Access ENG 1004 Figure 9. Comparison between the drag force and the design load of the bridge. Table 4. Analysis of the drag force. Classification Drag coefficient Density (kg/m3) Depth (m) Velocity (m/s) Drag force (kN/m) 1D 1000 1.10 5.25 30.32 2D 1000 1.10 4.81 25.45 Without guardrai l 3D 2.0 1000 1.10 5.30 30.90 1D 1000 1.37 5.25 37.76 2D 1000 1.78 4.81 41.18 With guardrail 3D 2.0 1000 2.30 5.30 64.61 4. Discussion and Conclusions The purpose of this study was to analyze the cause for the collapse of the temporary bridge built for the con- struction of the GunNam flood control reservoir. Hy- draulic analyses for the boundary conditions at the time of the collapse were performed by using one-, two-, and three-dimensional numerical models, and the following results were obt aine d. 1) For the one-dimensional numerical model, the HEC- RAS model was used, and the numerical simulation was performed to calculate the input values for the two- and three-dimensional numerical models. The results of the analysis at the four conditions indicated that the average water levels of the cross section were EL. 31.06 m - EL. 31.60 m, and the average flow velocities of the cross section were 5.10 m/s - 5.34 m/s. The results of the nu- merical analysis showed that the heights of the upper and lower parts of the temporary bridge were 0.60 m and 1.70 m lower than the maximum water level, respec- tively. 2) The simulation results of the two-dimensional nu- merical model, CCHE2D, indicated that high flow ve- locities were generally observed at the main flow section, and the maximum flow velocity was observed at the end part of the cofferdam. This is thought to be because the flow separated at the end part of the cofferdam in the upstream area accelerated due to the reduced cross-sec- tion caused by the cofferdam. For the 13:00 boundary condition where the flow velocity was the highest, the flow velocity at the collapsed 2nd pier was 6.00 m/s, and the water level was EL. 29.89 m. 3) For the three-dimensional numerical model, the FLOW-3D model was used, and the total simulated sec- tion was 120 m. In the case of the upstream and down- stream boundary conditions, the results of the one- and two-dimensional numerical models were used as the in- put data. The results of the simulation showed that the maximum velocities at the inflow area of the temporary bridge upper deck located at the reduced cross-section caused by the cofferdam were 4.44 m/s - 6.24 m/s. 4) The drag force calculation showed that when the guardrail installed on the upper deck structure was not considered, the calculated values were lower than the design load, 37.73 kN/m, whereas when the guardrail was considered, the calculated values were higher than the design load. It is thought that the actual force of the  C. KIM ET AL. 1005 water flow applied on the bridge increased due to the accumulation of debris on the guardrail as well as the upper deck . 5) It is thought that the temporary bridge built for the construction of the GunNam flood control reservoir col- lapsed due to the increased drag force applied on the bridge because the water level was higher than the ex- pected water level based on the design frequency. For temporary bridges, the selection of a uniform de- sign frequency for securing stability is a difficult task. However, it is required to determine a safe design fre- quency considering the importance of structures and the prediction of the damage on the surrounding area. Also, it is necessary to evaluate the region where the effect of debris is expected to be large. 5. Acknowledgements This research was supported by the Internal Research Project (2013) of the Korea Institute of Construction Technology. REFERENCES [1] National Institute for Disaster Prevention, “The Field Survey Report of Damages Caused by the Floods in 2002,” NIDP-2002-01, 2002, pp. 9-30. [2] K. Y. Yoon, “Damage Analysis of Bridges Due to a Heavy Rain,” The Journal of the Research Institute for Industrial Technology, Vol. 7, No. 1, 2002, pp. 137-141. [3] J. T. Woo, and B. C. Park, “A Case Study of Bridge Damages Due to the Heavy Rain,” Journal of the Korea Institute for Structural Maintenance Inspection, Vol. 11, No. 5, 2007, pp. 37-43. [4] W. S. Lee, “The Analysis on Factors of Damages Caused by the Floods for Bridges,” M.S. Dissertation, University of Seonam, 2008, pp. 1-13. [5] Federal Highways Administration, “Stream Stability at Highway Structures,” Report No. FHWA-IP-90-014, Hy- draulic Engineering Circular 20, 1991. [6] Federal Highways Administration, “Hydrodynamic Forces on Inundated Bridge Decks,” Report No. FHWA-HRT- 09-028, 2009. [7] G. W. Choi, Y. J. Yoon and J. B. Cho, “The Variation of Hydraulic Characteristics Depending upon Removal of the Hydraulic Structures near the Junction between Nam Han and Pyeong Chang Rivers,” Journal of Korea Water Resources Association, V o l . 38, N o. 8 , 2 0 05, pp. 675-689. http://dx.doi.org/10.3741/JKWRA.2005.38.8.675 [8] J. S. Lee, J. H. Jung, S. J. Kim and H. Y. Lee, “A Study on the Effect of Backwater Due to Bridge and Culvert in the Stream,” NIDP-ER-2006-08, National Institute for Disaster Prevention, 2006, pp. 5-13. [9] C. W. Kim, “Structural Characteristics on the Behavior of Temporary Bridge Using Continuous Cross Beam,” Ph.D. Thesis, University of Hongik, 2012, pp. 18-30. [10] D. W. Kim, “Estimation of Structural Behavior of the Long Span Temporary Bridge Superstructure Stiffened by Composite Double H-Beam,” M.S. Dissertation, Univer- sity of Chungju, 2012, pp. 1-6. [11] H. J. Joo, Y. G. Lee, D. H. Lee and S. J. Yoon, “The Characteristics of Structural Behavior of Temporary Bridge Using Continuous Cross Beam,” Journal of Korea Society of Steel Construction, Vol. 24, No. 5, 2012, pp. 559-569. http://dx.doi.org/10.7781/kjoss.2012.24.5.559 [12] W. B. Gary, “HEC-RAS River Analysis System User’s Manual Ver. 4.1,” Report No. CPD-68, Hydrologic En- gineering Center, US Army Corps of Engineers, 2010. [13] Y. X. Zhang, “CCHE2D-GUI-Graphic User Interface for the CCHE2D Model User’s Manual-Ver.2.2,” Technical Report No. NCCHE-TR-2005-03, National Center for Computational Hydroscience and Engineering, 2005. [14] Flow Science, “FLOW-3D User’s Manual,” Los Alamos, 2003. Open Access ENG
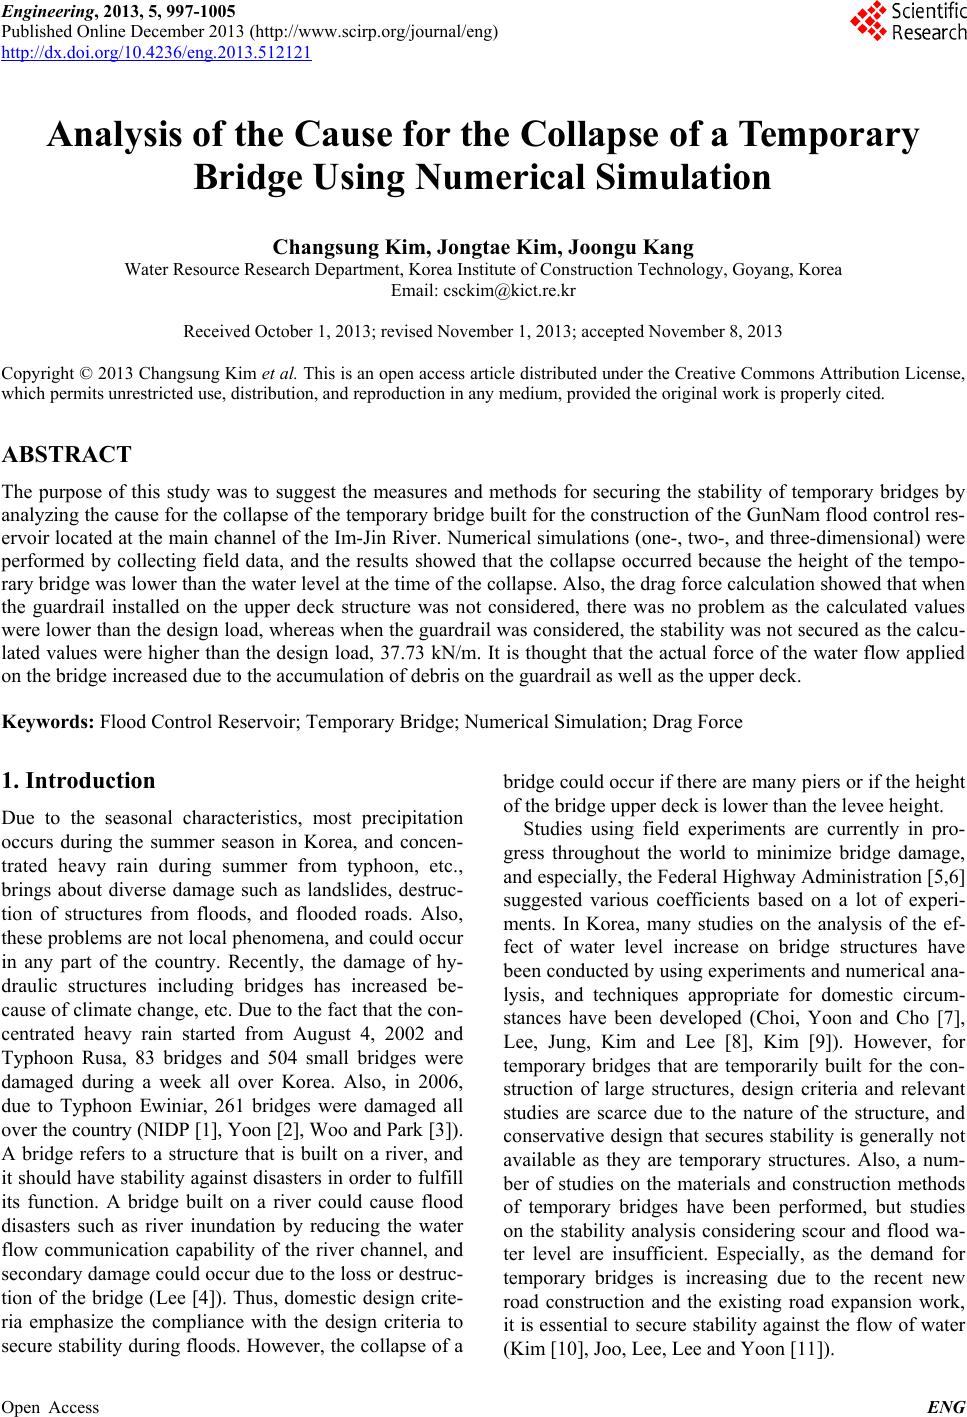
|