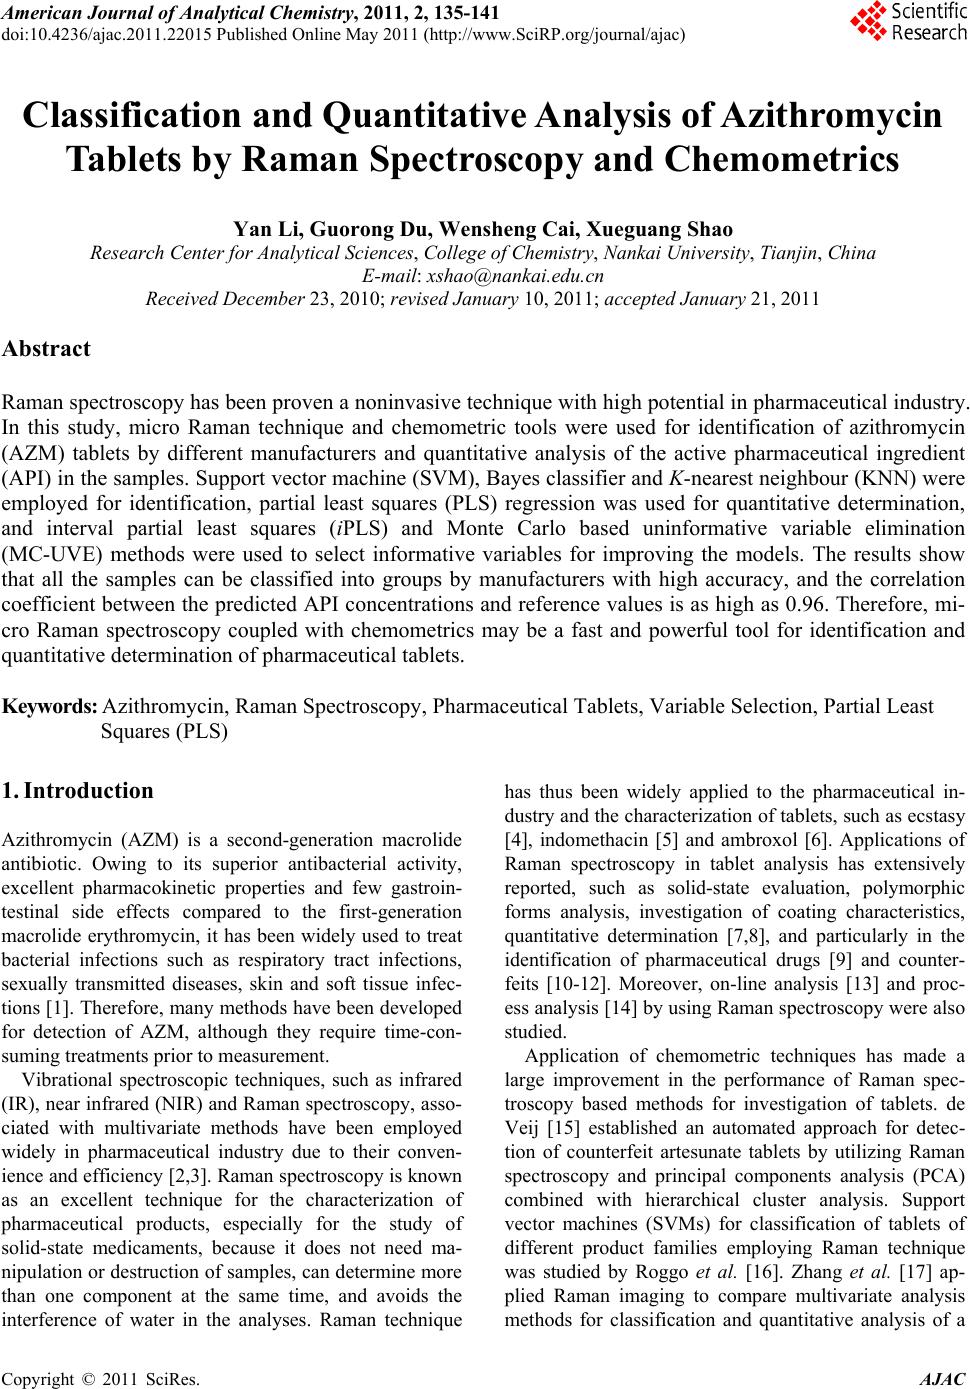
 American Journal of Anal yt ical Chemistry, 2011, 2, 135-141 doi:10.4236/ajac.2011.22015 Published Online May 2011 (http://www.SciRP.org/journal/ajac) Copyright © 2011 SciRes. AJAC Classification and Quantitative Analysis of Azithromycin Tablets by Raman Spectroscopy and Chemometrics Yan Li, Guorong Du, Wensheng Cai, Xueguang Shao Research Center for Analytical Sciences, College of Chemistry, Nankai University, Tianjin, China E-mail: xshao@nankai.edu.cn Received December 23, 2010; revised January 10, 2011; accepted January 21, 2011 Abstract Raman spectroscopy has been proven a noninvasive technique with high potential in pharmaceutical industry. In this study, micro Raman technique and chemometric tools were used for identification of azithromycin (AZM) tablets by different manufacturers and quantitative analysis of the active pharmaceutical ingredient (API) in the samples. Support vector machine (SVM), Bayes classifier and K-nearest neighbour (KNN) were employed for identification, partial least squares (PLS) regression was used for quantitative determination, and interval partial least squares (iPLS) and Monte Carlo based uninformative variable elimination (MC-UVE) methods were used to select informative variables for improving the models. The results show that all the samples can be classified into groups by manufacturers with high accuracy, and the correlation coefficient between the predicted API concentrations and reference values is as high as 0.96. Therefore, mi- cro Raman spectroscopy coupled with chemometrics may be a fast and powerful tool for identification and quantitative determination of pharmaceutical tablets. Keywords: Azithromycin, Raman Spectroscopy, Pharmaceutical Tablets, Variable Selection, Partial Least Squares (PLS) 1. Introduction Azithromycin (AZM) is a second-generation macrolide antibiotic. Owing to its superior antibacterial activity, excellent pharmacokinetic properties and few gastroin- testinal side effects compared to the first-generation macrolide erythromycin, it has been widely used to treat bacterial infections such as respiratory tract infections, sexually transmitted diseases, skin and soft tissue infec- tions [1]. Therefore, many methods have been developed for detection of AZM, although they require time-con- suming treatments prior to measurement. Vibrational spectroscopic techniques, such as infrared (IR), near infrared (NIR) and Raman spectroscopy, asso- ciated with multivariate methods have been employed widely in pharmaceutical industry due to their conven- ience and efficiency [2,3]. Raman spectroscopy is known as an excellent technique for the characterization of pharmaceutical products, especially for the study of solid-state medicaments, because it does not need ma- nipulation or destruction of samples, can determine more than one component at the same time, and avoids the interference of water in the analyses. Raman technique has thus been widely applied to the pharmaceutical in- dustry and the characterization of tablets, such as ecstasy [4], indomethacin [5] and ambroxol [6]. Applications of Raman spectroscopy in tablet analysis has extensively reported, such as solid-state evaluation, polymorphic forms analysis, investigation of coating characteristics, quantitative determination [7,8], and particularly in the identification of pharmaceutical drugs [9] and counter- feits [10-12]. Moreover, on-line analysis [13] and proc- ess analysis [14] by using Raman spectroscopy were also studied. Application of chemometric techniques has made a large improvement in the performance of Raman spec- troscopy based methods for investigation of tablets. de Veij [15] established an automated approach for detec- tion of counterfeit artesunate tablets by utilizing Raman spectroscopy and principal components analysis (PCA) combined with hierarchical cluster analysis. Support vector machines (SVMs) for classification of tablets of different product families employing Raman technique was studied by Roggo et al. [16]. Zhang et al. [17] ap- plied Raman imaging to compare multivariate analysis methods for classification and quantitative analysis of a 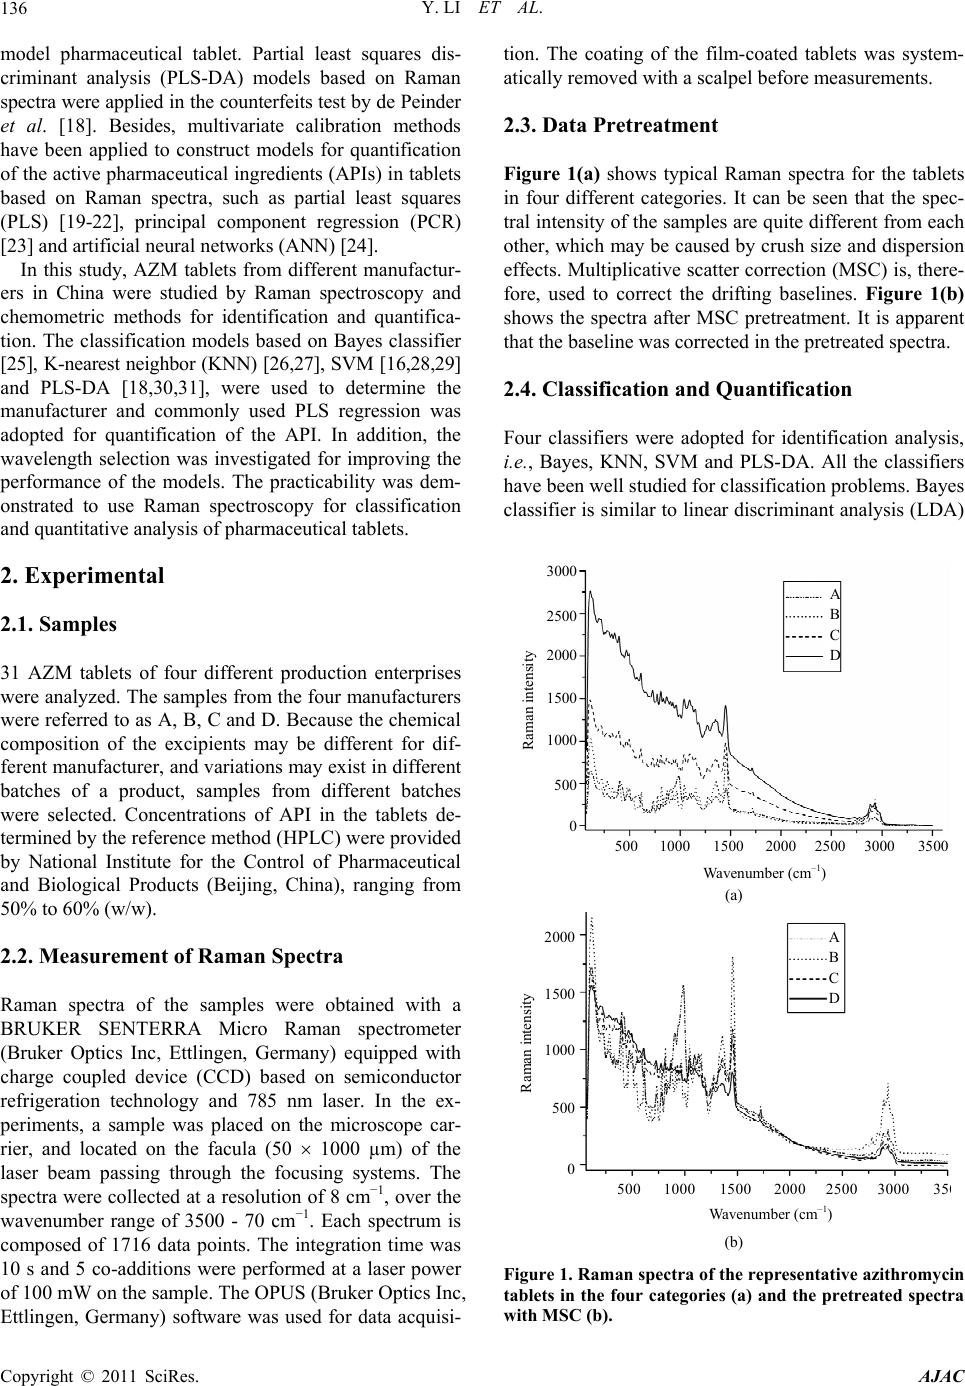 Y. LI ET AL. 136 model pharmaceutical tablet. Partial least squares dis- criminant analysis (PLS-DA) models based on Raman spectra were applied in the counterfeits test by de Peinder et al. [18]. Besides, multivariate calibration methods have been applied to construct models for quantification of the active pharmaceutical ingredients (APIs) in tablets based on Raman spectra, such as partial least squares (PLS) [19-22], principal component regression (PCR) [23] and artificial neural networks (ANN) [24]. In this study, AZM tablets from different manufactur- ers in China were studied by Raman spectroscopy and chemometric methods for identification and quantifica- tion. The classification models based on Bayes classifier [25], K-nearest neighbor (KNN) [26,27], SVM [16,28,29] and PLS-DA [18,30,31], were used to determine the manufacturer and commonly used PLS regression was adopted for quantification of the API. In addition, the wavelength selection was investigated for improving the performance of the models. The practicability was dem- onstrated to use Raman spectroscopy for classification and quantitative analysis of pharmaceutical tablets. 2. Experimental 2.1. Samples 31 AZM tablets of four different production enterprises were analyzed. The samples from the four manufacturers were referred to as A, B, C and D. Because the chemical composition of the excipients may be different for dif- ferent manufacturer, and variations may exist in different batches of a product, samples from different batches were selected. Concentrations of API in the tablets de- termined by the reference method (HPLC) were provided by National Institute for the Control of Pharmaceutical and Biological Products (Beijing, China), ranging from 50% to 60% (w/w). 2.2. Measurement of Raman Spectra Raman spectra of the samples were obtained with a BRUKER SENTERRA Micro Raman spectrometer (Bruker Optics Inc, Ettlingen, Germany) equipped with charge coupled device (CCD) based on semiconductor refrigeration technology and 785 nm laser. In the ex- periments, a sample was placed on the microscope car- rier, and located on the facula (50 1000 µm) of the laser beam passing through the focusing systems. The spectra were collected at a resolution of 8 cm−1, over the wavenumber range of 3500 - 70 cm−1. Each spectrum is composed of 1716 data points. The integration time was 10 s and 5 co-additions were performed at a laser power of 100 mW on the sample. The OPUS (Bruker Optics Inc, Ettlingen, Germany) software was used for data acquisi- tion. The coating of the film-coated tablets was system- atically removed with a scalpel before measurements. 2.3. Data Pretreatment Figure 1(a) shows typical Raman spectra for the tablets in four different categories. It can be seen that the spec- tral intensity of the samples are quite different from each other, which may be caused by crush size and dispersion effects. Multiplicative scatter correction (MSC) is, there- fore, used to correct the drifting baselines. Figure 1(b) shows the spectra after MSC pretreatment. It is apparent that the baseline was corrected in the pretreated spectra. 2.4. Classification and Quantification Four classifiers were adopted for identification analysis, i.e., Bayes, KNN, SVM and PLS-DA. All the classifiers have been well studied for classification problems. Bayes classifier is similar to linear discriminant analysis (LDA) Wavenumber (cm –1 ) Raman intensity A B C D 500 1000 1500 2000 2500 3000 3500 3000 2500 2000 1500 1000 500 0 (a) Wavenumber (cm –1 ) Raman intensity A B C D 500 1000 1500 2000 2500 3000 35 2000 1500 1000 500 0 (b) Figure 1. Raman spectra of the representative azithromycin tablets in the four categories (a) and the pretreated spectra with MSC (b). Copyright © 2011 SciRes. AJAC 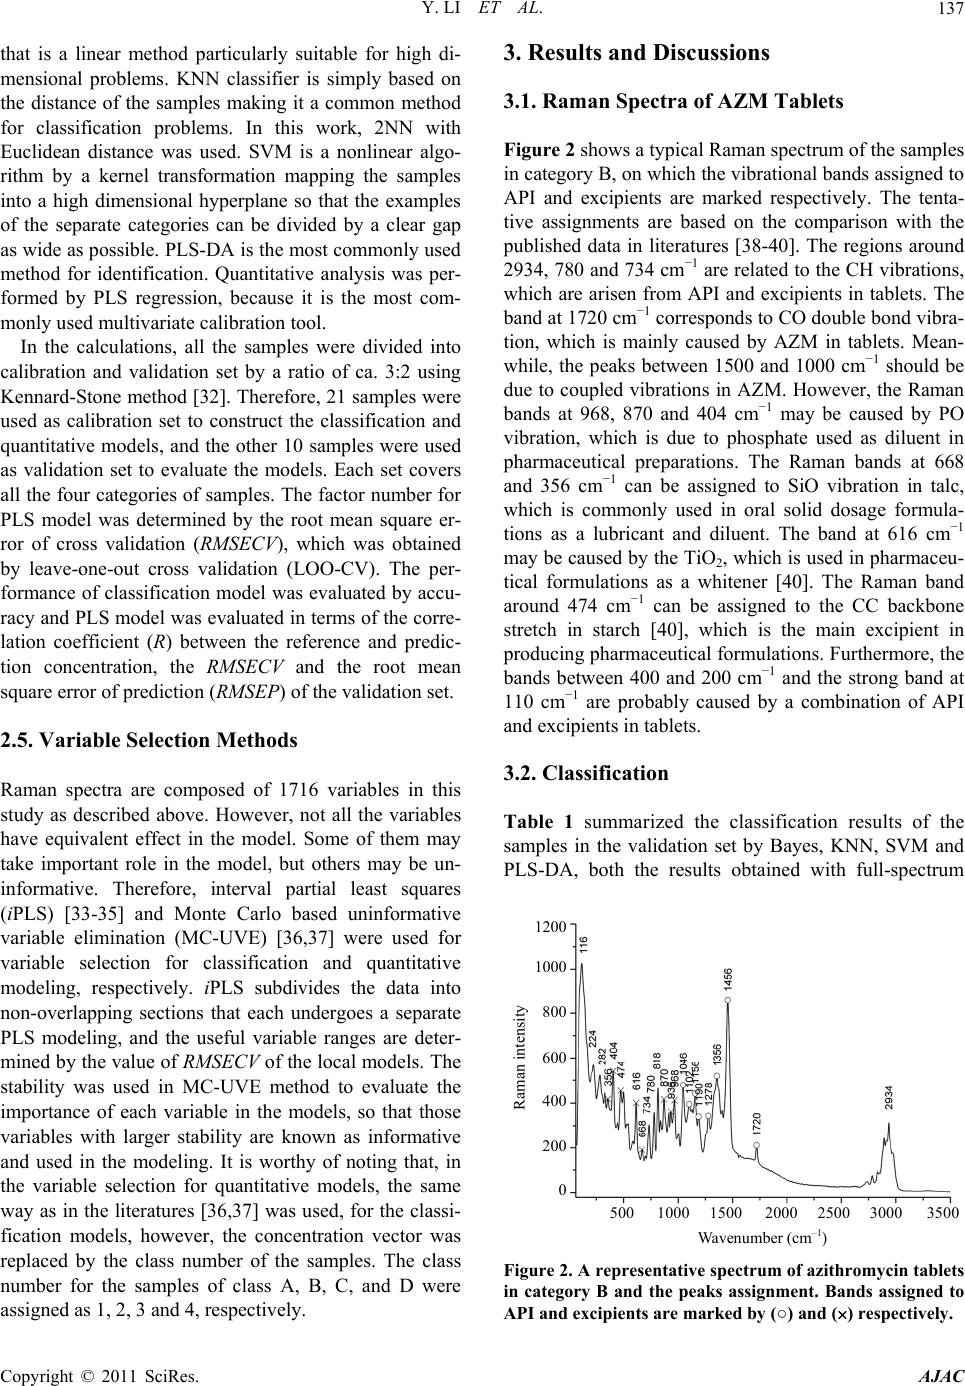 Y. LI ET AL.137 that is a linear method particularly suitable for high di- mensional problems. KNN classifier is simply based on the distance of the samples making it a common method for classification problems. In this work, 2NN with Euclidean distance was used. SVM is a nonlinear algo- rithm by a kernel transformation mapping the samples into a high dimensional hyperplane so that the examples of the separate categories can be divided by a clear gap as wide as possible. PLS-DA is the most commonly used method for identification. Quantitative analysis was per- formed by PLS regression, because it is the most com- monly used multivariate calibration tool. In the calculations, all the samples were divided into calibration and validation set by a ratio of ca. 3:2 using Kennard-Stone method [32]. Therefore, 21 samples were used as calibration set to construct the classification and quantitative models, and the other 10 samples were used as validation set to evaluate the models. Each set covers all the four categories of samples. The factor number for PLS model was determined by the root mean square er- ror of cross validation (RMSECV), which was obtained by leave-one-out cross validation (LOO-CV). The per- formance of classification model was evaluated by accu- racy and PLS model was evaluated in terms of the corre- lation coefficient (R) between the reference and predic- tion concentration, the RMSECV and the root mean square error of prediction (RMS E P) of the validation set. 2.5. Variable Selection Methods Raman spectra are composed of 1716 variables in this study as described above. However, not all the variables have equivalent effect in the model. Some of them may take important role in the model, but others may be un- informative. Therefore, interval partial least squares (iPLS) [33-35] and Monte Carlo based uninformative variable elimination (MC-UVE) [36,37] were used for variable selection for classification and quantitative modeling, respectively. iPLS subdivides the data into non-overlapping sections that each undergoes a separate PLS modeling, and the useful variable ranges are deter- mined by the value of RMSECV of the local models. The stability was used in MC-UVE method to evaluate the importance of each variable in the models, so that those variables with larger stability are known as informative and used in the modeling. It is worthy of noting that, in the variable selection for quantitative models, the same way as in the literatures [36,37] was used, for the classi- fication models, however, the concentration vector was replaced by the class number of the samples. The class number for the samples of class A, B, C, and D were assigned as 1, 2, 3 and 4, respectively. 3. Results and Discussions 3.1. Raman Spectra of AZM Tablets Figure 2 shows a typical Raman spectrum of the samples in category B, on which the vibrational bands assigned to API and excipients are marked respectively. The tenta- tive assignments are based on the comparison with the published data in literatures [38-40]. The regions around 2934, 780 and 734 cm−1 are related to the CH vibrations, which are arisen from API and excipients in tablets. The band at 1720 cm−1 corresponds to CO double bond vibra- tion, which is mainly caused by AZM in tablets. Mean- while, the peaks between 1500 and 1000 cm−1 should be due to coupled vibrations in AZM. However, the Raman bands at 968, 870 and 404 cm−1 may be caused by PO vibration, which is due to phosphate used as diluent in pharmaceutical preparations. The Raman bands at 668 and 356 cm−1 can be assigned to SiO vibration in talc, which is commonly used in oral solid dosage formula- tions as a lubricant and diluent. The band at 616 cm−1 may be caused by the TiO2, which is used in pharmaceu- tical formulations as a whitener [40]. The Raman band around 474 cm−1 can be assigned to the CC backbone stretch in starch [40], which is the main excipient in producing pharmaceutical formulations. Furthermore, the bands between 400 and 200 cm−1 and the strong band at 110 cm−1 are probably caused by a combination of API and excipients in tablets. 3.2. Classification Table 1 summarized the classification results of the samples in the validation set by Bayes, KNN, SVM and PLS-DA, both the results obtained with full-spectrum Wavenumber (cm –1 ) Raman intensity 500 1000 1500 2000 2500 3000 350 1200 0 1000 800 600 400 200 Figure 2. A representative spectrum of azithromycin tablets in category B and the peaks assignment. Bands assigned to API and excipients are marked by (○) and () respectively. Copyright © 2011 SciRes. AJAC  Y. LI ET AL. Copyright © 2011 SciRes. AJAC 138 and selected wavenumbers by iPLS (partial-spectrum) were listed. It is clear that, when the full-spectrum was used, the accuracies are less than 80.00% for all the four methods. The results indicate that not all the wavenum- bers in the spectra are informative for the classification, wavenumber selection is needed. classifiers. 3.3. Quantification At first, PLS model was built by using the 21 calibration samples and full-spectrum data. The number of latent variables used in this model was determined by leave- one-out cross validation. The predicted results are sum- marized in the first line of Table 2. It can be seen that the correlation coefficient (R) between reference contents and prediction values of the validation set is 0.9271, and the recoveries are in the range of 95.87% - 102.65%. For the purpose of improving the accuracy of classifi- cation, iPLS was adopted to select informative variables. Figure 3 shows the result obtained by iPLS and the dot line shows the value of the full-spectrum model. It can be seen that, most of local models are inferior to the full- spectrum model and only the models of interval No. 2, 3, 4 and 17 surpass the full-spectrum model. Therefore, the 343 variables in the four intervals (two regions from 242 to 756 cm−1 and from 2822 to 2990 cm−1) were selected to build the classification model. It is clear that the re- gion from 242 to 756 cm−1 is the information of inor- ganic substances of the excipients in the samples, and the band of 2822 - 2990 cm−1 involves the vibration of CH, which is related to the API in the samples. Interval number RMSCEV 2 4 6 8 10 12 14 16 18 20 1.2 1.0 0.8 0.6 0.4 0.2 0.0 After variable selection, the classification accuracy of PLS-DA reaches 100% as shown in Table 1. The results show that Raman spectroscopy with the aid of chemom- etrics may be a convenient tool for identification of pharmaceutical tablets. However, the variable selection has no significant improvement for the classification accuracies of the other three methods. The reason may be that the variables selection is done with iPLS, in which the performance of each variable region is evaluated by using the coefficients of the PLS-DA model. New meth- ods should be developed for improving the results of the Figure 3. RMSECVs obtained by iPLS for the 20 local mod- els. The dot line indicates the RMSECV of the full-spectrum model. Table 1. Classification results for the samples in the validation set. Classification accuracy (%) Classifier Classification criteria Full-spectrum Partial-spectrum (Na) Bayes Diaglinearb 70.00 70.00 (343) KNN Euclidean distancec 80.00 60.00 (343) SVM Linear kerneld 80.00 60.00 (343) PLS-DA 80.00 100.00 (343) aN is the number of wavenumbers used in the models; bDiaglinear is a type of discriminant function that calculates the density of each group with a diagonal covariance matrix; cEuclidean distance measures the distance of two points using the Pythagorean formula; dLinear kernel produces a linear subspace of a homogeneous system with linear equations. Table 2. Results of the PLS models for quantification. Spectral range Latent variable number RMSEP R Recoveries (%) Full-spectrum 5 0.0120 0.9271 95.87 - 102.65 Partial-spectrum (N = 135) 5 0.0080 0.9634 98.29 - 102.65 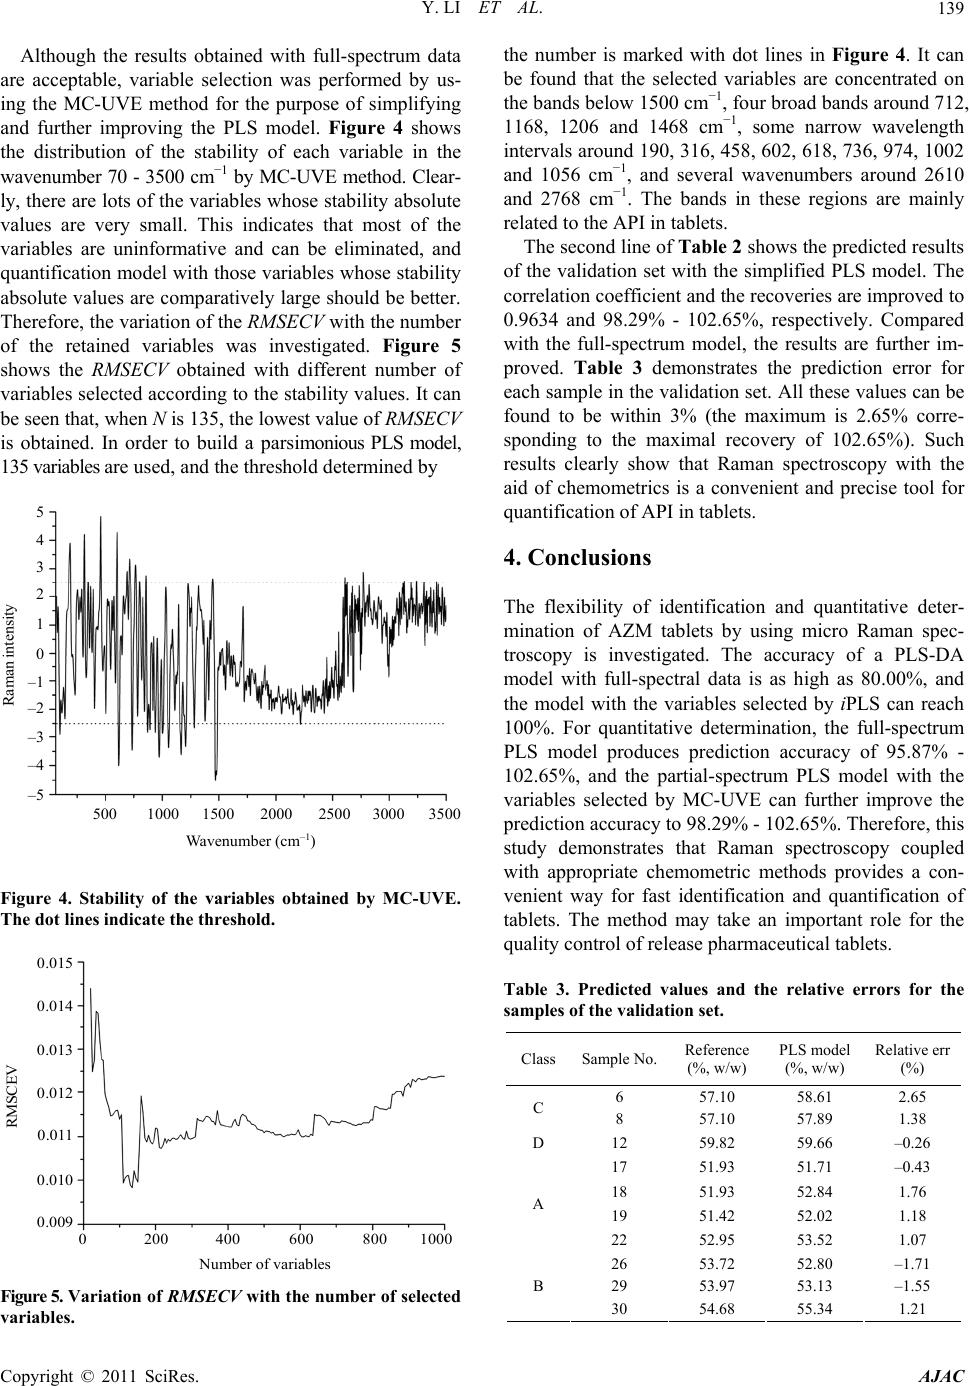 Y. LI ET AL. Copyright © 2011 SciRes. AJAC 139 Although the results obtained with full-spectrum data are acceptable, variable selection was performed by us- ing the MC-UVE method for the purpose of simplifying and further improving the PLS model. Figure 4 shows the distribution of the stability of each variable in the wavenumber 70 - 3500 cm−1 by MC-UVE method. Clear- ly, there are lots of the variables whose stability absolute values are very small. This indicates that most of the variables are uninformative and can be eliminated, and quantification model with those variables whose stability absolute values are comparatively large should be better. Therefore, the variation of the RMSECV with the number of the retained variables was investigated. Figure 5 shows the RMSECV obtained with different number of variables selected according to the stability values. It can be seen that, when N is 135, the lowest value of RMSECV is obtained. In order to build a parsimonious PLS model, 135 variables are used, and the threshold determined by Wavenumber (cm –1 ) Raman intensity 500 1000 1500 2000 2500 3000 3500 0 5 4 3 2 1 1 2 3 4 5 Figure 4. Stability of the variables obtained by MC-UVE. The dot lines indicate the threshold. Number of variables RMSCEV 0 200 400 600 800 1000 0.015 0.014 0.013 0.012 0.011 0.010 0.009 Figure 5. Variation of RMSECV with the number of selected variables. the number is marked with dot lines in Figure 4. It can be found that the selected variables are concentrated on the bands below 1500 cm−1, four broad bands around 712, 1168, 1206 and 1468 cm−1, some narrow wavelength intervals around 190, 316, 458, 602, 618, 736, 974, 1002 and 1056 cm−1, and several wavenumbers around 2610 and 2768 cm−1. The bands in these regions are mainly related to the API in tablets. The second line of Table 2 shows the predicted results of the validation set with the simplified PLS model. The correlation coefficient and the recoveries are improved to 0.9634 and 98.29% - 102.65%, respectively. Compared with the full-spectrum model, the results are further im- proved. Table 3 demonstrates the prediction error for each sample in the validation set. All these values can be found to be within 3% (the maximum is 2.65% corre- sponding to the maximal recovery of 102.65%). Such results clearly show that Raman spectroscopy with the aid of chemometrics is a convenient and precise tool for quantification of API in tablets. 4. Conclusions The flexibility of identification and quantitative deter- mination of AZM tablets by using micro Raman spec- troscopy is investigated. The accuracy of a PLS-DA model with full-spectral data is as high as 80.00%, and the model with the variables selected by iPLS can reach 100%. For quantitative determination, the full-spectrum PLS model produces prediction accuracy of 95.87% - 102.65%, and the partial-spectrum PLS model with the variables selected by MC-UVE can further improve the prediction accuracy to 98.29% - 102.65%. Therefore, this study demonstrates that Raman spectroscopy coupled with appropriate chemometric methods provides a con- venient way for fast identification and quantification of tablets. The method may take an important role for the quality control of release pharmaceutical tablets. Table 3. Predicted values and the relative errors for the samples of the validation set. ClassSample No.Reference (%, w/w) PLS model (%, w/w) Relative err (%) 6 57.10 58.61 2.65 C 8 57.10 57.89 1.38 D 12 59.82 59.66 –0.26 17 51.93 51.71 –0.43 18 51.93 52.84 1.76 19 51.42 52.02 1.18 A 22 52.95 53.52 1.07 26 53.72 52.80 –1.71 29 53.97 53.13 –1.55 B 30 54.68 55.34 1.21 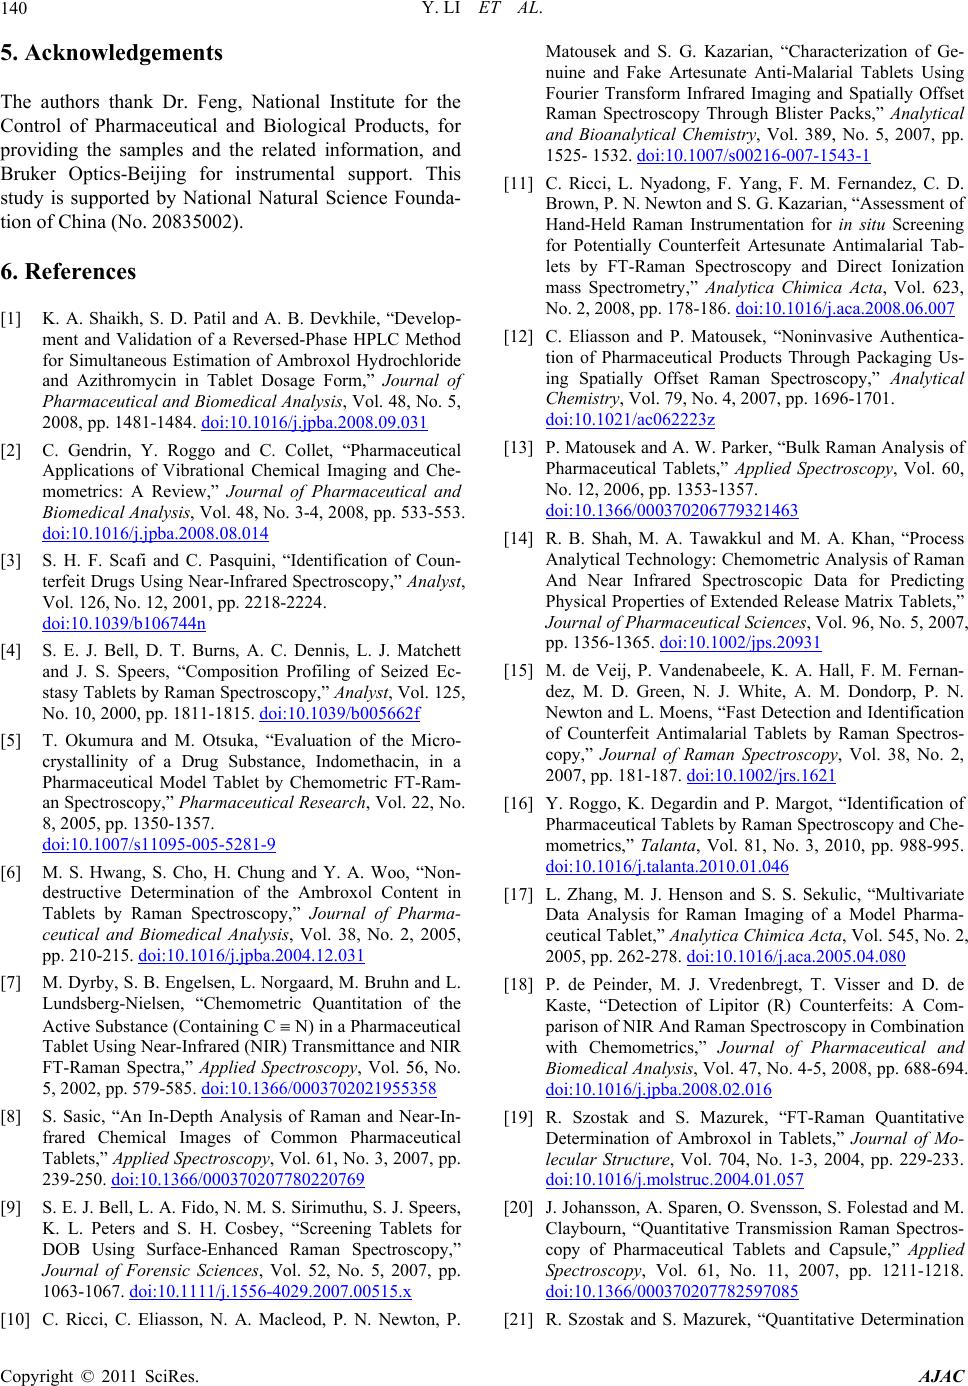 Y. LI ET AL. 140 5. Acknowledgements The authors thank Dr. Feng, National Institute for the Control of Pharmaceutical and Biological Products, for providing the samples and the related information, and Bruker Optics-Beijing for instrumental support. This study is supported by National Natural Science Founda- tion of China (No. 20835002). 6. References [1] K. A. Shaikh, S. D. Patil and A. B. Devkhile, “Develop- ment and Validation of a Reversed-Phase HPLC Method for Simultaneous Estimation of Ambroxol Hydrochloride and Azithromycin in Tablet Dosage Form,” Journal of Pharmaceutical and Biomedical Analysis, Vol. 48, No. 5, 2008, pp. 1481-1484. doi:10.1016/j.jpba.2008.09.031 [2] C. Gendrin, Y. Roggo and C. Collet, “Pharmaceutical Applications of Vibrational Chemical Imaging and Che- mometrics: A Review,” Journal of Pharmaceutical and Biomedical Analysis, Vol. 48, No. 3-4, 2008, pp. 533-553. doi:10.1016/j.jpba.2008.08.014 [3] S. H. F. Scafi and C. Pasquini, “Identification of Coun- terfeit Drugs Using Near-Infrared Spectroscopy,” Analyst, Vol. 126, No. 12, 2001, pp. 2218-2224. doi:10.1039/b106744n [4] S. E. J. Bell, D. T. Burns, A. C. Dennis, L. J. Matchett and J. S. Speers, “Composition Profiling of Seized Ec- stasy Tablets by Raman Spectroscopy,” Analyst, Vol. 125, No. 10, 2000, pp. 1811-1815. doi:10.1039/b005662f [5] T. Okumura and M. Otsuka, “Evaluation of the Micro- crystallinity of a Drug Substance, Indomethacin, in a Pharmaceutical Model Tablet by Chemometric FT-Ram- an Spectroscopy,” Pharmaceutical Research, Vol. 22, No. 8, 2005, pp. 1350-1357. doi:10.1007/s11095-005-5281-9 [6] M. S. Hwang, S. Cho, H. Chung and Y. A. Woo, “Non- destructive Determination of the Ambroxol Content in Tablets by Raman Spectroscopy,” Journal of Pharma- ceutical and Biomedical Analysis, Vol. 38, No. 2, 2005, pp. 210-215. doi:10.1016/j.jpba.2004.12.031 [7] M. Dyrby, S. B. Engelsen, L. Norgaard, M. Bruhn and L. Lundsberg-Nielsen, “Chemometric Quantitation of the Active Substance (Containing C N) in a Pharmaceutical Tablet Using Near-Infrared (NIR) Transmittance and NIR FT-Raman Spectra,” Applied Spectroscopy, Vol. 56, No. 5, 2002, pp. 579-585. doi:10.1366/0003702021955358 [8] S. Sasic, “An In-Depth Analysis of Raman and Near-In- frared Chemical Images of Common Pharmaceutical Tablets,” Applied Spectroscopy, Vol. 61, No. 3, 2007, pp. 239-250. doi:10.1366/000370207780220769 [9] S. E. J. Bell, L. A. Fido, N. M. S. Sirimuthu, S. J. Speers, K. L. Peters and S. H. Cosbey, “Screening Tablets for DOB Using Surface-Enhanced Raman Spectroscopy,” Journal of Forensic Sciences, Vol. 52, No. 5, 2007, pp. 1063-1067. doi:10.1111/j.1556-4029.2007.00515.x [10] C. Ricci, C. Eliasson, N. A. Macleod, P. N. Newton, P. Matousek and S. G. Kazarian, “Characterization of Ge- nuine and Fake Artesunate Anti-Malarial Tablets Using Fourier Transform Infrared Imaging and Spatially Offset Raman Spectroscopy Through Blister Packs,” Analytical and Bioanalytical Chemistry, Vol. 389, No. 5, 2007, pp. 1525- 1532. doi:10.1007/s00216-007-1543-1 [11] C. Ricci, L. Nyadong, F. Yang, F. M. Fernandez, C. D. Brown, P. N. Newton and S. G. Kazarian, “Assessment of Hand-Held Raman Instrumentation for in situ Screening for Potentially Counterfeit Artesunate Antimalarial Tab- lets by FT-Raman Spectroscopy and Direct Ionization mass Spectrometry,” Analytica Chimica Acta, Vol. 623, No. 2, 2008, pp. 178-186. doi:10.1016/j.aca.2008.06.007 [12] C. Eliasson and P. Matousek, “Noninvasive Authentica- tion of Pharmaceutical Products Through Packaging Us- ing Spatially Offset Raman Spectroscopy,” Analytical Chemistry, Vol. 79, No. 4, 2007, pp. 1696-1701. doi:10.1021/ac062223z [13] P. Matousek and A. W. Parker, “Bulk Raman Analysis of Pharmaceutical Tablets,” Applied Spectroscopy, Vol. 60, No. 12, 2006, pp. 1353-1357. doi:10.1366/000370206779321463 [14] R. B. Shah, M. A. Tawakkul and M. A. Khan, “Process Analytical Technology: Chemometric Analysis of Raman And Near Infrared Spectroscopic Data for Predicting Physical Properties of Extended Release Matrix Tablets,” Journal of Pharmaceutical Sciences, Vol. 96, No. 5, 2007, pp. 1356-1365. doi:10.1002/jps.20931 [15] M. de Veij, P. Vandenabeele, K. A. Hall, F. M. Fernan- dez, M. D. Green, N. J. White, A. M. Dondorp, P. N. Newton and L. Moens, “Fast Detection and Identification of Counterfeit Antimalarial Tablets by Raman Spectros- copy,” Journal of Raman Spectroscopy, Vol. 38, No. 2, 2007, pp. 181-187. doi:10.1002/jrs.1621 [16] Y. Roggo, K. Degardin and P. Margot, “Identification of Pharmaceutical Tablets by Raman Spectroscopy and Che- mometrics,” Talanta, Vol. 81, No. 3, 2010, pp. 988-995. doi:10.1016/j.talanta.2010.01.046 [17] L. Zhang, M. J. Henson and S. S. Sekulic, “Multivariate Data Analysis for Raman Imaging of a Model Pharma- ceutical Tablet,” Analytica Chimica Acta, Vol. 545, No. 2, 2005, pp. 262-278. doi:10.1016/j.aca.2005.04.080 [18] P. de Peinder, M. J. Vredenbregt, T. Visser and D. de Kaste, “Detection of Lipitor (R) Counterfeits: A Com- parison of NIR And Raman Spectroscopy in Combination with Chemometrics,” Journal of Pharmaceutical and Biomedical Analysis, Vol. 47, No. 4-5, 2008, pp. 688-694. doi:10.1016/j.jpba.2008.02.016 [19] R. Szostak and S. Mazurek, “FT-Raman Quantitative Determination of Ambroxol in Tablets,” Journal of Mo- lecular Structure, Vol. 704, No. 1-3, 2004, pp. 229-233. doi:10.1016/j.molstruc.2004.01.057 [20] J. Johansson, A. Sparen, O. Svensson, S. Folestad and M. Claybourn, “Quantitative Transmission Raman Spectros- copy of Pharmaceutical Tablets and Capsule,” Applied Spectroscopy, Vol. 61, No. 11, 2007, pp. 1211-1218. doi:10.1366/000370207782597085 [21] R. Szostak and S. Mazurek, “Quantitative Determination Copyright © 2011 SciRes. AJAC  Y. LI ET AL. Copyright © 2011 SciRes. AJAC 141 of Acetylsalicylic Acid and Acetaminophen in Tablets by FT-Raman Spectroscopy,” Analyst, Vol. 127, No. 1, 2002, pp. 144-148. doi:10.1039/b108240j [22] S. Mazurek and R. Szostak, “Quantification of Atorvas- tatin Calcium in Tablets by FT-Raman Spectroscopy,” Journal of Pharmaceutical and Biomedical Analysis, Vol. 49, No. 1, 2009, pp. 168-172. doi:10.1016/j.jpba.2008.10.015 [23] S. Mazurek and R. Szostak, “Quantitative Determination of Captopril and Prednisolone in Tablets by FT-Raman Spectroscopy,” Journal of Pharmaceutical and Biomedi- cal Analysis, Vol. 40, No. 5, 2006, pp. 1225-1230. doi:10.1016/j.jpba.2005.03.047 [24] S. Mazurek and R. Szostak, “Quantitative Determination of Diclofenac Sodium in Solid Dosage Forms by FT-Raman Spectroscopy,” Journal of Pharmaceutical and Biomedical Analysis, Vol. 48, No. 3, 2008, pp. 814-821. doi:10.1016/j.jpba.2008.08.013 [25] H. Sun, “A Naive Bayes Classifier for Prediction of Mul- tidrug Resistance Reversal Activity on the Basis of Atom typing,” Journal of Medicinal Chemistry, Vol. 48, No. 12, 2005, pp. 4031-4039. doi:10.1021/jm050180t [26] K. C. Chou and H. B. Shen, “Predicting Eukaryotic Pro- tein Subcellular Location by Fusing Optimized Evi- dence-Theoretic K-Nearest Neighbor Classifiers,” Journal of Proteome Research, Vol. 5, No. 8, 2006, pp. 1888-1897. doi:10.1021/pr060167c [27] U. Schmid, P. Rosch, M. Krause, M. Harz, J. Popp and K. Baumann, “Gaussian Mixture Discriminant Analysis for the Single-Cell Differentiation of Bacteria Using Mi- cro-Raman Spectroscopy,” Chemometrics and Intelligent Laboratory Systems, Vol. 96, No. 2, 2009, pp. 159-171. doi:10.1016/j.chemolab.2009.01.008 [28] R. Karchin, K. Karplus and D. Haussler, “Classifying G- protein Coupled Receptors with Support Vector Mac- hines,” Bioinformatics, Vol. 18, No. 1, 2002, pp. 147-159. doi:10.1093/bioinformatics/18.1.147 [29] S. Zomer, R. G. Brereton, J. F. Carter and C. Eckers, “Support Vector Machines for the Discrimination of Analytical Chemical Data: Application to the Determina- tion of Tablet Production by Pyrolysis-Gas Chromatog- raphy-Mass Spectrometry,” Analyst, Vol. 129, No. 2, 2004, pp. 175-181. doi:10.1039/b312982a [30] C. D. Natale, A. Macagnano, E. Martinelli, R. Paolesse, G. D'Arcangelo, C. Roscioni, A. Finazzi-Agro and A. D'Amico, “Lung Cancer Identification by the Analysis of Breath by Means of an Array of Non-Selective Gas Sen- sors,” Biosensors and Bioelectronics, Vol. 18, No. 10, 2003, pp. 1209-1218. doi:10.1016/S0956-5663(03)00086-1 [31] S. Bijlsma, L. Bobeldijk, E. R. Verheij, R. Ramaker, S. Kochhar, I. A. Macdonald, B. van Ommen and A. K. Smilde, “Large-Scale Human Metabolomics Studies: A Strategy For Data (Pre-) Processing And Validation,” Analytical Chemistry, Vol. 78, No. 2, 2006, pp. 567-574. doi:10.1021/ac051495j [32] R. W. Kennard and L. A. Stone, “Computer Aided De- sign of Experiments,” Technometrics, Vol. 11, 1969, pp. 137-148. doi:10.2307/1266770 [33] L. Norgaard, A. Saudland, J. Wagner, J. P. Nielsen, L. Munck and S. B. Engelsen, “Interval Partial Least- Squares Regression (iPLS): A Comparative Chemometric Study with an Example from Near-Infrared Spectros- copy,” Applied Spectroscopy, Vol. 54, No. 3, 2000, pp. 413-419. doi:10.1366/0003702001949500 [34] C. Abrahamsson, J. Johansson, A. Sparen and F. Lindg- ren, “Comparison of Different Variable Selection Meth- ods Conducted on NIR Transmission Measurements on Intact Tablets,” Chemometrics and Intelligent Laboratory Systems, Vol. 69, No. 1, 2003, pp. 3-12. doi:10.1016/S0169-7439(03)00064-9 [35] X. B. Zou, J. W. Zhao, M. J. W. Povey, M. Holmes and H. P. Mao, “Variables Selection Methods in Near-In- frared Spectroscopy,” Analytica Chimca Acta, Vol. 667, No. 1, 2010, pp. 14-32.doi:10.1016/j.aca.2010.03.048 [36] W. S. Cai, Y. K. Li and X. G. Shao, “A Variable Selec- tion Method Based on Uninformative Variable Elimina- tion for Multivariate Calibration of Near-Infrared Spec- tra,” Chemometrics and Intelligent Laboratory Systems, Vol. 90, No. 2, 2008, pp. 188-194. doi:10.1016/j.chemolab.2007.10.001 [37] H. Xu, Z. C. Liu, W. S. Cai and X. G. Shao, “A Wave- Length Selection Method Based on Randomization Test for Near-Infrared Spectral Analysis,” Chemometrics and Intelligent Laboratory Systems, Vol. 97, No. 2, 2009, pp. 189-193. doi:10.1016/j.chemolab.2009.04.006 [38] P. Vandenabeele, B. Wehling, L. Moens, H. Edwards, M. De Reu and G. Van Hooydonk, “Analysis with Micro-R- aman Spectroscopy of Natural Organic Binding Media and Varnishes Used in Art,” Analytica Chimica Acta, Vol. 407, No. 1-2, 2000, pp. 261-274. doi:10.1016/S0003-2670(99)00827-2 [39] J. De Gelder, K. De Gussem, P. Vandenabeele and L. Moens, “Reference Database of Raman Spectra of Bio- logical Molecules,” Journal of Raman Spectroscopy, Vol. 38, No. 9, 2007, pp. 1133-1147. doi:10.1002/jrs.1734 [40] M. de Veij, P. Vandenabeele, T. De Beer, J. P. Remon and L. Moens, “Reference Database of Raman Spectra of Pharmaceutical Excipients,” Journal of Raman Spectros- copy, Vol. 40, No. 3, 2009, pp. 297-307. doi:10.1002/jrs.2125
|