 American Journal of Analytical Chemistry, 2011, 2, 126-134 doi:10.4236/ajac.2011.22014 Published Online May 2011 (http://www. SciRP.org/journal/ajac) Copyright © 2011 SciRes. AJAC Development and Validation of Stability Indicating RP-HPLC-PDA Method for Tenatoprazole and Its Application for Formulation Analysis and Dissolution Study Sunil R. Dhaneshwar, Vaijanath N. Jagtap Department of Pharmaceutical Chemistry, Bharati Vidyapeeth University, Poona College of Pharmacy, Maharashtra, India E-mail: sunil.dhaneshwar@gmail.com, vnjagtap@yahoo.co.in Received November 17, 2010; revised January 21, 2011; accepted January 24, 2011 Abstract In the present study, comprehensive stress testing of tenatoprazole was carried out according to ICH guide- line Q1A (R2). Tenatoprazole was subjected to stress conditions of hydrolysis, oxidation, photolysis and neutral decomposition. Extensive degradation was found to occur in acidic, neutral and oxidative conditions. Mild degradation was observed in basic conditions. The drug is relatively stable in the solid-state. Successful separation of drug from degradation products formed under stress conditions was achieved on a Kromasil C18 column (250 mm × 4.6 mm, 5.0 μ particle size) using methanol: THF: acetate buffer (68:12:20 v/v) pH ad- justed to 6.0 with acetic acid as mobile phase, flow rate was 1.0 mL·min–1 and column was maintained at 45˚C. Quantification and linearity was achieved at 307 nm over the concentration range of 0.5 - 160 μg·mL–1 for tenatoprazole. The method was validated for specificity, linearity, accuracy, precision, LOD, LOQ and robustness. Keywords: Stability Indicating RP-HPLC-PDA, Method Validation, Column Liquid Chromatography 1. Introduction Tenatoprazole is a novel proton pump inhibitor which has imidazopyridine ring connected to a pyridine ring by sulfinylmethylchain. Tenatoprazole (Figure 1), 5-meth - oxy-2-(3,5-dimethyl-4-methoxy)-2-pyridyl]methylthio]-i midazole[4,5-b]pyridine is a prodrug of the proton pump inhibitor (PPI) class, which is converted to the active sulfenamide or sulfenic acid by acid in the secretory ca- naliculus of the stimulated parietal cell of the stomach [1]. This active species binds to luminally accessible cysteines of the gastric H+, K+ ATPase resulting in dis- ulfide formation and acid secretion inhibition [2,3]. However, the anti-secretory and anti-ulcer effects of te- natoprazole were reported to be 2 - 4 times more potent than those of omeprazole with long-lasting effects on gastric acid secretion [4]. All proton pump inhibitors are unstable when exposed to an acidic milieu, such as the stomach. Therefore, they are formulated with an enteric coating that shields the active drug from the acidic gas- tric environment [5,6]. Tenatoprazole has a greatly ex- tended plasma half-life in comparison with other proton pump inhibitors [7]. HPLC method for the quantitative determination of tenatoprazole in rat plasma [8], phar- macokinetic study in dog plasma [3-9] and pharmacoki- netic study in healthy male Caucasian volunteers [10] have been reported. These methods were developed for the purpose of determining low level of drug substance in the biological samples, thus they are not suitable for routine analysis of formulated product where the content of API is high in the formulation. Recently one stability indicating LC-MS/MS method was reported [11] using C18 column and runtime of 15 min. Large number of samples are generated during stability study therefore Figure 1. Structure of tenatoprazole.  S. R. DHANESHWAR ET AL. Copyright © 2011 SciRes. AJAC stability indicating method with short analysis time is always preferred in order to increase efficiency and for economics of operations. It also requires that analytical test procedures for stability samples should be stabili- ty-indicating and should be fully validated [12]. Therefore the aim of the present study was to develop a sensitive, precise, accurate and stability indicating RP- HPLC-PDA method with short runtime for the determi- nation of tenatoprazole and further application of the method f or di ssoluti o n study. 2. Experimental 2.1. Materials and Reagents Laboratory formulated tablets from two lo ts (B. No. SAP 1101, SAP 1102) containing 20 mg of tenatoprazole were used for analysis. Pure drug sample of tenatoprazole (98.5%) were obtained as a gift sample from New Health Care Ltd. Indore (MP). HPLC grade methanol and tetra- hydrofuran (THF) were procured from Merck and Qua- ligens Fine Chemicals, respectively (Mumbai, India). Analytical grade ammonium acetate and acetic acid were procured from Research Lab Fine Chem. (Mumbai, In- dia). Double distilled water and tablet placebo were made at lab scale only. 2.2. Instrumentation and Chromatographic Conditions The HPLC system consisted of a binary pump (model Waters 515), auto sampler (model 717 plus), column heater, and PDA detector (Waters 2998). Data collection and analysis were performed using Empower-version 2 software. Separation was achieved on Kromasil C18 column (250 mm × 4.6 mm, 5.0 µ) maintained at 45˚C using col- umn oven. Isocratic elution with methanol: tetrahydrofuran: 25mM acetate buffer (68:12:20 v/v) mobile phase adjusted to pH 6.0 with acetic acid at the flow rate of 1.0 mL·min–1 were carried out. The detection was monitored at 307 nm and injection volume was 20 µL. The peak purity was checked with the ph ot odiode ar ra y detector. 2.3. Preparation of Standard Solutions and Calibration Curve Standard stock solution of tenatoprazole containing 1000 μg·mL–1 were prepared in methanol. To study the linear- ity range, serial dilutions were made from 0.50 to 160 µg· mL –1 in mobile phase and injected in to column. Ca- libration curves were plotted as concentration of drug versus peak area response. From the standard stock solu- tions, solution containing 80 µg·mL–1 of tenatoprazole was injected in to c olumn. The system sui tability test was pe r- formed from six re pli cat e injecti ons of s ta ndard s olution. 2.4. Analysis of Tablet Formulations Twenty tablets were weighed accurately and a quantity of tablet powder equivalent to 100 mg of tenatoprazole was weighed and dissolved in 80 mL of methanol with the aid of ultrasonication for 10 min and solution was filtered through Whatman paper No. 41 into a 100 mL volumetric flask. Filter paper was washed with the sol- vent, adding washings to the volumetric flask and vo- lume was made up to mark. The solution was suitably di- luted with mobile phase to get a concentration of 80 μg·mL–1 of tenatoprazole. 2.5. Method Validation The HPLC method was validated in terms of precision, accuracy and linearity according to ICH guidelines [11]. Assay method precision was determined using nine in- dependent test solutions. The intermediate precision of the assay method was also evaluated as inter-day and intra-day precision. The accuracy of the assay method was evaluated with the recovery of the standards from excipients. Three different quantities (low, medium and high) of the authentic standards were added to the pla- cebo. The mixtures were extracted and analyzed using the developed HPLC method. Linearity test solutions were prepared as described in Section 2.3. The Limit of Detection (LOD) and Limit of Quantification (LOQ) for analytes were estimated by injecting a series of dilute solutions with known concentration. Values of LOD and LOQ were calculated by using σ (standard Deviation of response) and b (Slope of the calibration curve) and by using equations, LOD = 3.3 b σ × and LOQ = . To determine the robustness of the method, final experimental conditions were purposely altered and results were examined. The parameters considered (±values) for the study were, flow rate (±5%), column temp . (± 2˚C), measurement wavelength (±1 nm), injec- tion volume (±2 µl), % organic (±5%), buffer strength (±5 mM) and effect of column from different lots were studied. The drug solution stability were carried out for short-term stability by keeping at room temperature for 12 hrs, long-term stability by storing at 4˚C for 30 days and auto-sampler stability by storing the samples for 24 hrs in the auto-sampler and then analyzing against freshly prepared solutions. For method development and optimization, retention factor ( k) were calculated by using parameters tR (retention time) and tM (elu- tion time of the solvent front) and by using the equ- ation k = (tR − tM)/tM. 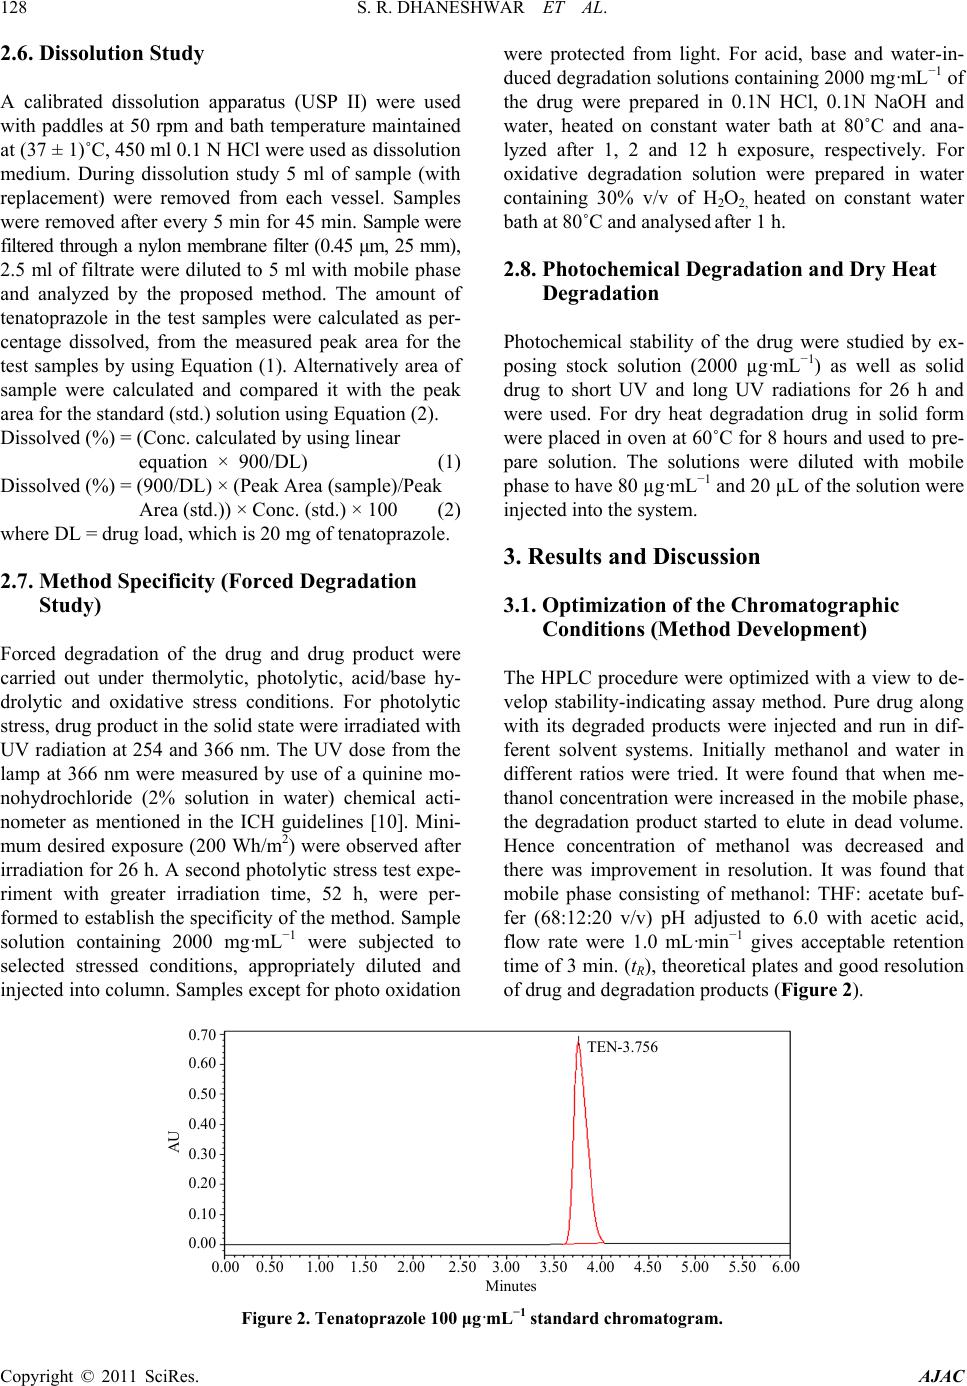 S. R. DHANESHWAR ET AL. Copyright © 2011 SciRes. AJAC 2.6. Dissolution Study A calibrated dissolution apparatus (USP II) were used with paddles at 50 rpm and bath temperature maintained at (37 ± 1)˚C, 450 ml 0.1 N HCl were used as dissolution medium. During dissolution study 5 ml of sample (with replacement) were removed from each vessel. Samples were removed after every 5 min for 45 min. Sample w ere filtered through a nylon membrane filter (0.45 μm, 25 mm), 2.5 ml of filtrate were diluted to 5 ml with mobile phase and analyzed by the proposed method. The amount of tenatoprazole in the test samples were calculated as per- centage dissolved, from the measured peak area for the test samples by using Equation (1). Alternatively area of sample were calculated and compared it with the peak area for the standard (std.) solution using Equation (2). Dissolved (%) = (Conc. calculated by using linear equation × 900/DL) (1) Dissolved (%) = (900/DL) × (Peak Area (sample)/Peak Area (std.)) × Conc. (std.) × 100 (2) where DL = drug load, which is 20 mg of tenatoprazole. 2.7. Method Specificity (Forced Degradation Study) Forced degradation of the drug and drug product were carried out under thermolytic, photolytic, acid/base hy- drolytic and oxidative stress conditions. For photolytic stress, drug product in the solid state were irradiated with UV radiation at 254 and 366 nm. The UV dose from the lamp at 366 nm were measured by use of a quinine mo- nohydrochloride (2% solution in water) chemical acti- nometer as mentioned in the ICH guidelines [10]. Mini- mum desired exposure (200 Wh/m2) were observed after irradiation for 26 h. A second photolytic stres s test expe- riment with greater irradiation time, 52 h, were per- formed to establish the specificity of the method. Sample solution containing 2000 mg·mL−1 were subjected to selected stressed conditions, appropriately diluted and injected into column. Samples except for photo oxidation were protected from light. For acid, base and water-in- duced degradation solutions containing 2000 mg·mL−1 of the drug were prepared in 0.1N HCl, 0.1N NaOH and water, heated on constant water bath at 80˚C and ana- lyzed after 1, 2 and 12 h exposure, respectively. For oxidative degradation solution were prepared in water containing 30% v/v of H2O2, heated on constant water bath at 80˚C and analysed after 1 h. 2.8. Photochemical Degradation an d D r y Heat Degradation Photochemical stability of the drug were studied by ex- posing stock solution (2000 µg·mL−1) as well as solid drug to short UV and long UV radiations for 26 h and were used. For dry heat degradation drug in solid form were placed in oven at 60˚C for 8 hours and used to pre- pare solution. The solutions were diluted with mobile phase to have 80 µg·mL−1 and 20 µL of the solution were injected into the system. 3. Results and Discussion 3.1. Optimization of the Chromatographic Conditions (Method Development) The HPLC procedure were optimized with a view to de- velop stability-indicating assay method. Pure drug along with its degraded products were injected and run in dif- ferent solvent systems. Initially methanol and water in different ratios were tried. It were found that when me- thanol concentration were increased in the mobile phase, the degradation product started to elute in dead volume. Hence concentration of methanol was decreased and there was improvement in resolution. It was found that mobile phase consisting of methanol: THF: acetate buf- fer (68:12:20 v/v) pH adjusted to 6.0 with acetic acid, flow rate were 1.0 mL·min−1 gives acceptable retention time of 3 min. (tR), theoretical plates and good resolution of drug and degradation products (Figure 2). 0.00 0.50 1.00 1.50 2.00 2.50 3.00 3.50 4.00 4.50 5.00 5.50 6.00 Figure 2. Tenatoprazole 100 μg·mL−1 standard chromatogram.  S. R. DHANESHWAR ET AL. Copyright © 2011 SciRes. AJAC Well defined symmetrical peaks were obtained upon measuring the response of eluent under the optimized conditions after thorough experimental trials. Two col- umns were used for performance investigations, includ- ing Kromasil C18 (4.6 × 250 mm, 5 micron) and Symme- try C18 (4.6 × 250 mm, 5 micron), Symmetry C18 showed broad, unsymmetrical peak therefore it were replaced with Kromasil C18 column which produced symmetrical peaks with good resolution. The UV detector response of tenatoprazole was studied and the best wavelength was found to be 3 07 nm showing highe s t sensiti vi ty. 3.2. Method Validation The method was validated, in accordance with ICH guidelines, for linearity, range, accur acy, precision, LOD and LOQ, specificity, ruggedness and robustness [11]. 3.2.1. Linearity and Range For the construction of calibration curves, seven calibra- tion standard solutions were prepared over the concen- tration range. Linearity was determined for tenatoprazole in the range of 0.5 - 160 µg· mL−1. The correlation coeffi- cient (‘r2’) values were >0.999 (n = 6). Typically, the regression equations for the calibration curve was found to be y = 68800 × (−77500) (Figure 2). 3.2.2. For mulati on Analysis an d Ac c u racy System suitability test were perfo rmed every time before formulations analysis (Table 1). Formulations were ana- lysed as described in experimental section. Assay values were (100 ± 0.8)% for both the formulations accuracy of the method were calculated by recovery studies at three levels by standard addition method. Results of formula- tion analysis and accuracy studies are presented in Table 2. 3.2.3. Precision The precision of repeatability were studied by replicate (n = 6) analysis of tablet solutions. The precision was also studied in terms of intr a-day changes in peak area of drug solution on the same day and on three diff er ent days over a period of one week. The intra-day and inter-day variation were calculated in terms of percentage relative standard deviation and the results are summarized in Table 3. 3.2.4. Limit of Detection (LOD) and Limit of Quantitation (LOQ) The LOD and LOQ values were found to be 0.49 and 1.50 μg·mL−1, respectively. Low values of these parame- ter indicates sensitivity of the method. 3.2.5. R obu stness Robustness was studied as described in Section 2.5, % R.S.D. of assay was calculated for each condition. The degree of reproducibility of the results obtained as a re- sult of small deliberate variations in the method parame- ters has proven that the method is robust and the results are summarized in Table 4. Table 1. System suitability parameters. Parameter Values ± SD No of theoretical plates (SD ) 2670 ± 30 USP Tailing Factor (SD ) 1.38 ± 0.02 Capacity factor 2.8 ± 0.02 Typical Peak Purity angle 0.121 Typical Purity threshold 0.245 Table 2. Results of tablet analysis and accuracy studies. Tablet Label Claim Formulation Study (n = 6) Recovery (accuracy) Study (n = 3) Tablet Batch % Assay Found, % RSD Recovery Level % Recovery, % RSD Tenatoprazole 20mg SAP 1101, 99.74, 1.05 50 99.68, 0.67 SAP 1102 100.61, 1.23 100 10 0 .10, 0.24 150 101.83, 0.56 Table 3. Result of pre cision study. Precision Study Parameter Estimated amount, % RSD at selected concentration level 10 µg·mL−1 80 µg·mL−1 150 µg·mL−1 Repeatability, n = 6 100.2, 0.38 101.4, 0.33 99.5, 0.25 Intra-day, n = 3 100.8, 0.55 99.6, 0.51 101.2, 0. 29 Inter-day, n = 3 98.9, 1.13 101.3, 0.76 99.5, 0. 85 Analyst, n = 3 99.5, 0.38 100. 4, 1.06 100.6, 0. 45 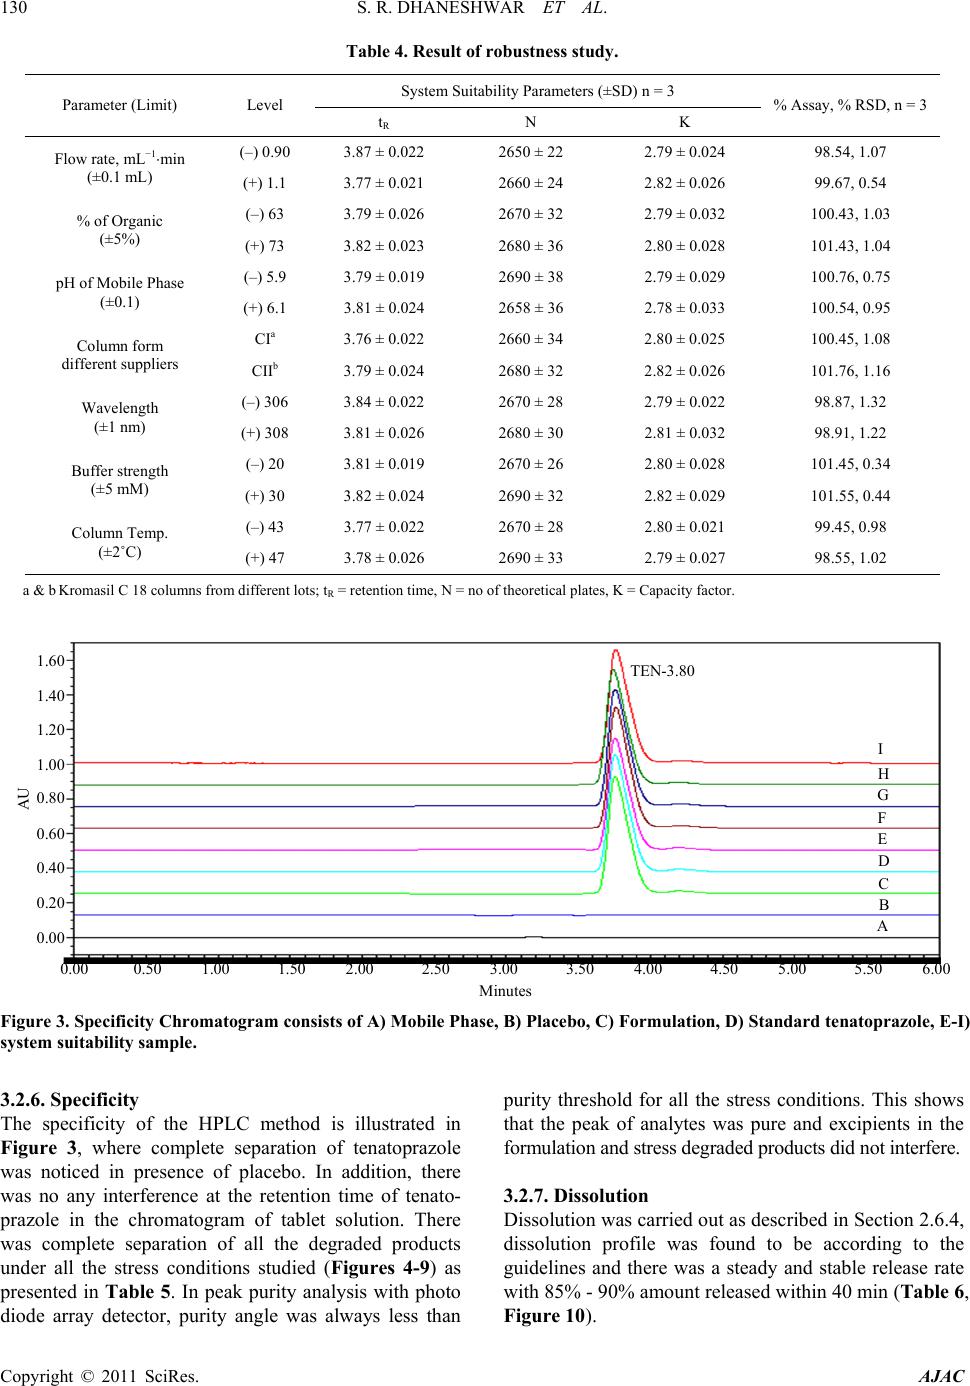 S. R. DHANESHWAR ET AL. Copyright © 2011 SciRes. AJAC Table 4. Result of robust ness study. Parameter (Limit) Level System Suitability Parameters (±SD) n = 3 % Assay, % RSD, n = 3 tR N K Flow rate, mL−1⋅min (±0.1 mL) (–) 0.90 3.87 ± 0.022 2650 ± 22 2.79 ± 0.024 98.54, 1.07 (+) 1.1 3.77 ± 0.021 2660 ± 24 2.82 ± 0.026 99.67, 0.54 % of Organic (±5%) (–) 63 3.79 ± 0.026 2670 ± 32 2.79 ± 0. 0 3 2 100.43, 1.0 3 (+) 73 3.82 ± 0.023 2680 ± 36 2.80 ± 0.028 101.43, 1.04 pH of Mobile Phase (±0.1) (–) 5.9 3.79 ± 0.019 2690 ± 3 8 2.79 ± 0.029 100.76, 0.75 (+) 6.1 3.81 ± 0.024 2658 ± 36 2.78 ± 0.033 100.54, 0.95 Column form different suppliers CIa 3.76 ± 0.022 2660 ± 34 2.80 ± 0.025 100.45, 1.08 CIIb 3.79 ± 0.024 2680 ± 32 2.82 ± 0.026 101.76, 1. 1 6 Wavelength (±1 nm) (–) 306 3.84 ± 0.022 2670 ± 28 2.79 ± 0.022 98.87, 1.32 (+) 308 3.81 ± 0.026 2680 ± 3 0 2.81 ± 0.032 98.91, 1.22 Buffer strength (±5 mM) (–) 20 3.81 ± 0.019 2670 ± 26 2.80 ± 0.028 101.45, 0.34 (+) 30 3.82 ± 0.024 2690 ± 32 2.82 ± 0.029 101.55, 0.44 Column Tem p. (±2˚C) (–) 43 3.77 ± 0.022 2670 ± 28 2.80 ± 0.021 99.45, 0.98 (+) 47 3.78 ± 0.026 2690 ± 33 2.79 ± 0.027 98.55, 1.02 a & b Kromasil C 18 col umns from different l ot s; tR = retention time, N = no of theoretica l pl ates, K = Capacity factor. 0.00 0.50 1.00 1.50 2.00 2.50 3.00 3.50 4.00 4.50 5.00 5.50 6.00 Figure 3. Specificity Chromatogram consists of A) Mobile Phase, B) Placebo, C) Formulation, D) Standard tenatoprazole, E-I) system suitability sample. 3.2.6. Specificity The specificity of the HPLC method is illustrated in Figure 3, where complete separation of tenatoprazole was noticed in presence of placebo. In addition, there was no any interference at the retention time of tenato- prazole in the chromatogram of tablet solution. There was complete separation of all the degraded products under all the stress conditions studied (Figures 4-9) as presented in Table 5. In peak purity analysis with photo diode array detector, purity angle was always less than purity threshold for all the stress conditions. This shows that the peak of analytes was pure and excipients in the formulati on and st re ss de graded prod uct s di d not i nterfere. 3.2.7. Di s solution Dissolution was carried out as described in Section 2.6.4, dissolution profile was found to be according to the guidelines and there was a steady and stable release rate with 85% - 90% amount released within 40 min (Tabl e 6 , Figure 10). 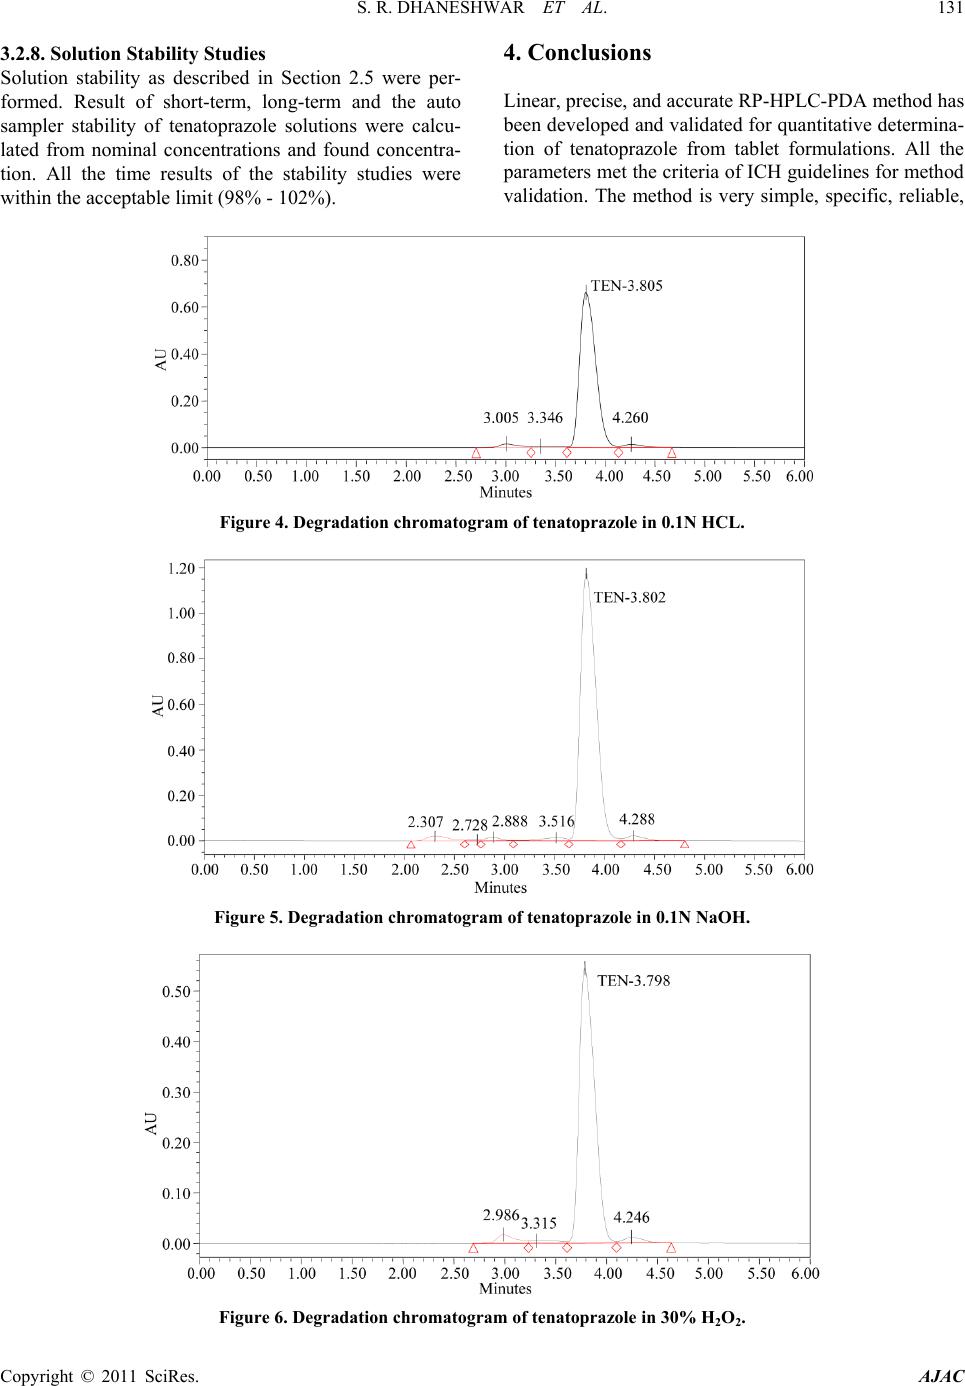 S. R. DHANESHWAR ET AL. Copyright © 2011 SciRes. AJAC 3.2.8. Sol ution Stability Studies Solution stability as described in Section 2.5 were per- formed. Result of short-term, long-term and the auto sampler stability of tenatoprazole solutions were calcu- lated from nominal concentrations and found concentra- tion. All the time results of the stability studies were within the acceptable limit (98% - 102%). 4. Conclusions Linear, precise, and accurate RP-HPLC-PDA method has been developed and validated for quantitative determina- tion of tenatoprazole from tablet formulations. All the parameters met the criteria of ICH guidelines for method validation. The method is very simple, specific, reliable, Figure 4. Degradation chromatogram of tenatoprazole in 0.1N HCL. Figure 5. Degradation chromatogram of tenatoprazole in 0.1N NaOH. Figure 6. Degradation chromatogram of tenatoprazole in 30% H2O2.  S. R. DHANESHWAR ET AL. Copyright © 2011 SciRes. AJAC 0.00 0. 50 1.00 1.50 2.00 2.50 3.00 3.50 4.00 4.50 5.00 5.50 6.00 Figure 7. Degradation chromatogram of tenatoprazole at short UV range (254 nm). 0.00 0.50 1.00 1.50 2.00 2.50 3.00 3.50 4.00 4.50 5.00 5.50 6.00 Figure 8. Degradation chromatogram of tenatoprazole at long UV range (366 nm). 0.00 0.50 1.00 1.50 2.00 2.50 3.00 3.50 4.00 4.50 5.00 5.50 6.00 Figure 9. Degradation chromategram of tenatoprazole at dry heat degradation 50˚C for 4 hrs. 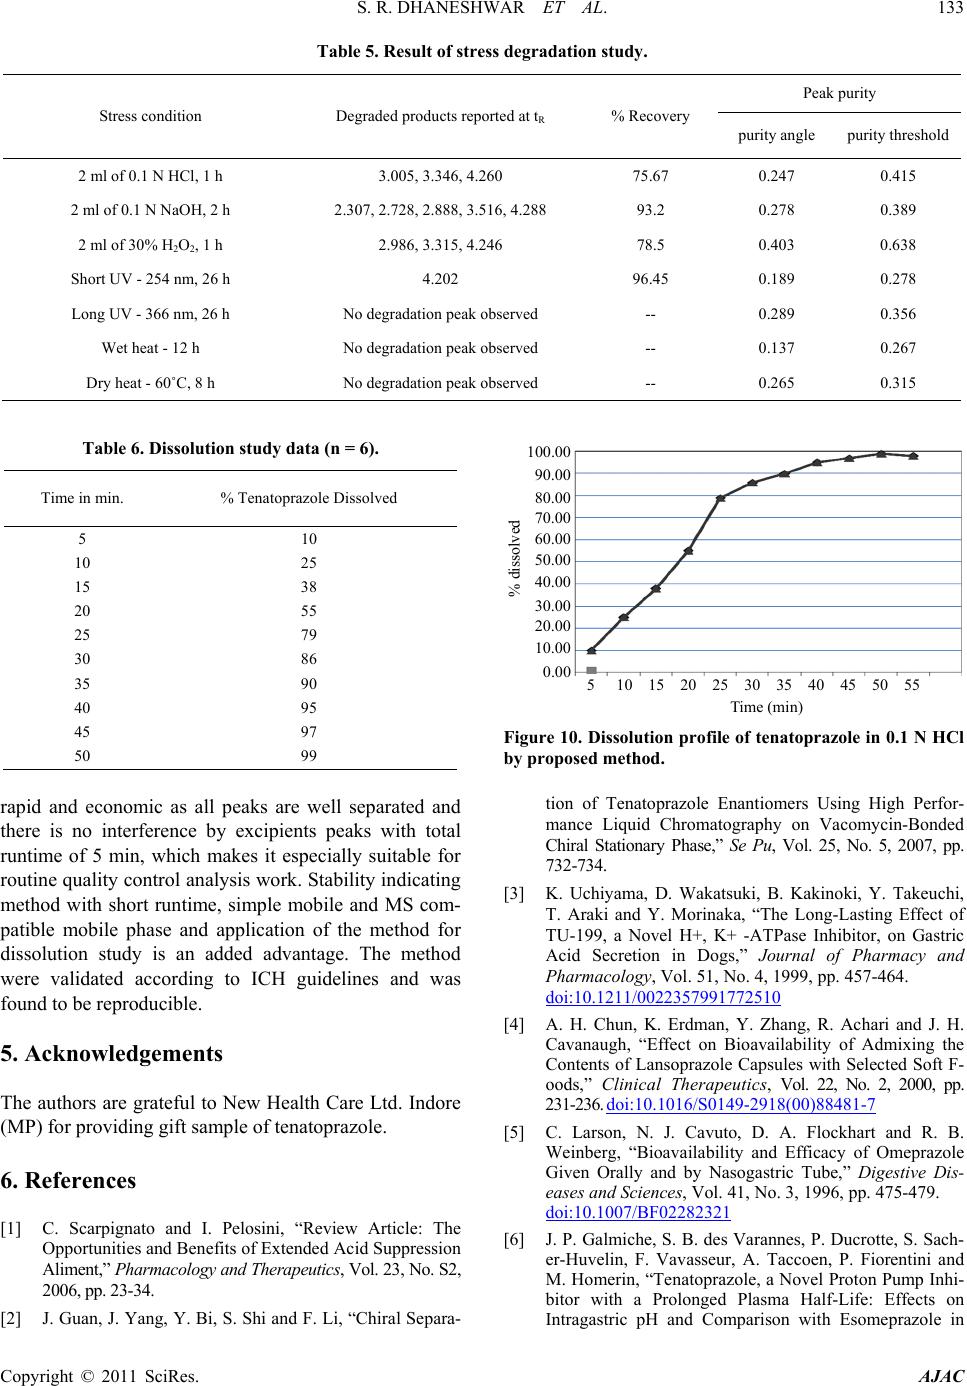 S. R. DHANESHWAR ET AL. Copyright © 2011 SciRes. AJAC Table 5. Result of stress degradation study. Stress condition Degraded products reported at tR % Recovery Peak purity purity angle purity threshold 2 ml of 0.1 N HCl, 1 h 3.005, 3.346, 4.260 75.67 0.247 0.415 2 ml of 0.1 N NaOH, 2 h 2.307, 2.728, 2.888, 3.516, 4.288 93.2 0.278 0.389 2 ml of 30% H2O2, 1 h 2.986, 3.315, 4.246 78.5 0.403 0.638 Short UV - 254 nm, 26 h 4.202 96.45 0.189 0.278 Long UV - 366 nm, 26 h No degradation peak observed -- 0.289 0.356 Wet heat - 12 h No degradation peak observed -- 0.137 0.267 Dry heat - 60˚C, 8 h No degradation peak observed -- 0.265 0.315 Table 6. Dissolution study data (n = 6). Time in min. % Tenatoprazole Dissolved 5 10 10 25 15 38 20 55 25 79 30 86 35 90 40 95 45 97 50 99 5 10 15 20 25 30 35 40 45 50 55 Figure 10. Dissolution pr ofile of tenatoprazole in 0.1 N HCl by propose d m et hod . rapid and economic as all peaks are well separated and there is no interference by excipients peaks with total runtime of 5 min, which makes it especially suitable for routine quality control an alysis work. Stability indicating method with short runtime, simple mobile and MS com- patible mobile phase and application of the method for dissolution study is an added advantage. The method were validated according to ICH guidelines and was found to be reproducible. 5. Acknowledgements The authors are grateful to New Health Care Ltd. Indore (MP) for p rovidin g gift sam pl e o f te na toprazole. 6. References [1] C. Scarpignato and I. Pelosini, “Review Article: The Opportunities and Benefits of Extended Acid Suppression Aliment,” Pharmacology and Therapeutics, Vol. 23, No. S2, 2006, pp. 23-34. [2] J. Guan, J. Yang, Y. Bi, S. Shi and F. Li, “Chira l Separa- tion of Tenatoprazole Enantiomers Using High Perfor- mance Liquid Chromatography on Vacomycin-Bonded Chiral Stationary Phase,” Se Pu, Vol. 25, No. 5, 2007, pp. 732-734. [3] K. Uchiyama, D. Wakatsuki, B. Kakinoki, Y. Takeuchi, T. Araki and Y. Morinaka, “The Long-Lasting Effect of TU-199, a Novel H+, K+ -ATPase Inhibitor, on Gastric Acid Secretion in Dogs,” Journal of Pharmacy and Pharmacology, Vol. 51, No. 4, 1999, pp. 457-464. doi:10.1211/0022357991772510 [4] A. H. Chun, K. Erdman, Y. Zhang, R. Achari and J. H. Cavanaugh, “Effect on Bioavailability of Admixing the Contents of Lansoprazole Capsules with Selected Soft F- oods,” Clinical Therapeutics, Vol. 22, No. 2, 2000, pp. 231-236. doi:10.1016/S0149-2918(00)88481-7 [5] C. Larson, N. J. Cavuto, D. A. Flockhart and R. B. Weinberg, “Bioavailability and Efficacy of Omeprazole Given Orally and by Nasogastric Tube,” Digestive Dis- eases and Sciences, Vol. 41, No. 3, 1996, pp. 475-479. doi:10.1007/BF02282321 [6] J. P. Galmiche, S. B. des Varannes, P. Ducrotte, S. Sach- er-Huvelin, F. Vavasseur, A. Taccoen, P. Fiorentini and M. Homerin, “Tenatoprazole, a Novel Proton Pump Inhi- bitor with a Prolonged Plasma Half-Life: Effects on Intragastric pH and Comparison with Esomeprazole in  S. R. DHANESHWAR ET AL. Copyright © 2011 SciRes. AJAC Healthy Volunteers,” Aliment Pharmacology and Thera- peutics, Vol. 19, No. 6, 2004, pp. 655-662. doi:10.1111/j.1365-2036.2004.01893.x [7] R. Nirogi, V. Kandikere, K. Mudigonda and G. Bhyra- puneni, “Quantification of Tenatoprazole in Rat Plasma by HPLC: Validation and Its Application to Pharmacoki- netic Studies,” Biomedical Chromatography, Vol. 21, No. 12, 2007, pp. 1240-1244.doi:10.1002/bmc.875 [8] P. Liu, B. Sun, X. L u, F. Qin and F. Li, “HPLC Determi- nation and Pharmacokinetic Study of Tenatoprazole in Dog Plasma af ter Oral Administration of Enteric-Coated Capsule,” Biomedical Chromatography, Vol. 21, No. 1, 2007, pp. 89-93. doi:10.1002/bmc.724 [9] F. Domagala, H. Ficheux, G. Houin and J. Barre, “Phar- macokinetics of Tenatoprazole, a Newly Synthesized proton Pump Inhibitor, in Healthy Male Caucasia n Vlun- teers,” Arzneimittel Forschung, Vol. 56, 2006, pp. 33-39. [10] M. Mahadik, V. Bhusari, M. Kulkarni and S. Dhaneshwar, “LC-UV and LC-MS Evaluation of Stress Degradation Behavior of Tenatoprazole,” Journal of Pharmaceutical and Biomedical Analysis, Vol. 50, No. 5, 2009, pp. 787-793. doi:10.1016/j.jpba.2009.06.026 [11] ICH, “Q2 (R1) Validation of Analytical Procedures: Text and Methodology,” International Conference on Harmo- nization, Geneva, November 2005, pp. 1-13. [12] P. Lindberg, A. Brandstrom, B. Wallmark, H. Mattsson, L. Rikner and K. J. Hoffmann, “Omeprazole: The First Proton Pump Inhibitor,” Medical Care Research and Re- view, Vol. 10, No. 1, 1990, pp. 1-54.
|