Journal of Computer and Communications, 2013, 1, 27-31
Published Online December 2013 (http://www.scirp.org/journal/jcc)
http://dx.doi.org/10.4236/jcc.2013.17007
Open Access JCC
27
The Design of Fiber Bragg Gr atin g Temp era tu re
Measurement System Based on Labview*
Peng Gao1, Shengpeng Wan1, Yuhua Xiong1#, Fangyu Hu1, Haiming Wen2, Yuanding Ma1
1Laboratory of Optical Fiber Sensing, Nanchang Hangkong University, Nanchang, China; 2Department of Electronic Engineering,
Jiangxi Vocational Technical College of Industrial Engineering, Pingxiang, China.
Email: #wan_xxq@126.com
Received September 2013
ABSTRACT
The paper made a research on the fiber Bragg grating sensor demodulation system, which was based on virtual instru-
ment labview and it developed a friendly upper monitor software. Based on the LM algorithm, the software realized
rapid and accurate spectral data fitting, improving dynamic characteristics and measuring precision of the system. De-
pending on different fiber Bragg grating sensors, it can realize flexible calibration. It has the functions of collection,
display and data storage, which can flexibly design alarm threshold according to the practical application. The fiber
Bragg grating sensors can be identified by the software so that the distributed network, with large capacity optical fiber
sensing, can be achieved.
Keywords: Optical Fiber Sensing; Labview; Temperature Measurement; Upper Monitor
1. Introduction
Fiber Bragg grating (FBG) sensors have attracted consi-
derable research interests due to their encoded characters,
anti-interference ability and capability of large—scale
multiplexing [1]. As a new kind of optical passive com-
ponents, FBG has the characteristics of high signal-to-
noise, low loss and wide measuring range [2]. The re-
sonance wavelength and amplitude are quite sensitive to
the change of external parameters, such as the tempera-
ture [3], Lateral load [4], bending [5] and environment
refractive index [6].
The upper monitor is a computer, which can send spe-
cific controlling command. By manipulating predefined
command, it passes the command to the lower computer,
which, according to the instruction, simply processes the
gathered data and then through the USB interface sends it
to PC, the host computer [7], to realize the functions of
analysis showed and data storage on it. Nowadays, the
fiber Bragg grating sensor demodulation platform can be
completed by development tools, such as Visual C++,
Delphi and Labview to realize data transmission, file
writing and readi ng, int er face showed, aut omati cal ly saved
and other functions and ultimately achieve multi-func-
tional PC software.
Labview is developed by NI company sited in the
United States. With a powerful data processing and pro-
gramming function, it is a system combining a high per-
formance hardware module and a flexible software to
accomplish test and measurement tasks. Labview pro-
vides an integration module, with a large amount of data,
including collection, analysis, display and storage [8], so
that it greatly alleviates the complexity of programming.
On the computer platform, users can design the test in-
strument system according to their own requirements. In
order to do complex design, it becomes the main means
for test and measurement system to do data acquisition,
test, analysis and so on. We will complete the software
design of the fiber Bragg grating sensor demodulation
system by Labview, and achieves functions of data ac-
quisition, display, saves and warning, etc.
2. The Idea of Fiber Bragg Grating Sensor
Demodulation System
As shown in Figure 1, broadband light (1525 nm to 1565
nm) from ASE arrives in the series of grating through the
optical circulator, from which the reflected light reaches
demodulation module again through the optical circulator.
The demodulation device of this system is based on vo-
*
This work was su pported by the National Natural Scie nce Foundation
of China under grant No.61067005, the Key Project of Chinese Minis-
try of Education under grant No.210119, the Aviation Science Founda-
tion under Grant No. 2010ZA56001, and by the Key Laboratory of
Nondestructive Testing (Ministry of Education), Nanchang Hangkong
University under grant No. ZD200929008.
#Correspondi ng author.
The Design of Fiber Bragg Grating Temperature Measurement System Based on Labview
Open Access JCC
28
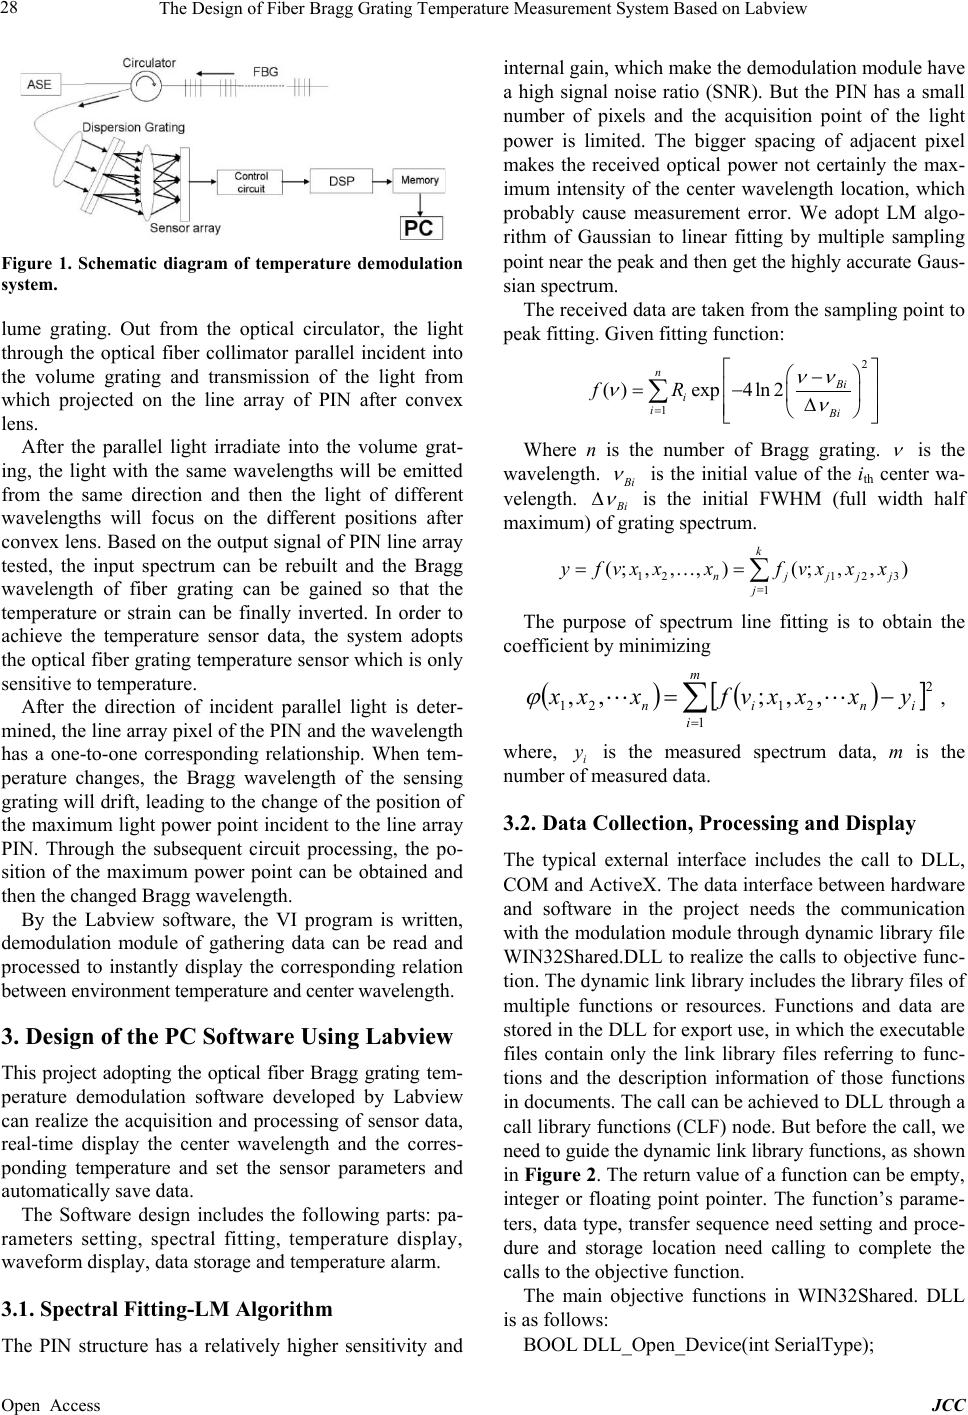
Figure 1. Schematic diagram of temperature demodulation
system.
lume grating. Out from the optical circulator, the light
through the optical fiber collimator parallel incident into
the volume grating and transmission of the light from
which projected on the line array of PIN after convex
lens.
After the parallel light irradiate into the volume grat-
ing, the light with the same wavelengths will be emitted
from the same direction and then the light of different
wavelengths will focus on the different positions after
convex lens. Based on the output signal of PIN line array
tested, the input spectrum can be rebuilt and the Bragg
wavelength of fiber grating can be gained so that the
temperature or strain can be finally inverted. In order to
achieve the temperature sensor data, the system adopts
the optical fiber grating temperature sensor which is on ly
sensitive to temperature.
After the direction of incident parallel light is deter-
mined, the line array pixel of the PIN and the wavelength
has a one-to-one corresponding relationship. When tem-
perature changes, the Bragg wavelength of the sensing
grating will drift, leading to the change of the position of
the maximum light power point incident to the line array
PIN. Through the subsequent circuit processing, the po-
sition of the maximum power point can be obtained and
then the changed Bragg wavelength.
By the Labview software, the VI program is written,
demodulation module of gathering data can be read and
processed to instantly display the corresponding relation
between environment temperature and center wavelength.
3. Design of the PC Software Using Labview
This project adopting the optical fiber Bragg grating tem-
perature demodulation software developed by Labview
can realize the acquisition and processing of sensor data,
real-time display the center wavelength and the corres-
ponding temperature and set the sensor parameters and
automatically save data.
The Software design includes the following parts: pa-
rameters setting, spectral fitting, temperature display,
waveform display, data storage and temperature alarm.
3.1. Spectral Fitting-LM Algorithm
The PIN structure has a relatively higher sensitivity and
internal gain, which make the demodulation module have
a high signal noise ratio (SNR). But the PIN has a small
number of pixels and the acquisition point of the light
power is limited. The bigger spacing of adjacent pixel
makes the received optical power not certainly the max-
imum intensity of the center wavelength location, which
probably cause measurement error. We adopt LM algo-
rithm of Gaussian to linear fitting by multiple sampling
point near the peak and then get the highly accurate Gaus-
sian spectrum.
The received data are taken from the sampling point to
peak fitting. Given fitting function:
2
1
()exp4ln 2
nBi
i
iBi
fR
νν
νν
=



=− 



Where n is the number of Bragg grating.
ν
is the
wavelength.
Bi
ν
is the initial value of the ith center wa-
velength.
Bi
ν
is the initial FWHM (full width half
maximum) of grating spectrum.
121 23
1
(;,, , )(;,,)
k
njjj j
j
yfvx xxfvxxx
=
= …=
The purpose of spectrum line fitting is to obtain the
coefficient by minimizing
() ()
[ ]
=
−=
m
iinin
yxxxvfxxx
1
2
2121
,,;,, 
ϕ
,
where,
is the measured spectrum data, m is the
number of measured da ta.
3.2. Data Collection, Processing and Display
The typical external interface includes the call to DLL,
COM and ActiveX. The data interf ace between hardware
and software in the project needs the communication
with the modulation module through dynamic library file
WIN32Shared.DLL to realize the calls to objective func -
tion. The dynamic link library includes the library files of
multiple functions or resources. Functions and data are
stored in the DLL for export use, in which the executable
files contain only the link library files referring to func-
tions and the description information of those functions
in documents. The call can be achieved to DLL through a
call library function s (CLF) node. But before the call, w e
need to guide the dynamic link library functions, as shown
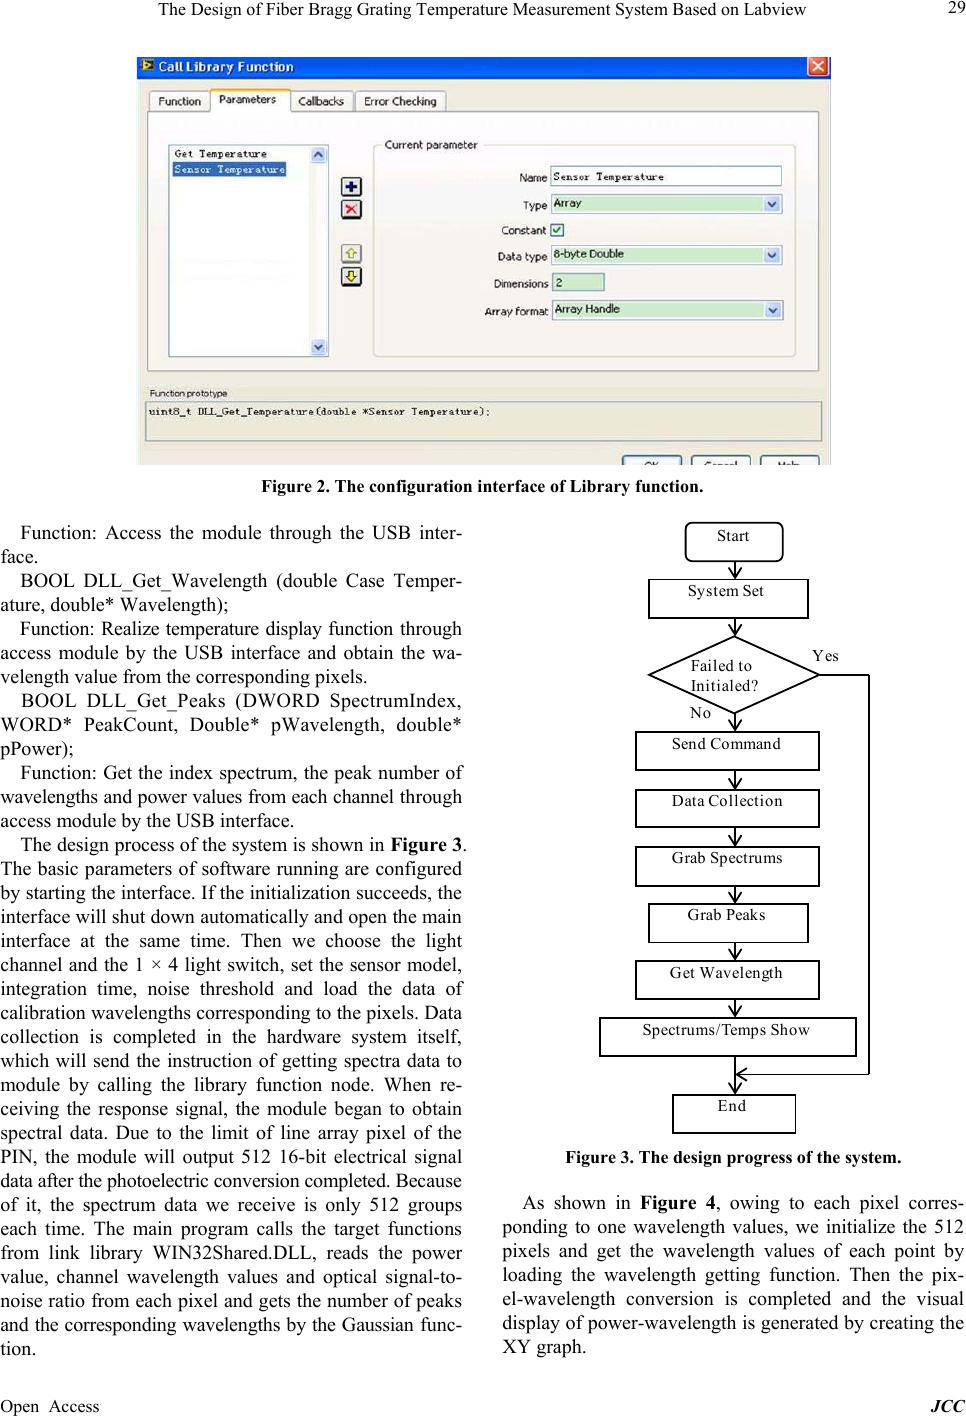
in Figure 2. The return value of a function can be empty,
integer or floating point pointer. The function’s parame-
ters, data type, transfer sequence need setting and proce-
dure and storage location need calling to complete the
calls to the objective function.
The main objective functions in WIN32Shared. DLL
is as follows:
BOOL DLL_Open_Device(int SerialType);
The Design of Fiber Bragg Grating Temperature Measurement System Based on Labview
Open Access JCC
29
Figure 2. The configuration interface of Library function.
Function: Access the module through the USB inter-
face.
BOOL DLL_Get_Wavelength (double Case Temper-
ature, double* Wa ve l ength);
Function: Realize temperature display function through
access module by the USB interface and obtain the wa-
velengt h va lue from the corre spondin g pixels.
BOOL DLL_Get_Peaks (DWORD SpectrumIndex,
WORD* PeakCount, Double* pWavelength, double*
pPower);
Function: Get the index spectrum, the peak number of
wavelengths and power values from each channel through
access module by the USB interface.
The design process of the system is shown in Figure 3.
The basic parameters of software running are configured
by starting the interface. If the initializat ion succeeds, th e
interface will shut down automatically and open the main
interface at the same time. Then we choose the light
channel and the 1 × 4 light switch, set the sensor model,
integration time, noise threshold and load the data of
calibration wavelengths corresponding to the pixels. Data
collection is completed in the hardware system itself,
which will send the instruction of getting spectra data to
module by calling the library function node. When re-
ceiving the response signal, the module began to obtain
spectral data. Due to the limit of line array pixel of the
PIN, the module will output 512 16-bit electrical signal
data after the photoelectric conversion completed. Because
of it, the spectrum data we receive is only 512 groups
each time. The main program calls the target functions
from link library WIN32Shared.DLL, reads the power
value, channel wavelength values and optical signal-to-
noise ratio from each pixel and gets the number of peaks
and the corresponding wavelengths by the Gaussian func-
tion.
Figure 3. The design progress of the system.
As shown in Figure 4, owing to each pixel corres-
ponding to one wavelength values, we initialize the 512
pixels and get the wavelength values of each point by
loading the wavelength getting function. Then the pix-
el-wavelength conversion is completed and the visual
display of power -wavelength is generated by creating the
XY graph.
System Set
Start
F ai led t o
Initialed?
S en d Comm and
Da ta C ollection
Gr ab S pectr ums
Grab P eaks
Ge t Wave lengt h
S pec tru ms /Temps S how
End
Yes
No
The Design of Fiber Bragg Grating Temperature Measurement System Based on Labview
Open Access JCC
30
Figure 4. Ge t the data and peak program.
3.3. The Temperature Calibration of the Sensor
Through the calibration experiment of temperature in the
temperature control box, the grating characteristic curve
is obtained by the fitting of wavelength and temperature
data. And then the temperature characteristic equation is
written in the program. As shown in Figure 5, in the
configuration panel interface, we set temperature calibra-
tion parameters and load the coefficient of temperature,
wavelength of calibration and temperature of calibration.
After processing the FBG temperature characteristic
equation, the center wavelength can be converted to the
environmental temperature. After the fiber grating is re-
placed, temperature calibration parameters can be reloaded
by the same means, which can realize flexible calibration
processing on temperature.
3.4. Sensor Identification and Thresh old Value
Warning
Because the grating sensor has a certain bandwidth with-
in the scope of effective temperature, the wavelength
characteristics of the adjacent sensors need to have an
interval at least 2 nm. After reading the peak wavelength,
the application can automatically choose the range of
center wavelength belonging to, and then select the cor-
responding temperature characteristic equation to trans-
form the wavelength data into temperature value. When
getting multiple grating series together, the program can
realize the demodulation of temperature in the same in-
terface but from different positions and gratings through
the selection function of distribution wavelength value.
As shown in Figure 6, the system of the program is
equipped with an alarm function. The temperature alarm
function displays being normal under the normal condi-
tion. When the measured temperature exceeds the set
threshold, the warning lights will automatically turn red
and the buzzer alarm.
Figure 5. The temperature calibration module.
Figure 6. The module of alarm function.
4. Temperature Demodulation System’s
Implementation and Verification
Build ing an exper imen tal p latfor m, two O ptica l fib er Bragg
grating temperature sensors are chosen in series to the
light path, the center wavelength of which are 1548.931
nm and 1544.652 nm. The software is used to complete
demodul a t ion proces s ing of sens i ng data.
As shown in Figure 7, the spectrum diagram clearly
shows the center wavelengths of two different gratings.
The number of the peak, the center wavelengths and opt-
ical power values in the form of a chart under the spec-
trum show that the center wavelengths of the two grat-
ings have occurred a certain drift. The temperatures of
the two corresponding gratings can be directly read out in
the right temperature display column, in which the above
corresponds to 1548.931 nm grating and the below cor-
The Design of Fiber Bragg Grating Temperature Measurement System Based on Labview
Open Access JCC
31
Figure 7. The main interface of temperature demodulation.
responds to 1544.652 nm grating. The alarm is set at a
temperature of 30˚C and the equipment displays being
nor ma l .
5. Conclusion
In reference to a large number of application examples,
we complete the research and design of sensor demodu-
lation system by utilizing the development platform of
the visual instrument Labview. The LM algorithm is
loaded in Labview, which completes the spectral data
accurate fitting and peak processing and in the mean-
while improves the measurement precision of the system.
Through the Internet communication with hardware de-
vices, the program achieves functions of data acquisition,
display and saves. According to practical applicatio n, the
alarm threshold value system can be flexibly designed.
By choosing different types of gratings applied to the
system, the flexible pr ocessing of temperature calibration
is completed. The identification function of the fiber
Bragg grating sensor achieves the temperature demodu-
lation of different gratings at the same time. The experi-
mental results show that the validity and accuracy of
demodulation system are verified, the design and imple-
mentation of which lay a solid foundation for the subse-
quent upgrade, de ve l opment and engineering practice.
REFERENCES
[1] J. He, F. Li, H. Xiao and Y.-L. Liu, “Fiber Bragg Grating
Sensor Array System Based on Digital Phase Generated
Carrier Demodulation and Reference Compensation Me-
thod,” Journal of Electronic Science and Technology of
China, Vol. 6, No. 4, 2008, pp. 389-392.
[2] X. L. Hu, D. K. Liang, T. Fang, Y. Wang and D. Li, “R e-
search on the Temperature Characteristics of Cascaded
Long Period Fiber Gratings,” Journal of Optoelectronics
Laser, Vol. 23, No. 9, 2012, pp. 1659-1664.
[3] L. A. Garcia-de-la-Rosa, L. Torres-Gómez and A. Martínez-
Ríos, “Temperature Impact on Mechanically Induced Long-
Period Fiber Gratings,” Optics and Lasers in Engineer,
Vol. 49, No. 6, 2011, pp. 714-717.
http://dx.doi.org/10.1016/j.optlaseng.2010.12.013
[4] H, Y, Liu, D. K. Liang and J. Zeng, “Long Period Fiber
Grating Transverse Load Effect-Based Sensor for Asphalt
Pavement Pressure Field Measurements,” Sensors and
Actuators A: Physical, Vol. 168, No. 2, 2011, pp. 262-266.
http://dx.doi.org/10.1016/j.sna.2011.04.009
[5] L. Y. Shao, L. Albane and S. Mateusz, “Highly Sensitive
Bend Sensor with Hybrid long-period and Titled Fiber
Bragg Grating,” Optics Communications, Vol. 283, No.
13, 2010, pp. 2690-2694.
http://dx.doi.org/10.1016/j.optcom.2010.03.013
[6] X. L. Jiang and Z. T. Gu, “Parameters Optimization ofπ-
Phase-Shifted Long Period Fiber Grating for Gas Sens-
ing,” Optoelectronics Letter, Vol. 7, No. 1, 2011, pp.
22-25. http://dx.doi.org/10.1007/s11801-011-0058-3
[7] C. Lu and P. H. Li, “Harmful Gas Alarming Device
Based on Virtual Instrument,” Chinese Journal of Elec-
tron Devices, Vol. 36, No. 4, 2013, pp. 559-563.
[8] M. X. Chen, L. Zhu, L. Zhang, Y. Liu and A. Wang,
“Data Processing Technique for Optical-Fiber Fourier
Transform Spectrometer Based on Labview,” Chinese
Journal of Scientific Instrument, Vol. 31, No. 3 2010, pp.
488-492.