Journal of Geoscience and Environment Protection
2013. Vol.1, No.3, 1-6
Published Online December 2013 in SciRes (http://www.scirp.org/journal/gep) http://dx.doi.org/10.4236/gep.2013.13001
Open Access 1
Characterization of Hydraulic Behaviours of
Coarse Rock Materials in a Large
Permeameter
Farzad Ferdos1, James Yang1,2, Anders Wörman1
1Hydraulic Engineering, Royal Institute of Technology (KTH), Stockholm, Sweden
2Principal Engineer, Vattenfall Research and Development (R&D), Älvkarleby, Sweden
Email: ferdos@kth.se
Received August 2013
The hydraulic behaviour of a rock material structure is a major feature for its design and safety assess-
ment. Similar to all other physical problems, in order to enclose the governing equations systems and
achieve a solution, the hydraulic characteristics of these materials need to be determined experimentally
and implemented then into adopted thermo-dynamical models. This paper covers the process of the design,
construction and operation of an experimental rig built for this specific purpose. Using the constructed
large-scale permeameter, tests have been conducted. The non-linear hydraulic behaviour of various mate-
rials under extreme turbulent conditions, where Reynolds number reaches unprecedented values, has not
been studied before. Preliminary results are presented and discussed.
Keywords: Experimental Study; Permeameter; Coarse Rock Material; Turbulent Flo w; Reynol ds Number
Introduction
Rock materials are used in constructing a wide range of in-
frastructures that have interaction with water. These structures
are used to control and manipulate water flow as well as to
provide water retention. The structural behaviour of these
structures is directly dependent on the interactions between the
granules and the flowing fluid through them. Therefore, in or-
der to calculate any structural response, a comprehensive un-
derstanding of hydraulic behaviour is needed. Among these
structures, embankment dams (rock-fill dams and downstream
zone of earth-fill dams) draw a lot of attention and many safety
recommendations and guidelines are continuously developed
nationwide to ensure the safety of these structures. This level of
attention is given to dams since they are massive infrastructures
built mostly of rock fill material and the consequences of their
failure could prove catastrophic both socially and economically
(ICOLD, 1987).
The equation most commonly used to describe the flow of a
fluid through a porous medium is Darcy’s law, in which the
flow is expressed as a linear relation between the head loss and
the fluid velocity, proportioned by hydraulic conductivity as the
media’s property, where the dynamic effects of the velocity are
neglected (Hansen et al., 2005). For flows through coarse rock-
fill materials, the wide gaps between the grains allow the flow
to reach higher velocities that enhance substantial dynamic
forces so that the linear viscosity-based models are not appro-
priate to accurately account for the physics of these turbulent
flows. As such, when analysing the hydraulic behaviour of
these course materials, the level of turbulence must be consid-
ered to establish the gradient fields and calculate any structural
response.
In spite of the numerous publications on the subject (Mc-
Couquodale & Hannoura, 1977), most studies cover the be-
haviour under moderate through-flow conditions and are con-
ducted on material smal ler in size than the actual mat erial used
in structures. These limitations make it uncertain to use these
studies results and their developed formulas to study a situation
where the material is relatively coarser and the pore Reynolds
number, due to a higher through flow, is a couple of orders of
magnitude higher than have been studied and observed. There-
fore, there is a need to investigate and conduct tests to study the
behaviour of coarser material under heavier and more turbulent
flow regimes.
This paper presents the process of design, construction and
operation of a large-scale permeameter built in Vattenfall Re-
search and Development (R&D) with the aim of fulfilling such
needs.
Permeameter Rig
The aim of this project was to design and construct a large-
scale robust permeameter to be able to explore extensive flow
conditions through various coarse rock materials and capture
the hydraulic behaviour in these critical circumstances.
The design process was intended to meet the following crite-
ria:
Carrying out permeability tests on the coarse rock-fill mate-
rials which are normally used in hydraulic structures-spe-
cificall y em ba nkment dams.
Carrying out tests for a broad range of flow magnitudes and
pressure gradients from near laminar to completely devel-
oped turbulent flow conditions to fully cover the property
ranges of material behaviour.
Carrying out extensively high-flow and pressure-gradient
experiments to replicate various possible critical and failure
mood flow conditions.
In order to account for and minimize the wall effects, various
F. FERDOS ET AL.
Open Access
2
guidelines regarding the magnitude of wall effects were con-
sidered. Dudgeon’s threshold with zone of higher velocity con-
cept (1966) was used to estimate the induced errors due to the
wall effect in the tests. The test unit of the permeameter column
was built with a larger diameter than the test material to mini-
mize these errors. The permeameter column was constructed to
be twice the length of the diameter to minimize size-effect er-
rors. A horizontal flow set-up was selected to keep a uniform
flow condition throughout the sample. The sample was fixed in
place inside the test unit of the permeameter in between two
metal grids in order to preserve a steady state condition by pre-
venting them from moving due to the induced forces. 8 metal
circular bars, 10 mm in diameter, are welded to the interior sur-
face of the testing unit, with a 200 mm gap in between. They
are installed to provide roughness, replicate the continuity of
the material, diminish the higher velocity zones’ extension,
distribute the loads over the length and prevent bulk move-
ments.
Figure 1 and Figu re 2 show schematic sketche s of the ap-
paratus with the dimensions and the structural units and Fig-
ure 3 illustrates photos taken from the rig and the test
Figure 1.
Permeameter units together with the dimensions.
Figure 2.
Illustration of rig design and set-up.
Figure 3.
Pictures of the rig, tested material and final assembling.
material during the set-up and the tests. As it is illustrated in the
figures, the permeameter is constructed from stainless steel
with 12.7 mm thickness in three sections.
Inlet unit: a funnel-shaped section with 276 mm - 1000 mm
in diameter and 2000 mm in length which connects the inlet
pipe coming from the pumping house to the main unit and dis-
perses the flow to get a more uniform flow condition entering
the sample.
Main unit: 2000 mm long and 1000 mm in diameter cylinder
containing the porous media which is fixed by two 50 mm thick
metal grids, of which one is fixed and the other is detachable.
Outlet unit: a funnel-shaped outlet unit with 1000 mm - 276
mm in diameter and 1000 mm length, which conduits the out-
coming flow from the sample to the outlet pipeline. This takes
the water back to the re-circulation basin.
The test rig was built in Vattenfall R&D laboratory located in
Älvkarleby, Sweden. This laboratory is equipped with several
constant head tanks and pumping units in which, for this rig,
two pumps, each with a flow capacity of 350 l/s with up to 30
m of water-head were used. Together these two pumps can
provide 350 l/s flow with up 120 m of water-head (in se ries) or
over 600 l/s with 30 m of water-head (in parallel). Water for the
testing is supplied from one of the storage basins with sufficient
storage capacity to enable continuous test conduction.
The permeameter was specifically designed to facilitate the
material loading and unloading processes. The procedure for
loading and unloading requires the main unit to rotate around
its axis (see Figure 2) and be fixed at any angle with the help of
the laboratory’s overhead crane and a cable jack anchored to
the floor below the apparatus. Using two motion devices to-
gether with a central axial support allows the device to be
safely manipulated during both the loading and unloading se-
quences.
The main unit of the permeameter is attached to an anchored
support structure. The inlet and outlet units are screwed to the
main unit before each test run and both sit on the supporting
structure. The metal supporting structure is fixed to the ground
to prevent deformations and movements.
Instrumentat ion
The installation and selection of the monitoring instruments
were planned to enable the pressure, bulk flow velocity and
temperature to be measured at any time during the tests. The
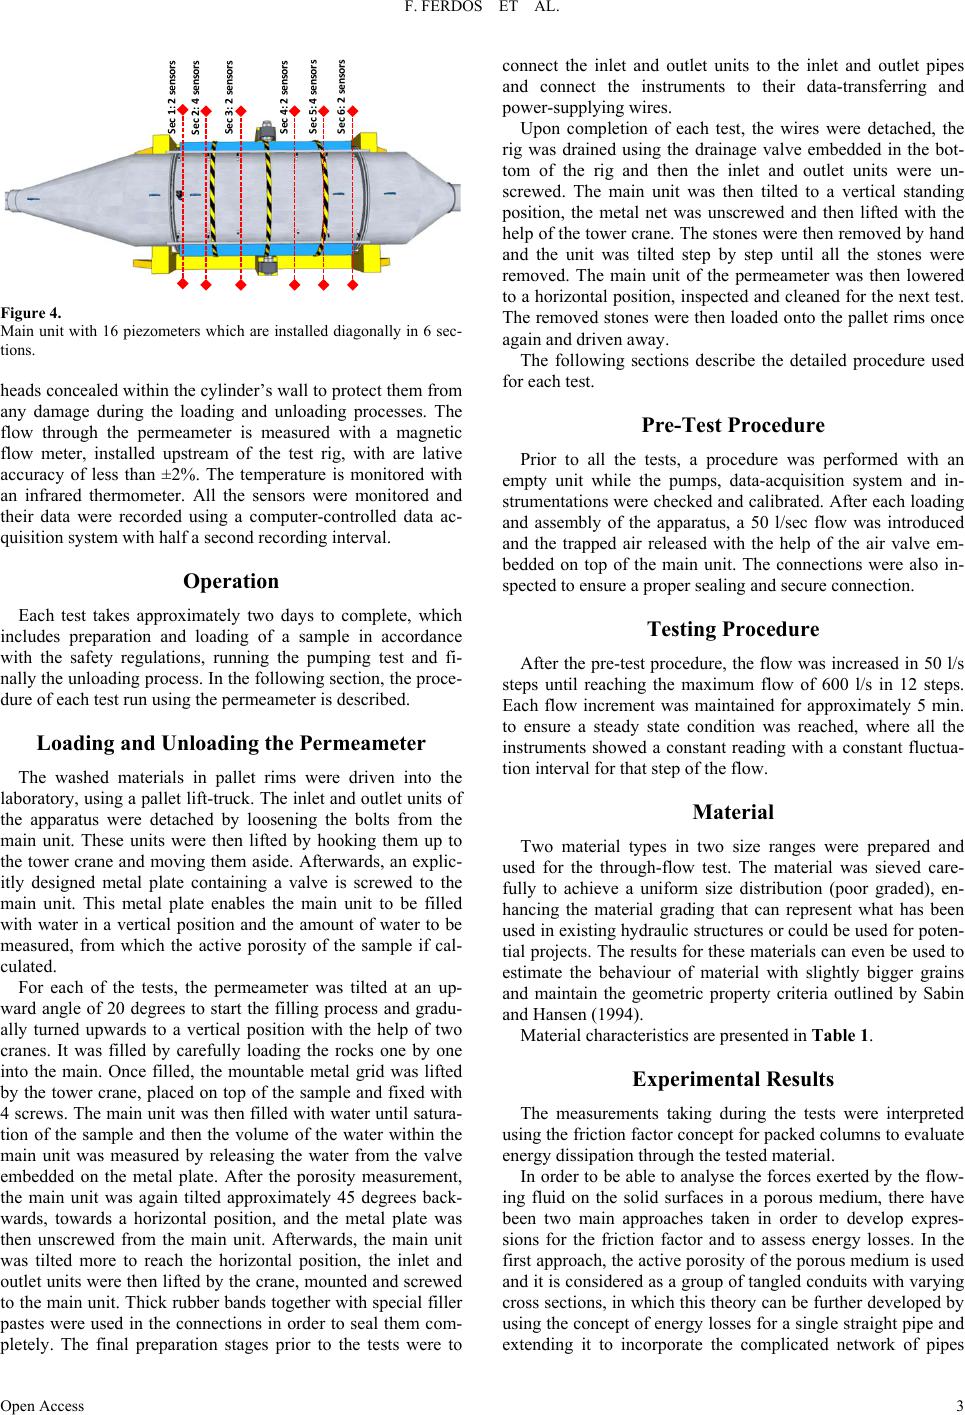
permeameter is equipped with 16 vibrating-wire piezometers at
6 sections along the main unit which contains the sample as
illustrated in Figure 4. The sensors are installed with their
Inlet Unit Main Unit Outlet Unit
Unit Parts Length
Diameter
Inlet pipe30 cm
276 mm
Deceleration cone150 cm276-1000 mm
Inlet section50 cm1000 mm
Inlet grid5 cm990 mm
Testing section190 cm1000 mm
outlet grid5cm 990 mm
Outlet section50 cm1000 mm
Acceleration cone50 cm1000-276 mm
outlet pipe30 cm276 mm
II: Main
I: Inlet
III: Outlet
Outflow Supporting base
Pump house
Pressure meters
Drainage valve
Air valve Rotation A xi s
Inf low
Hook
F. FERDOS ET AL.
Open Access
3
Figure 4.
Main unit with 16 p iezometers which are installed diagon ally in 6 sec-
tions.
heads concealed within the cylinder’s wall to protect them from
any damage during the loading and unloading processes. The
flow through the permeameter is measured with a magnetic
flow meter, installed upstream of the test rig, with are lative
accuracy of less than ±2%. The temperature is monitored with
an infrared thermometer. All the sensors were monitored and
their data were recorded using a computer-controlled data ac-
quisition system with half a second recording interval.
Operation
Each test takes approximately two days to complete, which
includes preparation and loading of a sample in accordance
with the safety regulations, running the pumping test and fi-
nally the unloading process. In the following section, the proce-
dure of each test run using the permeameter is described.
Loading and Unloading the Permeameter
The washed materials in pallet rims were driven into the
laboratory, using a pallet lift-truck. The inlet and outlet units of
the apparatus were detached by loosening the bolts from the
main unit. These units were then lifted by hooking them up to
the tower crane and moving them aside. Afterwards, an explic-
itly designed metal plate containing a valve is screwed to the
main unit. This metal plate enables the main unit to be filled
with water in a vertical position and the amount of water to be
measured, from which the active porosity of the sample if cal-
culated.
For each of the tests, the permeameter was tilted at an up-
ward angle of 20 degrees to start the filling process and gradu-
ally turned upwards to a vertical position with the help of two
cranes. It was filled by carefully loading the rocks one by one
into the main. Once filled, the mountable metal grid was lifted
by the tower crane, placed on top of the sample and fixed with
4 screws. The main unit was then filled with water until satura-
tion of the sample and then the volume of the water within the
main unit was measured by releasing the water from the valve
embedded on the metal plate. After the porosity measurement,
the main unit was again tilted approximately 45 degrees back-
wards, towards a horizontal position, and the metal plate was
then unscrewed from the main unit. Afterwards, the main unit
was tilted more to reach the horizontal position, the inlet and
outlet units were then lifted by the crane, mounted and screwed
to the main unit. Thick rubber bands together with special filler
pastes were used in the connections in order to seal them com-
pletely. The final preparation stages prior to the tests were to
connect the inlet and outlet units to the inlet and outlet pipes
and connect the instruments to their data-transferring and
power-supplying wires.
Upon completion of each test, the wires were detached, the
rig was drained using the drainage valve embedded in the bot-
tom of the rig and then the inlet and outlet units were un-
screwed. The main unit was then tilted to a vertical standing
position, the metal net was unscrewed and then lifted with the
help of the tower crane. The stones were then removed by hand
and the unit was tilted step by step until all the stones were
removed. The main unit of the permeameter was then lowered
to a horizontal position, inspected and cleaned for the next test.
The removed stones were then loaded onto the pallet rims once
again and driven away.
The following sections describe the detailed procedure used
for each test.
Pre-Test Procedure
Prior to all the tests, a procedure was performed with an
empty unit while the pumps, data-acquisition system and in-
strumentations were checked and calibrated. After each loading
and assembly of the apparatus, a 50 l/sec flow was introduced
and the trapped air released with the help of the air valve em-
bedded on top of the main unit. The connections were also in-
spected to ensure a proper sealing and secure connection.
Testing Proced ure
After the pre-test procedure, the flow was increased in 50 l/s
steps until reaching the maximum flow of 600 l/s in 12 steps.
Each flow increment was maintained for approximately 5 min.
to ensure a steady state condition was reached, where all the
instruments showed a constant reading with a constant fluctua-
tion interval for that step of the flow.
Material
Two material types in two size ranges were prepared and
used for the through-flow test. The material was sieved care-
fully to achieve a uniform size distribution (poor graded), en-
hancing the material grading that can represent what has been
used in existing hydraulic structures or could be used for poten-
tial projects. The results for these materials can even be used to
estimate the behaviour of material with slightly bigger grains
and maintain the geometric property criteria outlined by Sabin
and Hansen (1994).
Material char acteristi cs are present ed in Table 1.
Experimental Results
The measurements taking during the tests were interpreted
using the friction factor concept for packed columns to evalua te
energy dissipation through the tested material.
In order to be able to analyse the forces exerted by the flow-
ing fluid on the solid surfaces in a porous medium, there have
been two main approaches taken in order to develop expres-
sions for the friction factor and to assess energy losses. In the
first approach, the active porosity of the porous medium is used
and it is considered as a group of tangled conduits with varying
cross sections, in which this theory can be further developed by
using the concept of energy losses for a single straight pipe and
extending it to incorporate the complicated network of pipes
Sec 1: 2 sensors
Sec 2: 4 sensors
Sec 3: 2 sensors
Sec 4: 2 sensors
Sec 5: 4 sensors
Sec 6: 2 sensors
F. FERDOS ET AL.
Open Access
4
Table 1.
Properties of tested sample material.
Sample Aggrigate
shape Rock t ype Density Surface roughne s s
1 Cobblestone Grenite Fedespart 2750 River rounded
smooth
2 Cobblestone Grenite Fedespart 2750 River rounded
smooth
3 Crushed stone
Basalt 2900 Crushed rough
4 Crushed Stone
Basalt 2900 Crushed rough
Sample Size rang
(mm) h* Dp (mm) av Porosity
1 100 - 160 1.1 130 51 0.534
2 160 - 240 1.1 200 33 0.468
3 100 - 160 1.35 130 62 0.506
4 160 - 240 1.45 200 44 0.49
*Ratio of sur face are a to the surfa ce area of t he equivale nt sphere est imated fr om 50
random samples taken from each batch and dimensions compared to the available
guidelines from three d imensional shape analyses.
within the medium’s porosity (Bird, 2005). In the second ap-
proach, the emphasis is on the solid grains instead and the me-
dium is considered as a group of submerged objects within a
conduit. Within this framework, the energy losses and friction
factor can be obtained by summing up the contribution of each
of the particles to the whole energy loss (Brinkman, 1947).
For this paper, the first approach with the focus on active
porosity is adopted. It is assumed t hat the sample has a statisti-
cally uniform packing along the length (porosity is uniform
along the length) and the representative diameter of the medium
is adequately small in comparison to the diameter of the per-
meameter.
Incorporating the assumptions allows the use of force bal-
ance in a representative tube of available tubes as:
(1)
where Fk is the force that is exerted by the moving fluid over
the solid surfaces, A is the characteristic area and K, a charac-
teristic kinematic energy per unit volume which is proportioned
by the fiction factor of the tube. Substituting the energy, area
and surfaces and adopting the common mean hydraulic radius
empiricism , one gets:
2
0
1
2
L tube
h
L
PP vf
R
ρ

−= 

(2)
In which
tube
f
is the friction factor for the single representa-
tive tube, which, as can be seen from Equation (2), is a function
of the Reynolds number (
Re 4
h
vR
ρµ
=
).
v
is the actual
velocity,
h
R
is the hydraulic radius, the cross section available
for the flow divided by wetted perimeter,
ρ
is the fluid den-
sity and
µ
the fluid’s dynamic vi sc osity .
From the given expression, the friction factor of a represen-
tative tube of the system can be calculated from experimental
data. The friction factor for the whole column of porous media
can then be analysed using the friction factor expression of a
single straight pipe analogously and substituting
tube
f
in to it
as:
0
2
0
2
0
11
42
1
where 2
pL
L tube
h
DPP
fLv
L
PP vf
R
ρ
ρ



=






−= 

(3)
In which L is the length of the sample,
p
D
is the effective/
mean particle diameter of the sample and v0 is the superficial
velocity, which is derived by dividing the volumetric flow rate
by the available void area of the cross section of the sample.
By combining the two equations we get the representative
friction factor for the porous media:
2
2
0
1
4
p
tube
h
Dv
ff
Rv
 
= 
 
(4)
Since the hydraulic radius can be expressed as effective po-
rosity (n) divided by the wetted surface and at the same time
bulk velocity and superficial velocity are related with the me-
dium’s effective porosity (n), the aforementioned relation can
further simplified as:
h
cross section available forflow
Rwetted perimeter
=
(5)
( )
1
h
v
n
Ran
=×−
(6)
2
22
0
1v
vn
=
(7)
Substituting the given relations into Equation (4) results in:
( )
3
1
4
v
p tube
an
fD f
n
=
(8)
In which generally,
p
D
is expressed as a function of
v
a
for each material as
pv
D Ka= where K is equal to 6 for
spheres and cubes and a higher value for flake shape or rod
shape aggregates.
Figure 5 shows the average pressure taken from piezometer
recordings at 6 sections along the main unit’s length, of each
flow step starting from 50 l/s until 600 l/s for each tested sam-
ple.
As can be seen from the results, a pressure profile is avail-
able for each flow step of each sample. Interpreting the results
by means of the given equation for
tube
f
we can evaluate the
frictional material behaviour for each of the tested materials as
it is illustrated in Figure 6.
From the
tube
f
values in respect to the Re value, two sepa-
rate behaviour zones can be observed and these are highlighted
in the charts above. The initial parts show a nonlinear behav-
iour of
tube
f
which, following some increments of flow steps
and an increase of the Re, fades away. For samples 1, 3 and 4
this nonlinear behaviour is completely captured by the collected
data. On the other hand, for sample 2, the test starts from a
higher value for Re, and therefore only a part of this nonlinear
behaviour is captured. Its missing part is marked by a hypo-
thetical dotted black line.
From the
tube
f
values with respect to the Re value and using
Equation (8), the friction factor for a packed porous material
column of coar se rock is calculated and presented in Figure
7.
F. FERDOS ET AL.
Open Access
5
Figure 5.
Shows the averaged p ressure readings fro m the piezometers for
each flow step along the samples.
Figure 6.
Shows the ftube calculated for each tested materials.
Conclusion
Flow through porous structures, specifically embankment
dams, is an area of growing consideration within dam structural
design, safety evaluation and risk mitigation. Accidental leak-
age, which can be caused by internal erosion and/or differential
settlements or extensive storm flows due to climate change, can
result in heavy turbulent through flows with a very high Rey-
nolds number within these structures. Forces induced by these
flows can result in instabilities of slopes and even trigger dam
failures. In order to be able to account for these forces, the flow
regime under these critical situations needs to be investigated.
For this purpose, a new experimental apparatus was constructed
in Vattenfall R&D hydraulic laboratory which facilitates well-
monitored and controlled through flow tests reaching extensive
turbulence and critical gradients. A set of preliminary tests have
been conducted and from the results and their interpretation it
can be observed that the development of a complete, highly
turbulent flow regime happens in flow conditions with a Re
greater than 60,000. Below this margin the friction factor is
completely Re number dependent, but after the increase of flow
velocity, the boundary layers around the aggregates stabilizes
and the Re dependency becomes negligible. Therefore the fric-
tion factor can only be described as a function of the surface
roughness without introducing significant errors on Re numbers
in excess of 60,000.
Acknowledgements
This study was conducted as part of a PhD programme fi-
nanced by the Swedish Hydropower Centre (SvensktVattenk-
raftcentrum, SVC), Stockholm. SVC was established by the
F. FERDOS ET AL.
Open Access
6
Figure 7.
Shows the friction factor calculated for each of the packed columns of
rock material from the ftube values.
Swedish Energy Agency, Elforsk and SvenskaKraftnät, to-
gether with Luleå University of Technology, the Royal Institute
of Technology, Chalmers University of Technology and Upp-
sala University . www.svc.nu. This experimental research is also
sponsored by the Swedish Hydro-power Centre (SVC) and is
being conducted in the hydraulic laboratory of Vattenfall Re-
search and Development Centre in Sweden.
REFERENCES
Brinkman, H. C. ( 194 7). A calcu latio n of the visco us force exe rted by a
flowing fluid on a dense swarm of particles. Journal of Applied Sci-
ences Research, A1, 27-34. URL (Last checke d 20 August 2013)
http://dns2.asia.edu.tw/~ysho/YSHO-English/1000%20CE/PDF/App
%20Sci%20Res%20Sec%20A1,%2027.pdf
Byron, B. R., Stewart, W. E., & Lightfoot, E. N. (2005). Transport
phenomena (2nd ed.). New York: John Wiley & Sons, Inc.
http://dx.doi.org/10.1002/aic.690070245
Dudgeon, C. R. (1966). An experimental study of the flow of water
through coarse granular media. La Houille Blanche, 7, 785-800.
http://dx.doi.org/10.1051/lhb/1966049
Garboczi, E. J., Be n tz, D. P., Snyder, K. A., Martys, N. S., Stutzman, P.
E., Ferraris, C. F., & Bullard, J. W. (2013). Materials and structural
systems. Gaithersburg, USA: National Institute of Standards and Tech-
nology. URL (L ast checked 20 August 2013)
http://ciks.cbt.nist.gov/~garbocz/monograph/tablecontents.html
Hansen, D., Zhao, W . Z., & Han, S. Y. (2005). Hydraulic p erformance
and stability of coarse rockfill deposits, PICE (UK). Journal of Water
Management, 158, 163-174.
http://dx.doi.org/10.1680/wama.2005.158.4.163
ICOLD (International Commission o n Large Da ms) (1987). Dam safety
guidelines. ICOLD Bulletin 59.
McCorquodale, J. A., Hannoura, A. A., & Nasser, M. S. (1977). Hy-
draulic conductivity of rockfill. Journal of Hydraulic Research, 2,
197. http://dx.doi.org/10.1080/00221687809499625
Sabin, G. C. W., & D. Han sen (1994). The effects of p article shape and
surface roughness on the hydraulic mean radius of a porous medium
consisting of quarried rock. Geotechnical Testing Journal GTJODJ,
17, 43-49.