Paper Menu >>
Journal Menu >>
 International Journal of Geosciences, 2013, 4, 1256-1266 Published Online November 2013 (http://www.scirp.org/journal/ijg) http://dx.doi.org/10.4236/ijg.2013.49120 Open Access IJG Application of Geophysical Methods to Building Foundation Studies Folahan Peter Ibitoye1,2, Felix Vincent Ipinmoroti2, Mudasiru Salami2, Kunle Joseph Akinluwade2,3*, Adeyinka Taofeek Taiwo2, Adelana Rasaki Adetunji2,4 1Department of Applied Geophysics, Federal University of Technology, Akure, Nigeria 2Prototype Engineering Development Institute, National Agency for Science and Engineering Infrastructure (NASENI), Ilesa, Nigeria 3Department of Materials Science and Engineering, African University of Science and Technology (AUST), Abuja, Nigeria 4Department of Materials Science and Engineering, Obafemi Awolowo University, Ile-Ife, Nigeria Email: *jakinluwade@yahoo.com, folaibitoye@yahoo.com Received August 16, 2013; revised September 19, 2013; accepted October 21, 2013 Copyright © 2013 Folahan Peter Ibitoye et al. This is an open access article distributed under the Creative Commons Attribution License, which permits unrestricted use, distribution, and reproduction in any medium, provided the original work is properly cited. ABSTRACT A geophysical survey involving the electrical resistivity method utilizing the Vertical Electrical Sounding (VES) and Electri- cal Imaging Techniques was conducted around the premises of an area within south-western Nigeria with the aim of studying structural defects which may be responsible for future problems and characterizing the soil conditions of the site. A total of 15 VES stations were occupied using Schlumberger Configuration with AB/2 varying from 1 to 65 m. In the electrical imaging, dipole-dipole array was adopted and the two traverses were occupied in the S-N and E-W direc- tions close to where wall cracks and subsurface problems were manifested. Five main geoelectric sequences were deline- ated within the study area; these include the topsoil (clay and sandy clay), lateritic clay, weathered bedrock (clay, sandy clay and clayey sand), fractured bedrock and fresh basement. A major discontinuity (fracture zone) was discovered along the S-N direction, while a weak zone was also discovered along E-W direction. The result of this research has shown that the causes of the cracks and distress on the walls within the site may have been influenced by the differential settlement re- sulting from the incompetent subsoil materials and the fractured bedrock on which the foundation of the building was laid. Keywords: Foundation; Bedrock; Basement; Cracks; Subsurface Instability 1. Introduction With the growing demand for site development and un- pleasant experience of building failure, there is increas- ing number of necessary site investigations to reveal pos- sible subsurface problems. Therefore, geophysical inves- tigations are important in evaluating the physical proper- ties of the subsurface in terms of its soil type, soil com- petence, soil corrosivity, depth to bedrock and lithologic sequence. Site engineers, for reasons of cost and other considera- tions such as assumptions in structural design, sometimes fail to incorporate pre-construction investigations in their job schedule. A geophysical investigation is therefore ne- cessary for the site to reveal possible future subsurface problems and proffer possible solutions before the erec- tion of buildings. 2. Study Area The Study Area, shown in Figure 1, is geographically enclosed within latitude 7˚36'95" N to 7˚37'55" N and longitude 4˚42'00" E to 4˚42'90" E, south-western, Ni geria. The climate is humid tropical type with a mean annual temperature of about 280˚C and a mean annual rainfall of about 1600 mm [1]. Periods of high tempera- tures are recorded annually; the first period occurs in March-April and the second period in November-De- cember, the coolest period is observed in the middle of the raining season [2]. Within the Southern Ilesa area, Nigeria; the schists are the most predominant rock type. They are medium-grained with abundant biotite and strongly foliated. Lenses of granular quartz are present [3]. The quartzite and quartz mica schist are probably younger than the gneisses and schists. Several belts of schists occur around the study area and range from mas- ive, granular rocks to glassy schistose varieties. The s *Corresponding author. 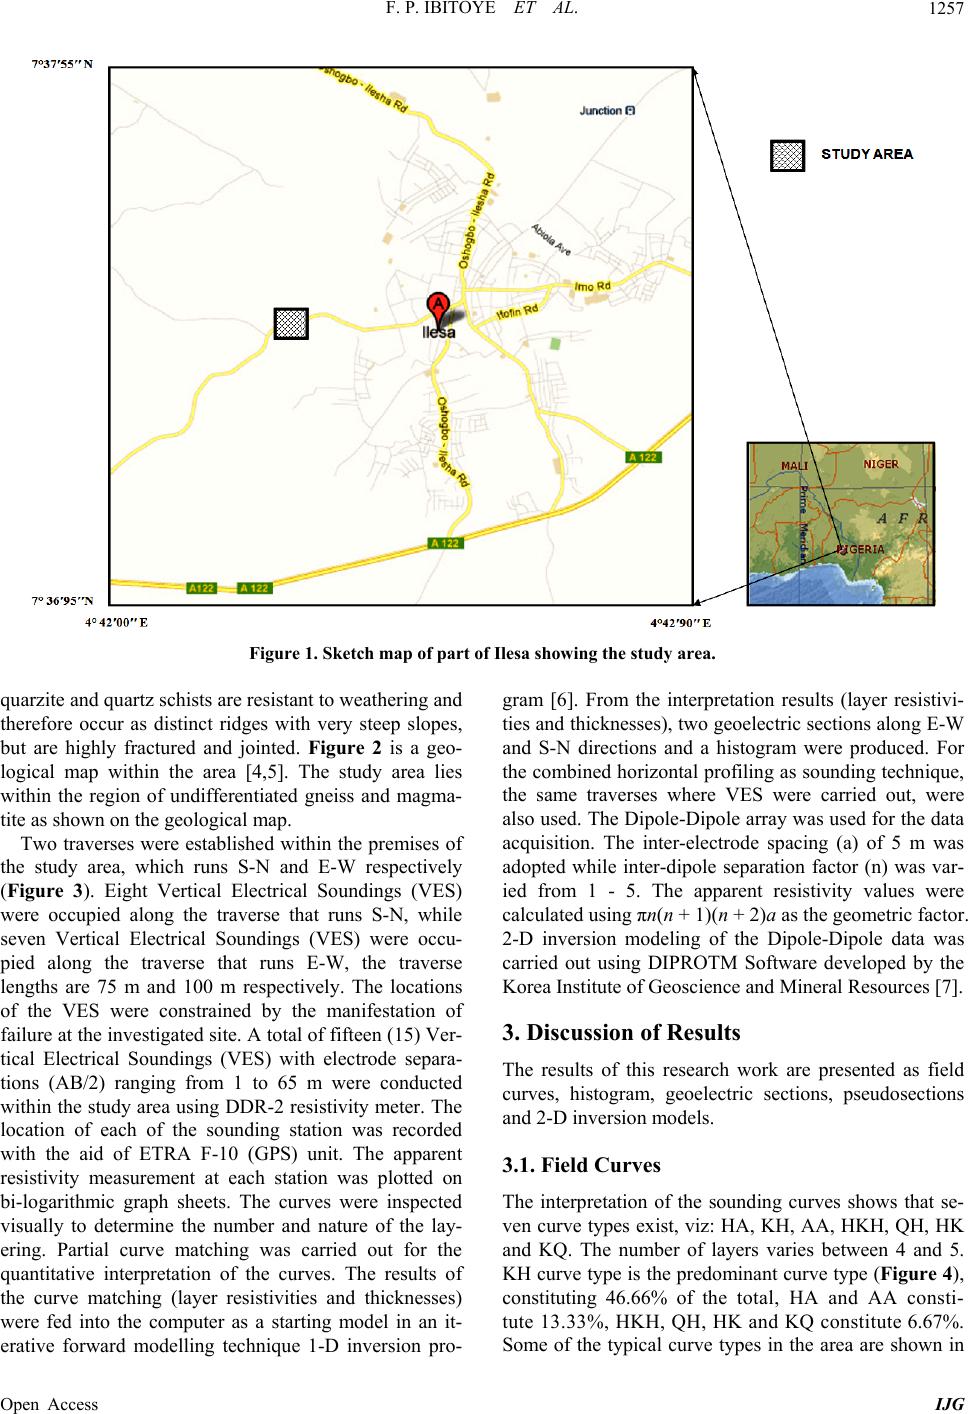 F. P. IBITOYE ET AL. 1257 Figure 1. Sketch map of part of Ilesa showing the study area. quarzite and quartz schists are resistant to weathering and therefore occur as distinct ridges with very steep slopes, but are highly fractured and jointed. Figure 2 is a geo- logical map within the area [4,5]. The study area lies within the region of undifferentiated gneiss and magma- tite as shown on the geological map. Two traverses were established within the premises of the study area, which runs S-N and E-W respectively (Figure 3). Eight Vertical Electrical Soundings (VES) were occupied along the traverse that runs S-N, while seven Vertical Electrical Soundings (VES) were occu- pied along the traverse that runs E-W, the traverse lengths are 75 m and 100 m respectively. The locations of the VES were constrained by the manifestation of failure at the investigated site. A total of fifteen (15) Ver- tical Electrical Soundings (VES) with electrode separa- tions (AB/2) ranging from 1 to 65 m were conducted within the study area using DDR-2 resistivity meter. The location of each of the sounding station was recorded with the aid of ETRA F-10 (GPS) unit. The apparent resistivity measurement at each station was plotted on bi-logarithmic graph sheets. The curves were inspected visually to determine the number and nature of the lay- ering. Partial curve matching was carried out for the quantitative interpretation of the curves. The results of the curve matching (layer resistivities and thicknesses) were fed into the computer as a starting model in an it- erative forward modelling technique 1-D inversion pro- gram [6]. From the interpretation results (layer resistivi- ties and thicknesses), two geoelectric sections along E-W and S-N directions and a histogram were produced. For the combined horizontal profiling as sounding technique, the same traverses where VES were carried out, were also used. The Dipole-Dipole array was used for the data acquisition. The inter-electrode spacing (a) of 5 m was adopted while inter-dipole separation factor (n) was var- ied from 1 - 5. The apparent resistivity values were calculated using πn(n + 1)(n + 2)a as the geometric factor. 2-D inversion modeling of the Dipole-Dipole data was carried out using DIPROTM Software developed by the Korea Institute of Geoscience and Mineral Resources [7]. 3. Discussion of Results The results of this research work are presented as field curves, histogram, geoelectric sections, pseudosections and 2-D inversion models. 3.1. Field Curves The interpretation of the sounding curves shows that se- ven curve types exist, viz: HA, KH, AA, HKH, QH, HK and KQ. The number of layers varies between 4 and 5. KH curve type is the predominant curve type (Figure 4), constituting 46.66% of the total, HA and AA consti- tute 13.33%, HKH, QH, HK and KQ constitute 6.67%. ome of the typical curve types in the area are shown in S Open Access IJG 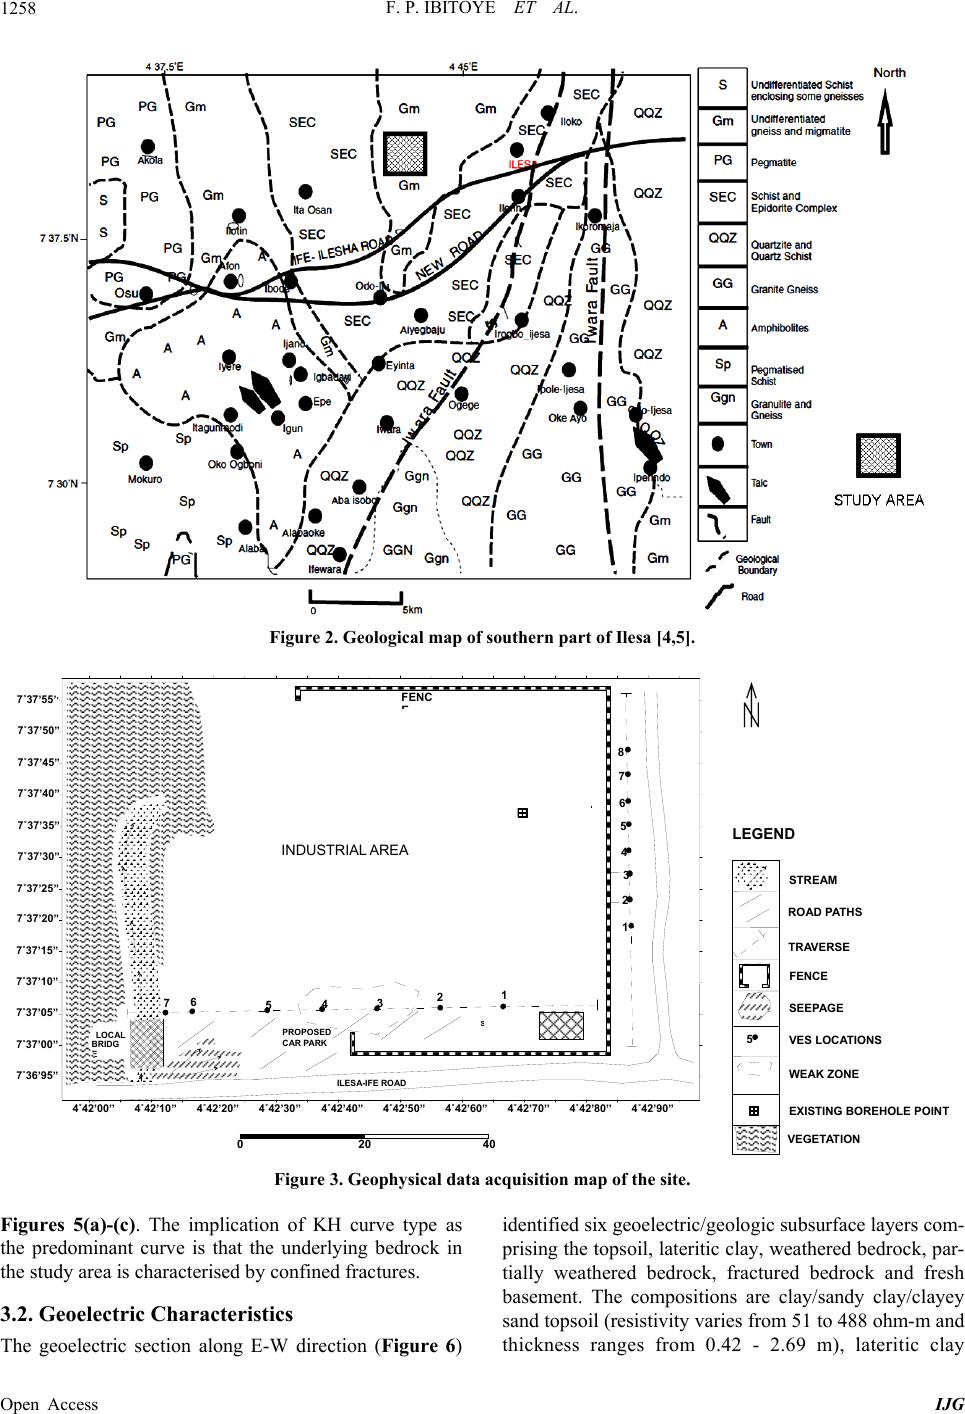 F. P. IBITOYE ET AL. 1258 Figure 2. Geological map of southern part of Ilesa [4,5]. 4˚42’00’’ 4˚42’10’’ 4˚42’20’’ 4˚42’30’’ 4˚42’40 ’’ 4˚42’50’’ 4˚42’60’’4˚42’70’’ 4˚42’80’’ 4˚42’90 ’’ 7˚36’95’’ 7˚37’00’’ 7˚37’05’’ 7˚37’10’’ 7˚37’15’’ 7˚37’20’’ 7˚37’25’’ 7˚37’30’’ 7˚37’35’’ 7˚37’40’’ 7˚37’45’’ 7˚37’50’’ 7˚37’55’ ’ 3 4 5 4 5 6 Generator Solar Panel Unit Administrative/ Foundry Building PROPOSED CAR PARK ROAD PATHS TRAVERSE FENCE LEGEND Building FENC E ILES A -IFE ROAD LOCAL BRIDG E SEEPAGE 5 VES LOCATIONS WEAK ZONE STREAM 6 7 21 3 7 8 2 1 EXISTING BOREHOLE POINT VEGETATION 020 40 INDUSTRIA L AREA Figure 3. Geophysical data acquisition map of the site. Figures 5(a)-(c). The implicatio e predominant curve is that the underlying bedrock in The geoelectric section along E-W direction (Figure 6) /geologic subsurface layers com- prising the topsoil, lateritic clay, weathered bedrock, par- tially weathered bedrock, fractured bedrock and fresh /sandy clay/clayey n of KH curve type as identified six geoelectric th the study area is characterised by confined fractures. 3.2. Geoelectric Characteristics basement. The compositions are clay sand topsoil (resistivity varies from 51 to 488 ohm-m and thickness ranges from 0.42 - 2.69 m), lateritic clay Open Access IJG 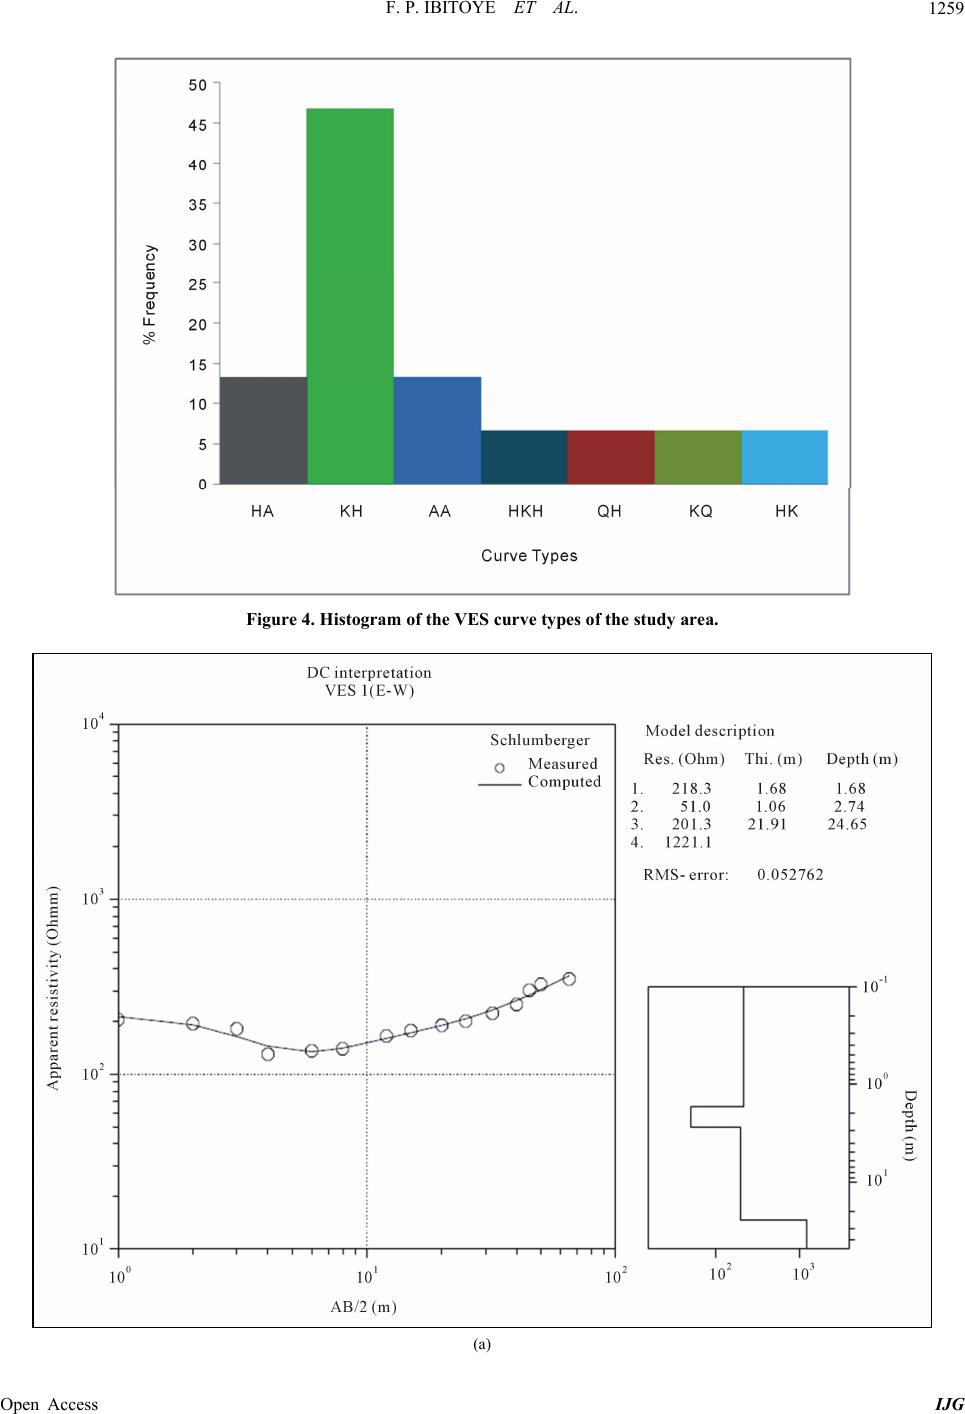 F. P. IBITOYE ET AL. 1259 Figure 4. Histogram of the VES curve types of the study area. (a) Open Access IJG  F. P. IBITOYE ET AL. 1260 (b) (c) Figure 5. (a) Typical HA sounding curve; (b) Typical KH sounding curve ; (c ) Typical HKH sounding curve. Open Access IJG  F. P. IBITOYE ET AL. Open Access IJG 1261 V ES 1 V ES 2 V ES 3 201 273 114 105 218 378 E 64 220 1808 0510 15 10 (m) V .E = 0.5 V ES 4 V ES 5 V ES 6 V ES 7 274 10 20 30 966 127 334 1221 1385 1246 1018 1372 937 1128 106 240 109 488 116 146 TOPSOIL WEATHERED BEDROCK FRACTURED BEDROCK LEGEND FRESH BASEMENT LAT ERITIC CLAY 20 869 W 51 977 626 PARTIALLY WEATHERED BEDROCK 40 0 DEPTH (M) Figure 6. Geoelectric section along E-W direction. (resistivity varies from 966 to 977 ohm-m and thickness ranges from 4.10 - 5.24 m) localized at VES 2 and VES 7, clay/sandy clay/clayey sand weathered bedrock (resistiv- ity varies from 64 to 334 ohm-m and thickness ranges from 6.77 - 29.08 m), partially weathered bedrock (resis- tivity of 626 ohm-m and thickness of 30.62 m) beneath VES 6, fractured bedrock (resistivity of 869 ohm-m) be- neath VES 4 which is a confined fracture and fresh base- ment (resistivity varies from 937 ohm-m to 1385 ohm-m). The depth to rock head ranges from 7.19 m to 36.17 m. The overburden is generally thick but thinnest at VES 4 (7.19 m) and thickest at VES 6 (36.17 m) at the western flank, both along East-West direction. The basement re- lief is undulating; basement depression is noticed at VES 3 (E-W) and VES 6 (E-W). The geoelectric section along S-N direction (Figure 7) identified five geoelectric/geologic subsurface layers comprising the topsoil, lateritic clay, weathered bedrock, partially weathered bedrock and fresh basement. The compositions are sandy clay/clayey sand topsoil (resis- tivity varies from 120 to 246 ohm-m and thickness ranges from 0.75 - 3.52 m); lateritic clay (resistivity var- ies from 664 ohm-m to 3205 ohm-m and thickness ranges from 2.93 - 16.16 m); weathered bedrock (resis- tivity varies from 91 ohm-m to 389 ohm-m), partially weathered bedrock (resistivity of 423 ohm-m) localized at VES 5 showing that it extends beyond the depth of study (60 m) and fresh basement (resistivity of 3937 ohm-m). The r generally indicate five main geoelectric layers; namely the topsoil (resistivity varies from 51 to 488 ohm-m and thickness ranges from 0.42 - 3.52 m), lateritic clay (664 to 3205 ohm-m and thickness ranges from 2.93 - 16.16 m), weathered bedrock (resistivity varies from 64 ohm-m to 393 ohm-m), fractured bedrock (resistivity of 869 ohm-m) and fresh basement (resistivity varies from 937 ohm-m to 3937 ohm-m). The topsoil generally varies in composition from clay to sandy clay, but predominantly composed of sandy clay. The fracture zones are generally confined and extend beyond the depth of study. 3.3. Combined Horizontal Profiling (HP) and Vertical Electrical Sounding (VES) The Dipole-dipole psudosection and the 2D resistivity structure along E-W direction are shown in Figure 8. The 2D resistivity structure revealed four geoelectric layers marked by A, B, C and E separated by geologic boundaries; namely topsoil marked by A (generally green colour except at few points with yellow and red colour); weathered bedrock marked by B (generally green with few yellow colour); lateritic clay marked by C (yellow and red colour) and fresh basement marked E (red and purple colour). The topsoil is generally thin and subsume into the weathered bedrock in many places due to its characterized by lateritic clay between stations 15 and 16 and sandy clay between stations 13 and 15, but gely composed of clay at the other stations. The weathered turated neral esults of the field curves and geoelectric sections bedrock (B) is characterized by two potentially sa  F. P. IBITOYE ET AL. 1262 V ES 1 V ES 2 V ES 3 215 S 05 20 (m) V.E = 0.25 V ES 4 V ES 5 V ES 6 V ES 7 245 120 233 223 TOPSOIL LATERIT IC CLAY FRESH BASEMENT LEGEND WEATHERED BEDROCK 40 N V ES 8 243 246 124 190 372 350 211 238 389 91 423 285 261 231 393 190 373 10 0 5m 10m 15m 20m 25m30m 35m 0 20 40 60 664 960 2751 877 2662 975 971 3205 423 1515 3937 PARTIALLY WEATHERED BEDROC K DEPTH (M) Figure 7. Geoelectric section along S-N direction. -dipole along E-W direction. clay. Between stations 4 and 6 at depth of 2.5 m, the resence of lateritic clay is noticed in the weathered layer Figure 8. 2-D Modeling of dip zones with v ole ery low resistivity values marked D1 and D2 respectively which could be the diagnostic effect of wet p Open Access IJG  F. P. IBITOYE ET AL. 1263 by an oval shaped unit with a higher resistivity value than its surroundings. This could be as a result of the deposition that was left after weathering. The weathered bedrock (B) is characterized by sandy clay due to its low resistivity values but with higher portion of clay between stations 6 and 10 which falls within the weak segment of the investigated premises. The depth to bedrock is thicker between stations 2 and 10, but decreases towards the wes- tern flank (between stations 10 to 15). Between these stations, the thickness of the overburden has decreased but with higher resistivity thus, signifying a lower por- tion of clay when compared to the eastern flank, the overburden is directly underlain by competent bedrock (E) which extends beyond the depth of study (25 m). The Dipole-dipole pseudosection and the 2D resistivity struc- ture along S-N are presented in Figur e 9. The 2D resistivity structure revealed four geoelec- tric/geologic layers marked A, B, C and D which are separated by geologic boundaries namely; topsoil marked A (green and yellow colour); lateritic clay marked by B (red and purple colour); Weathered bedrock marked C (green colour) and fractured basement (blue colour). The topsoil is generally thin and composed of clay and sandy clay, but subsumes into the underlying lateritic clay in many places. A major discontinuity flanked on both sides by regions of higher resistivity was noticed between sta- tions 6 and 11, this discontinuity which extends beyond the depth of study (25 m) is in form of an oval shaped unit which has concentric inner (D) and outer (C) regions, gradual decrease in resistivity values occurs from the outer region (C) to the inner region (D). The fracture zone (D) (inner region of the oval shaped uni) is the t Figure 9. 2-D Modeling of dip-dipole along S-N direction. ole Open Access IJG 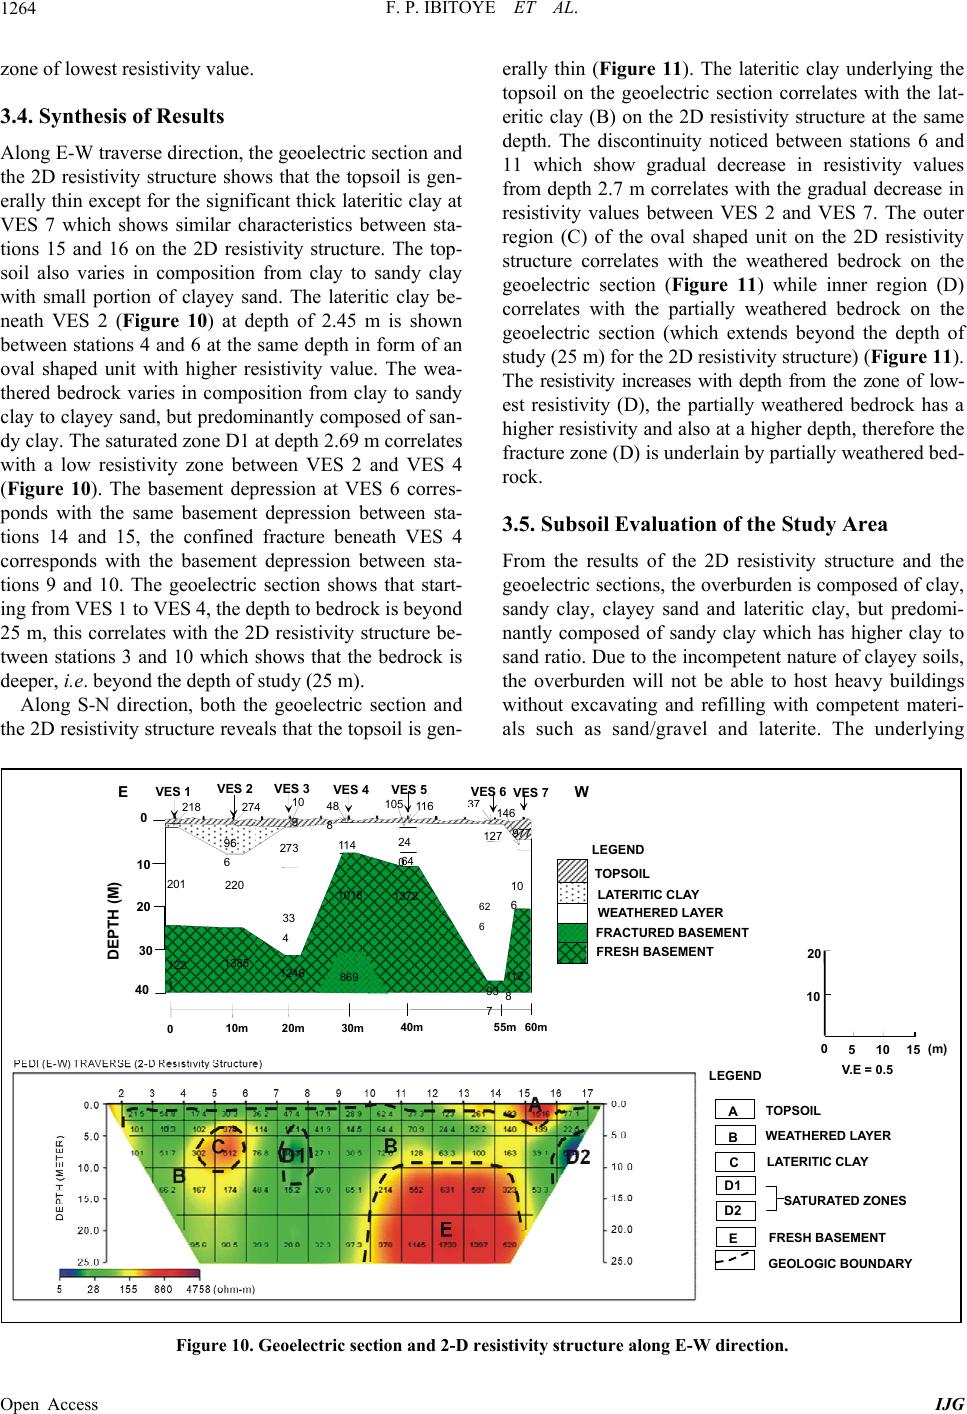 F. P. IBITOYE ET AL. 1264 zone of lowest resistivity value. 3.4. Synthesis of Results Along E-W traverse direction, the geoelectric section and the 2D resistivity structure shows that the topsoil is gen- erally thin except for the significant thick lateritic clay at VES 7 which shows similar characteristics between sta- tions 15 and 16 on the 2D resistivity structure. The top- soil also varies in composition from clay to sandy clay with small portion of clayey sand. The lateritic clay be- neath VES 2 (Figure 10) at depth of 2.45 m is shown between stations 4 and 6 at the same depth in form of an oval shaped unit with higher resistivity value. The wea- thered bedrock varies in composition from clay to sandy clay to clayey sand, but predominantly composed of san- y clay. The saturated zone D1 at depth 2.d w 69 m correlates ith a low resistivity zone between VES 2 and VES 4 (Figure 10). The basement depression at VES 6 corres- ponds with the same basement depression between sta- tions 14 and 15, the confined fracture beneath VES 4 corresponds with the basement depression between sta- tions 9 and 10. The geoelectric section shows that start- ing from VES 1 to VES 4, the depth to bedrock is beyond 25 m, this correlates with the 2D resistivity structure be- tween stations 3 and 10 which shows that the bedrock is deeper, i.e. beyond the depth of study (25 m). Along S-N direction, both the geoelectric section and the 2D resistivity structure reveals that the topsoil is gen- er fracture zone (D) is underlain by partially weathered bed- rock. 3.5. Subsoil Evaluation of the Study Area From the results of the 2D resistivity structure and the geoelectric sections, the overburden is composed of clay, sandy clay, clayey sand and lateritic clay, but predomi- nantly composed of sandy clay which has higher clay to sand ratio. Due to the incompetent nature of clayey soils, the overburden will not be able to host heavy buildings without excavating and refilling with competent materi- als such as sand/gravel and laterite. The underlying ally thin (Figure 11). The lateritic clay underlying the topsoil on the geoelectric section correlates with the lat- eritic clay (B) on the 2D resistivity structure at the same depth. The discontinuity noticed between stations 6 and 11 which show gradual decrease in resistivity values from depth 2.7 m correlates with the gradual decrease in resistivity values between VES 2 and VES 7. The outer region (C) of the oval shaped unit on the 2D resistivity structure correlates with the weathered bedrock on the geoelectric section (Figure 11) while inner region (D) correlates with the partially weathered bedrock on the geoelectric section (which extends beyond the depth of study (25 m) for the 2D resistivity structure) (Figure 11). The resistivity increases with depth from the zone of low- est resistivity (D), the partially weathered bedrock has a higher resistivity and also at a higher depth, therefore the VES 1 VES 2VES 3 201 273 114 105 218 37 8 E 64 220 180 8 62 6 0 51015 10 (m) V.E = 0.5 VES 4 VES 5VES 6VES 7 274 10 20 30 96 6 127 33 4 122 1 1385 1246 1018 1372 93 7 112 8 10 6 977 24 0 10 9 48 8 116 146 TOPSOIL WEATHERED LAYER FRESH BASEMENT LEGEND FRACTURED BASEMENT LATERITIC CLAY 20 869 W 10m 0 20m 30m 40m55m 60m A B C D1 D2 E TOPS OIL WEATHE RED LAYER LATERITIC CLAY SATURAT E D ZONES FRESH BASEMENT LEGEND GEOLOGIC BOUNDARY 40 0 DEPTH (M) Figure 10.irection. Geoelectric section and 2-D resistivity structure along E-W d Open Access IJG 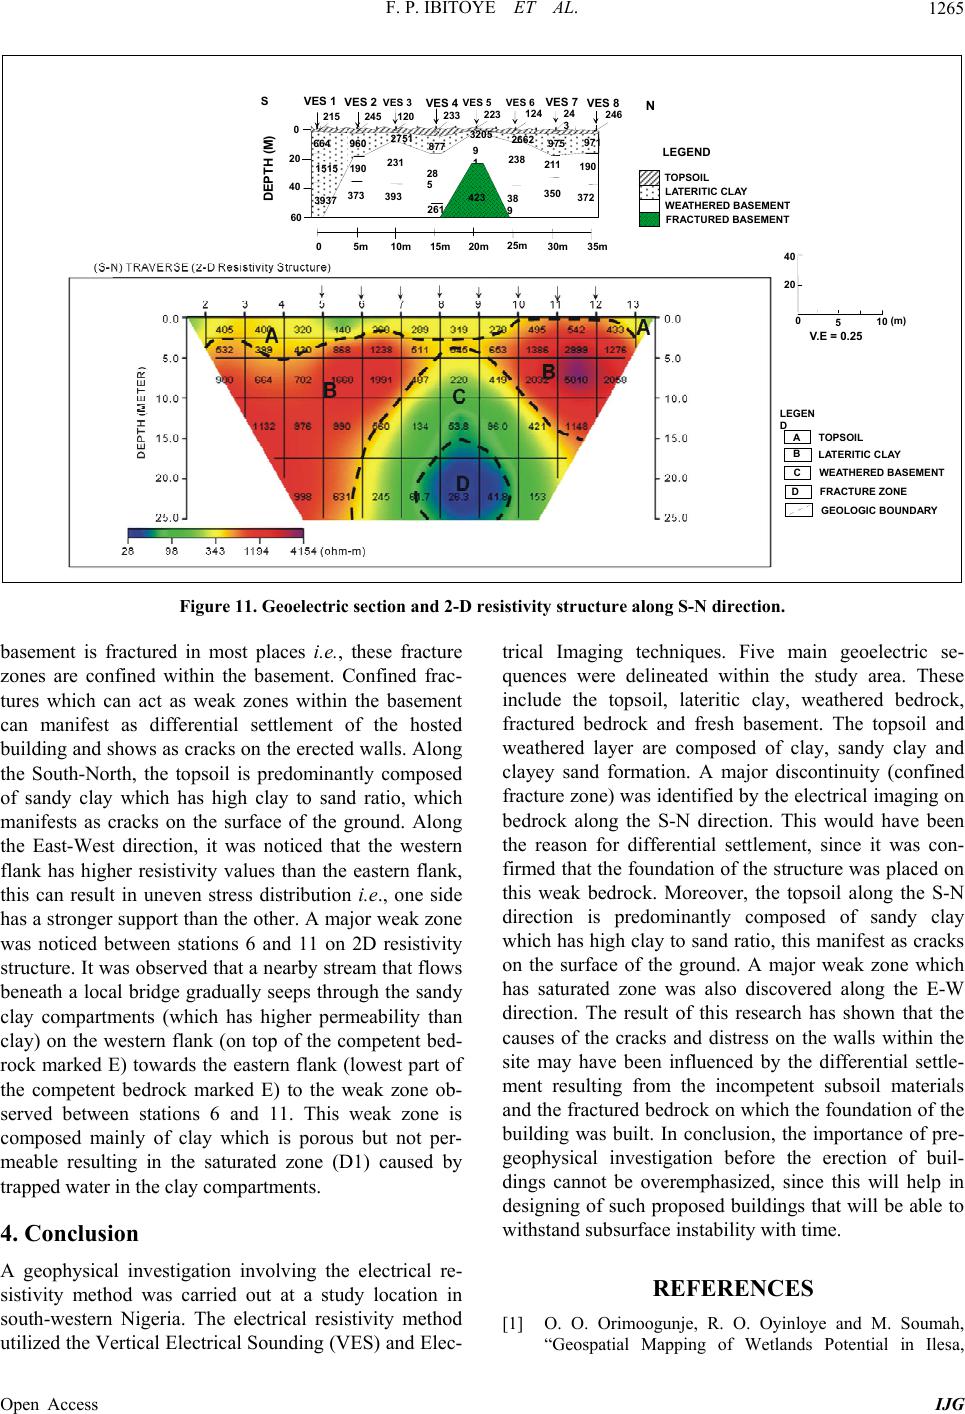 F. P. IBITOYE ET AL. 1265 V ES 1 V ES 2 VES 3 215 S 05 20 (m) V .E = 0.25 VES 6 V ES 7 V ES 4 VES 5 245 TOPSOIL LATERITIC CLAY FRACTURED BASEMENT LEGEND WEATHERED BASEMENT 40 N V ES 8 24 3246 124 190 372 350 211 238 38 9 120 233 223 9 1 423 28 5 261 231 393 190 373 10 0 5m 10m15m 20m 20 40 60 25m 30m 35m 0 A B TOPSOIL LATERITIC CLAY LEGEN D C D WEATHERED BASEMENT GEOLOGIC BOU 664 960 2751 877 NDARY 2662 975 971 3205 42 1515 39373 DEPTH (M) FRACTURE ZONE istivity structure along S-N direction. trical Imaging techniques. Five main geoelectric se- quences were delineated within the study area. These include the topsoil, lateritic clay, weathered bedrock, fractured bedrock and fresh basement. The topsoil and Figure 11. Geoelectric section and 2-D basement is fractured in most places i.e., these fracture zones are confined within the basement. Con res fined frac- tu uilding and shows as cracks on the erected walls. Along the South-North, the topsoil is predominantly composed of sandy clay which has high clay to sand ratio, which manifests as cracks on the surface of the ground. Along the East-West direction, it was noticed that the western flank has higher resistivity values than the eastern flank, this can result in uneven stress distribution i.e., one side has a stronger support than the other. A major weak zone was noticed between stations 6 and 11 on 2D resistivity structure. It was observed that a nearby stream that flows beneath a local bridge gradually seeps through the sandy clay compartments (which has higher permeability than clay) on the western flank (on top of the competent bed- rock marked E) towards the eastern flank (lowest part of the competent bedrock marked E) to the weak zone ob- served between stations 6 and 11. This weak zone is composed mainly of clay which is porous but not per- meable resulting in the saturated zone (D1) caused by trapped water in the clay compartments. 4. Conclusion A geophysical investigation involving the electrical re- sistivity method was carried out at a study location in south-western Nigeria. The electrical resistivity method utilized the Vertical E weathered layer are composed of clay, sandy clay and clayey sand formation. A major discontinuity (confined fracture zone) was identified by the electrical imaging on bedrock along the S-N direction. This would have been the reason for differential settlement, since it was con- firmed that the foundation of the structure was placed on this weak bedrock. Moreover, the topsoil along the S-N direction is predominantly composed of sandy clay which has high clay to sand ratio, this manifest as cracks on the surface of the ground. A major weak zone which has saturated zone was also discovered along the E-W direction. The result of this research has shown that the causes of the cracks and distress on the walls within the site may have been influenced by the differential settle- ment resulting from the incompetent subsoil materials and the fractured bedrock on which the foundation of the building was built. In conclusion, the importance of pre- geophysical investigation before the erection of buil- dings cannot be overemphasized, since this will help in designing of such proposed buildings that will be able to withstand subsurface instability with time. REFERENCES [1] O. O. Orimoogunje, R. O. Oyinloye and M. Soumah s Potential in Ilesa, res which can act as weak zones within the basement can manifest as differential settlement of the hosted b lectrical Sounding (VES) and Elec- “Geospatial Mapping of Wetland , Open Access IJG  F. P. IBITOYE ET AL. Open Access IJG 1266 Southwestern Nigeria,” TS 4B-SDI in Municipality and Natural Resources Management, FIG Working Week, 2009. [2] J. S. Kayode, P. K. Nyabese and A. O. Adelusi, “Ground Magnetic Study of Ilesa East, Southwestern Nigeria,” Af- rican Journal of Environmental Science and Technology, Vol. 4, No. 3, pp. 122-131. [3] E. A. Ariyibi, S. L. Folami, B. D. Ako, T. R. Ajayi and A. O. Adelusi, “Application of Principal Component Analy- sis on Geochemical Data: A Case Study in the Basement Complex of Southern Ilesa Area, Nigeria,” Arabian Jour- nal of Geosciences, Vol. 4, No. 1-2, 2010, pp. 239-247. http://dx.doi.org/10.1007/s12517-010-0175-5 [4] A. O. Adelusi, “Multi-Method Geophysical Investigation for Groundwater Study in Southeastern Part of Ilesa Area, Osun State Southewestern Nigeria,” Ph.D. Thesis, Fed- eral University of Technology, Akure, 2005. [5] A. B. Adebayo, “Physico-Chemical Characteristics of Ground- water in Two Mining Areas of Contrasting Lithologies in the Ife-Ilesa Schist Belt,” B.Sc. Thesis, Obafemi Awol- owo University, Ile-Ife, 2006. [6] M. Pirttijärvi, “DCINV: 1-D Interpretation of Electrical (DC) Soundings Software,” Oulu, 2005. [7] KIGAM, “DIPRO Version 4.01, Processing and Interpre- tation Software for Electrical Resistivity Data,” KIGAM, Daejeon, 2001. |

