 Psychology 2013. Vol.4, No.11, 878-887 Published Online November 2013 in SciRes (http://www.scirp.org/journal/psych) http://dx.doi.org/10.4236/psych.2013.411126 Open Access 878 Perceptions of Diversity: Global versus Local Perceptions* Gizelle L. Gilbert1, Candace Myers2, M. Diane Clark2#, Shelley Williams2, Angela McCaskill2 1Phoenix Day School for the Deaf, Phoenix, USA 2Gallaudet University, Washington DC, USA Email: #diane.clark@gallaudet.edu Received August 24th, 2013; revised September 26th, 2013; accepted October 23rd, 2013 Copyright © 2013 Gizelle L. Gilbert et al. This is an open access article distributed under the Creative Com- mons Attribution License, which permits unrestricted use, distribution, and reproduction in any medium, pro- vided the original work is properly cited. The current study investigated climate and diversity issues and how they contributed to students’ attitudes and experiences at a private university for the deaf. A 40-item survey was administered to assess the glo- bal perspectives regarding diversity. This scale was reduced to a 16-item scale with four subscales using exploratory factor analysis, labeled Multicultural: Diversity is Enriching, Abstract Liberalism, Cultural Racism, and Color-Blind Racism. In addition, focus groups were conducted to investigate the local per- spectives of diversity of those who hold minority status within the overall cultural milieu. Keywords: Diversity; Multicultural; Abstract Liberalism; Cultural Racism; Color-Blind Racism Perceptions of Diversity among Deaf and Hard of Hearing University Students: Global versus Local Perceptions With the election and then re-election of a Black man as President of the United States, some people of color and many Whites state that the US is in a “post-racial” era (Bonilla-Silva & Dietrich, 2011). In contrast to these statements, Bonilla-Silva and Dietrich argue that there is a new racism, which they term color-blind racism. The tenets of color-blind racism include: abstract liberalism, cultural racism, and the minimization of racism. This focus on abstract liberalism uses a “blame the vic- tim” rationale for those who find themselves without equal op- portunities; here a free market ideology is the basis for the “haves” and the “have-nots.” This view allows those who hold these beliefs to be unconcerned about inequality in the welfare system (Monnat, 2010), health care (Rosenblatt, 2009), and even extends to beliefs about immigration (Shattell & Villalba, 2008). Bonilla-Silva and Dietrich (2011) point out that racism in today’s society is implicit and institutionalized. Therefore, color-blind racism is based on the dominance of Whites in the society and not on individual prejudice. This systematic racism allows the dominant group, i.e., Whites, to explain, rationalize, and defend their “free market” interests. To better understand this new racism, one must be aware of the “location” that groups of people hold in the system; it is not an individual’s location within the system, but rather the location of the group as a whole that leads to these effects of color-blind racism. For example, many Latinos believe that they have equal opportuni- ties for success here in the US (McClain et al., 2006). This belief by Latinos in their equality has led several researchers (Bonilla-Silva, 2004; Twine & Gallagher, 2008) to claim that many Latinos identify as Whites and for McClain et al. to claim that many Latinos “adopt anti-Black beliefs.” Given these be- liefs that differ by location, it becomes important to investigate both individual and institutional perceptions of diversity. In past years, a liberal arts university for deaf and hard of hearing students administered climate surveys to gain an under- standing of how students viewed the campus climate. Using the Student Cultural Attitudes and Climate Survey (SCACS), this project proposed two studies to both follow up the SCACS results and to better understand overall institutional perceptions of campus diversity as well as to conduct focus groups to in- vestigate the impact of being a member in a local minority group. Therefore, a survey was designed based on the SCACS as well as past research to evaluate global and local perspec- tives of diversity. This survey was followed up by focus groups that were conducted to evaluate local perspectives of diversity, using homogeneous groups from selected locations. It is im- portant to understand both of these perspectives as those hold- ing a color-blind perspective have been found to show more implicit prejudice than those holding a multicultural perspective that views diversity as enriching (Richeson & Nussbaum, 2003). Results from the earlier SCACS were reported as either “conducive to student success” or “barriers to student success.” Climate attributes that were viewed as conducive to student success included a belief that the university promoted a respect for diversity, that the university has done a good job in provid- ing activities that promoted cultural understanding, and that attending diversity programs helped to build the community. In contrast, one of the climate attributes reported as a barrier to student success included the belief by students of color that the academic expectations placed on them by faculty and staff was *Authors’ note: This work was partially supported by the Office of Diver- sity and Inclusion and the Gallaudet Research Institute through a small grant. We would like to thank all of the participants who took part in this project. #Corresponding author. 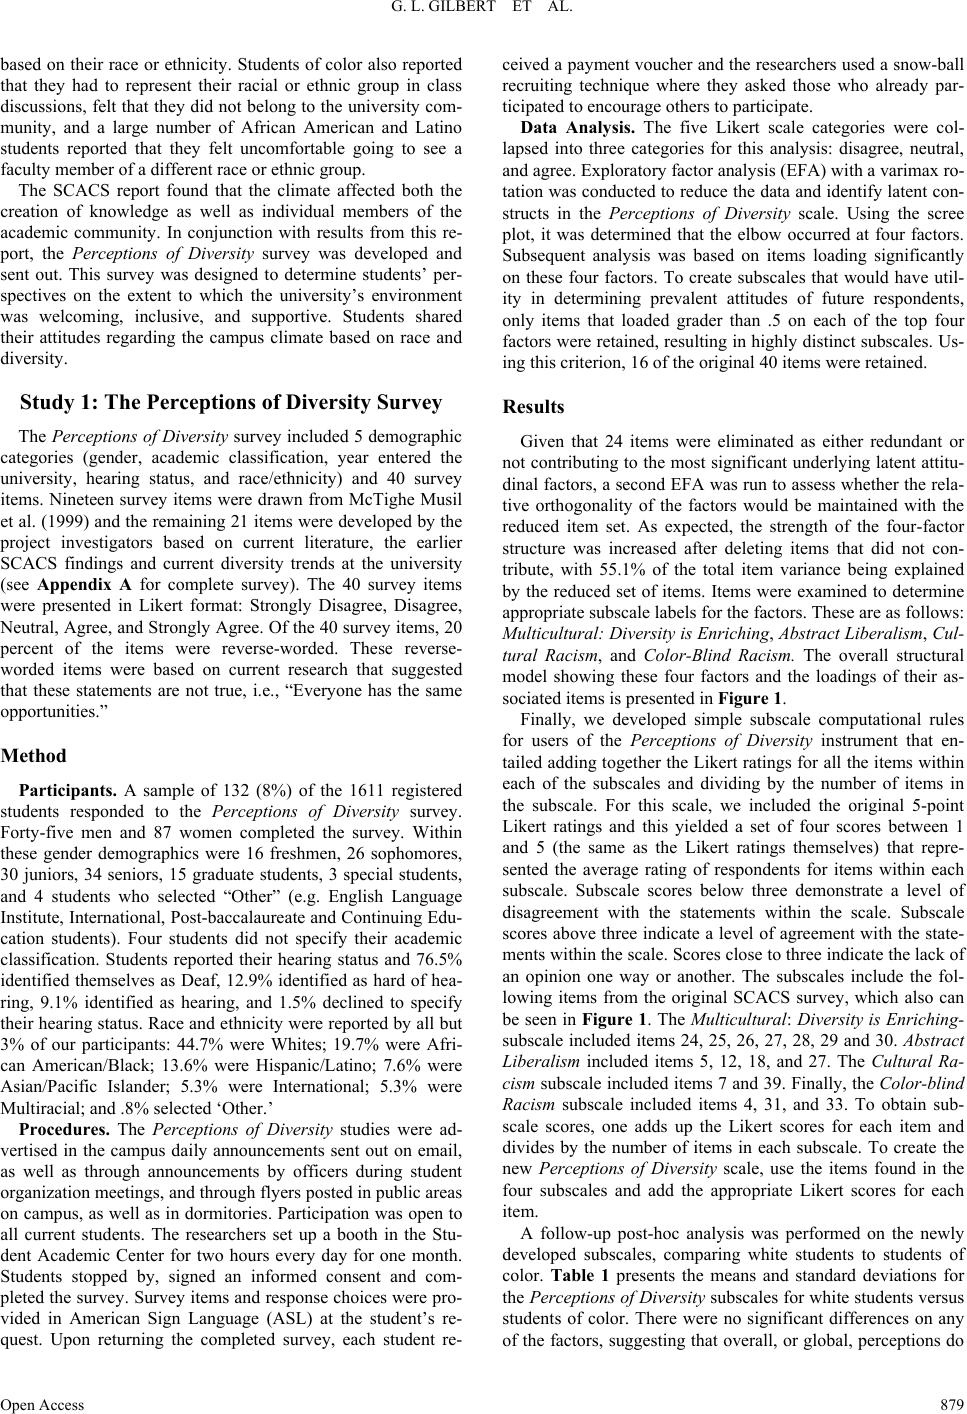 G. L. GILBERT ET AL. based on their race or ethnicity. Students of color also reported that they had to represent their racial or ethnic group in class discussions, felt that they did not belong to the university com- munity, and a large number of African American and Latino students reported that they felt uncomfortable going to see a faculty member of a different race or ethnic group. The SCACS report found that the climate affected both the creation of knowledge as well as individual members of the academic community. In conjunction with results from this re- port, the Perceptions of Diversity survey was developed and sent out. This survey was designed to determine students’ per- spectives on the extent to which the university’s environment was welcoming, inclusive, and supportive. Students shared their attitudes regarding the campus climate based on race and diversity. Study 1: The Perceptions of Diversity Survey The Perceptions of Diversity survey included 5 demographic categories (gender, academic classification, year entered the university, hearing status, and race/ethnicity) and 40 survey items. Nineteen survey items were drawn from McTighe Musil et al. (1999) and the remaining 21 items were developed by the project investigators based on current literature, the earlier SCACS findings and current diversity trends at the university (see Appendix A for complete survey). The 40 survey items were presented in Likert format: Strongly Disagree, Disagree, Neutral, Agree, and Strongly Agree. Of the 40 survey items, 20 percent of the items were reverse-worded. These reverse- worded items were based on current research that suggested that these statements are not true, i.e., “Everyone has the same opportunities.” Method Participants. A sample of 132 (8%) of the 1611 registered students responded to the Perceptions of Diversity survey. Forty-five men and 87 women completed the survey. Within these gender demographics were 16 freshmen, 26 sophomores, 30 juniors, 34 seniors, 15 graduate students, 3 special students, and 4 students who selected “Other” (e.g. English Language Institute, International, Post-baccalaureate and Continuing Edu- cation students). Four students did not specify their academic classification. Students reported their hearing status and 76.5% identified themselves as Deaf, 12.9% identified as hard of hea- ring, 9.1% identified as hearing, and 1.5% declined to specify their hearing status. Race and ethnicity were reported by all but 3% of our participants: 44.7% were Whites; 19.7% were Afri- can American/Black; 13.6% were Hispanic/Latino; 7.6% were Asian/Pacific Islander; 5.3% were International; 5.3% were Multiracial; and .8% selected ‘Other.’ Procedures. The Perceptions of Diversity studies were ad- vertised in the campus daily announcements sent out on email, as well as through announcements by officers during student organization meetings, and through flyers posted in public areas on campus, as well as in dormitories. Participation was open to all current students. The researchers set up a booth in the Stu- dent Academic Center for two hours every day for one month. Students stopped by, signed an informed consent and com- pleted the survey. Survey items and response choices were pro- vided in American Sign Language (ASL) at the student’s re- quest. Upon returning the completed survey, each student re- ceived a payment voucher and the researchers used a snow-ball recruiting technique where they asked those who already par- ticipated to encourage others to participate. Data Analysis. The five Likert scale categories were col- lapsed into three categories for this analysis: disagree, neutral, and agree. Exploratory factor analysis (EFA) with a varimax ro- tation was conducted to reduce the data and identify latent con- structs in the Perceptions of Diversity scale. Using the scree plot, it was determined that the elbow occurred at four factors. Subsequent analysis was based on items loading significantly on these four factors. To create subscales that would have util- ity in determining prevalent attitudes of future respondents, only items that loaded grader than .5 on each of the top four factors were retained, resulting in highly distinct subscales. Us- ing this criterion, 16 of the original 40 items were retained. Results Given that 24 items were eliminated as either redundant or not contributing to the most significant underlying latent attitu- dinal factors, a second EFA was run to assess whether the rela- tive orthogonality of the factors would be maintained with the reduced item set. As expected, the strength of the four-factor structure was increased after deleting items that did not con- tribute, with 55.1% of the total item variance being explained by the reduced set of items. Items were examined to determine appropriate subscale labels for the factors. These are as follows: Multicultural: Diversity is Enriching, Abstract Liberalism, Cul- tural Racism, and Color-Blind Racism. The overall structural model showing these four factors and the loadings of their as- sociated items is presented in Figure 1. Finally, we developed simple subscale computational rules for users of the Perceptions of Diversity instrument that en- tailed adding together the Likert ratings for all the items within each of the subscales and dividing by the number of items in the subscale. For this scale, we included the original 5-point Likert ratings and this yielded a set of four scores between 1 and 5 (the same as the Likert ratings themselves) that repre- sented the average rating of respondents for items within each subscale. Subscale scores below three demonstrate a level of disagreement with the statements within the scale. Subscale scores above three indicate a level of agreement with the state- ments within the scale. Scores close to three indicate the lack of an opinion one way or another. The subscales include the fol- lowing items from the original SCACS survey, which also can be seen in Figure 1. The Multicultural: Diversity is Enriching- subscale included items 24, 25, 26, 27, 28, 29 and 30. Abstract Liberalism included items 5, 12, 18, and 27. The Cultural Ra- cism subscale included items 7 and 39. Finally, the Color-blind Racism subscale included items 4, 31, and 33. To obtain sub- scale scores, one adds up the Likert scores for each item and divides by the number of items in each subscale. To create the new Perceptions of Diversity scale, use the items found in the four subscales and add the appropriate Likert scores for each item. A follow-up post-hoc analysis was performed on the newly developed subscales, comparing white students to students of color. Table 1 presents the means and standard deviations for the Perceptions of Diversity subscales for white students versus students of color. There were no significant differences on any f the factors, suggesting that overall, or global, perceptions do o Open Access 879  G. L. GILBERT ET AL. Open Access 880 Factor 1 Multicultural: Diversity is Enriching. 24. I prefer to interact with students of the same race/ethnicity because I feel that students of different races/ethnicities do not understand my culture. 25. Instruction is modified to suit students’ language and learning styles. 26. Faculty sees all students as capable regardless of race/ethnicity. 27. My sense of ethnic identity is strengthened by my sense of self and my community. 28. I do not understand why people of color eat together at the cafeteria or are often seen sitting and walking together around campus. 29. It is important that my professors use examples that are relevant to different race/ethnic groups. 30. My opinions are valued by others. Factor 2 Abstract Libera lism 5. Gallaudet University promotes diversity 12. Minorities get unnecessary special privileges ahead of more qualified people. 18. Diversity is a non-issue—we all have equal access to resources. 27. My sense of ethnic identity is strengthened by my sense of self and my community. Factor 3 Cultural Racism 10. I feel pressured to use ASL, even though it is not my primary language . 39. My race gives me special privileges. Fact or 4 Color-Blind Racism 4. Everyone has the same opportunities. 31. Faculty use race/ethnic examples where appropriate. 33. I feel that when I participate in class, I have the support of my classmates and faculty. Figure 1. Path diagram for the perceptions of diversity scale.  G. L. GILBERT ET AL. not differ by race on campus. Table 2 presents the correlation matrix of the derived scores. easily computing interpretable su d Perceptions of Diversity scale includes three les and one local subscale focusing on race and th as the main lo ts of color. hnicity N Mean Deviation t test The unit scaling proposed for bscale scores, undermines the orthogonality by using the unweighted item ratings directly in the computation of the scores and it is clear that the scaling strategy results in co-line- arity among the derived scores. However, the pattern of corre- lations among the subscale scores is interesting in that the three subscales that are more global (Multicultural: Diversity is En- riching, Abstract Liberalism, and Color-Blind Racism) are all highly intercorrelated while the one local subscale called Cul- tural Racism, focusing on pressure to use ASL and that my race gives me privileges, is uncorrelated (see Table 2). Discussion The reduce global subsca e use of sign language. Interestingly, all three of the global subscales were highly correlated. Therefore, the Multicultural: Diversity is Enriching subscale and the Color-Blind Racism subscale appear not to tap different values in this sample. Fu- ture research with different local groups may find that these subscales do highlight different latent attitudes. The current sample seems to find the local group of ASL us- ers versus those whose first language is not ASL cal group. If a deaf sample is not the dominant local group in Table 1. ubscale means and standard deviations for white participants as well S as participan Subscales Participant Race/Et Standard M t p ulticultural White 56 2.28 .36 = −1.31 = .194 People of Color 66 2.37 .38 Absct Libelism t = 43 p = Cultural Racism t = 5 p =0 Colord Ram t = 8 p =3 tra ra White 56 2.16 .36 −1. .163 People of Color 67 2.26 .43 White 58 1.78 .59 −.8 .4 People of Color 68 1.87 .60 -Blin cis White 59 2.23 .50 −.4 .6 People of Color 68 2.28 .60 Table 2 orrelations among the perceptions of diversity subscales. CR . C MC AL C-B .4* * 3 .50 .01 MC .47 . *04 AL .07 *Correlation is significant at the .01 level, 2-tailed; MC = Multicultural; AL- Abstract Liberalism; CR = Cultural Racism; C-B = Color-Blind Racism. future studies, the Cultural Racism subscale may include addi- tional items relating to race, ethnicity, sexual orientation, and gendeems related more specially to these local groups should be included if thPerceptions of Diversity scale used were identified in the SCACS report as findings that required further exploration; meaning the results left more questions th each of the five focus ASL signers, and new signers. Each focus group consisted of 3 to 5 students and a facilitator. The facilitators ty, staff, and students who previously completed Di- versity r. It e is in a different sample. In terms of a comparison of the earlier SCACS survey to the current Perceptions of Diversity scale, the climate at the uni- versity appears to have changed, such that when given a general survey, the campus community reports feeling respected, com- fortable, and valued. This result suggests that efforts to “warm- up” the climate have been successful, at least at the global level. When only this type of general survey is used, one could con- clude that diversity has become “a non-issue.” It is still impor- tant to check the perceptions of those in local groups before coming to this conclusion. Study 2 used a qualitative method to investigate local groups on campus to provide a second point- of-view. Study 2: Local Focus Groups For the focus groups, a comprehensive list of 12 questions was developed from the SCACS findings. The content of these questions an answers. All questions were asked in groups. See Appendix B for the complete list of questions. Method Five focus groups from selected locations were organized: African American/Black, Asian/Pacific Islander, Hispanic/ La- tino, native were facul Dialogue training. The focus groups were videotaped for transcription purposes. At the end of transcription, data was destroyed. Participants. A total of 20 undergraduate, graduate and spe- cial students participated in the focus groups: 4 African Ameri- can/Black, 5 Asian/Pacific Islander, 4 Hispanic/Latino, 4 native ASL signers, and 3 new signers (all from European American backgrounds). Seventeen of the 20 participants were female and 3 were male. Procedures. Students were instructed in the advertisements to contact the first author to set up a date and time to participate in a focus group. When students contacted the first author, they were given a link to a Doodle poll where they selected their availability. The first author then contacted facilitators to con- firm their availability and students whose availability matched the confirmed date and time were contacted to participate. For consistency within the focus groups, selected facilitators were assigned to groups that matched their location, i.e. the Asian/ Pacific Islander group was facilitated by an individual of Asian/ Pacific Island descent and the native ASL signer group was facilitated by an individual who was also a native ASL signer. When students showed up to participate in the focus groups, they signed an informed consent form and a video release form. Ground rules were explained. An interpreter was provided for the new signer group to provide sign support for students and the facilitator as needed. The video camera was left in stand- alone mode for the duration of the focus groups. Participation Open Access 881 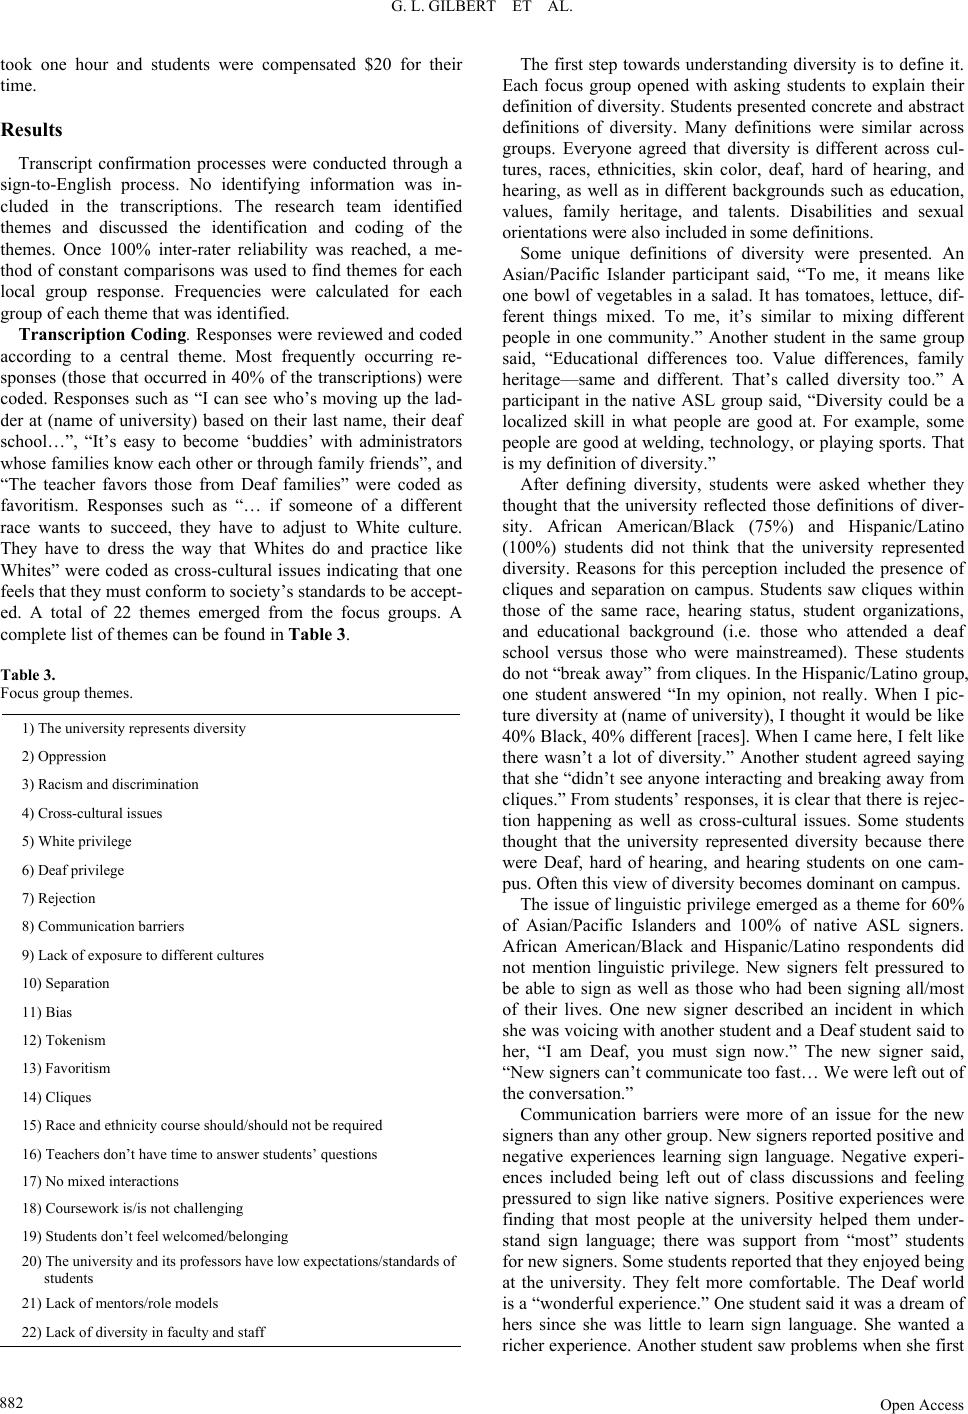 G. L. GILBERT ET AL. to themes and discussed the identification and coding of the nce 100% inter-rater reliability was reached, a me- used to find themes for each lo ’ with administrators w ok one hour and students were compensated $20 for their time. Results Transcript confirmation processes were conducted through a sign-to-English process. No identifying information was in- cluded in the transcriptions. The research team identified themes. O thod of constant comparisons was cal group response. Frequencies were calculated for each group of each theme that was identified. Transcription Coding. Responses were reviewed and coded according to a central theme. Most frequently occurring re- sponses (those that occurred in 40% of the transcriptions) were coded. Responses such as “I can see who’s moving up the lad- der at (name of university) based on their last name, their deaf school…”, “It’s easy to become ‘buddies hose families know each other or through family friends”, and “The teacher favors those from Deaf families” were coded as favoritism. Responses such as “… if someone of a different race wants to succeed, they have to adjust to White culture. They have to dress the way that Whites do and practice like Whites” were coded as cross-cultural issues indicating that one feels that they must conform to society’s standards to be accept- ed. A total of 22 themes emerged from the focus groups. A complete list of themes can be found in Table 3. Table 3. Focus group themes. 1) The university represents diversity 2) Oppression 3) Racism and discrimination ues e rs e to different cultures d ethnicity course should/should not be required on’t have time to answer students’ questions ractions s/is not challenging don’t feel welcomed/belonging andards of odels ff 4) Cross-cultural iss 5) White privilege 6) Deaf privileg 7) Rejection 8) Communication barrie 9) Lack of exposur 10) Separation 11) Bias 12) Tokenism 13) Favoritism 14) Cliques 15) Race an 16) Teachers d 17) No mixed inte 18) Coursework i 19) Students 20) The university and its professors have low expectations/st students 21) Lack of mentors/role m 22) Lack of diversity in faculty and sta The first step towards understanding diversity is to define it. Ea def de definitions were similar across groups. Everiversity is different across cul- tureaf, hard of hearing, and he s, family he pus. Students saw cliques within th sh ople at the university helped them under- st ch focus group opened with asking students to explain their inition of diversity. Students presented concrete and abstract finitions of diversity. Many yone agreed that d es, races, ethnicities, skin color, d aring, as well as in different backgrounds such as education, values, family heritage, and talents. Disabilities and sexual orientations were also included in some definitions. Some unique definitions of diversity were presented. An Asian/Pacific Islander participant said, “To me, it means like one bowl of vegetables in a salad. It has tomatoes, lettuce, dif- ferent things mixed. To me, it’s similar to mixing different people in one community.” Another student in the same group said, “Educational differences too. Value difference ritage—same and different. That’s called diversity too.” A participant in the native ASL group said, “Diversity could be a localized skill in what people are good at. For example, some people are good at welding, technology, or playing sports. That is my definition of diversity.” After defining diversity, students were asked whether they thought that the university reflected those definitions of diver- sity. African American/Black (75%) and Hispanic/Latino (100%) students did not think that the university represented diversity. Reasons for this perception included the presence of cliques and separation on cam ose of the same race, hearing status, student organizations, and educational background (i.e. those who attended a deaf school versus those who were mainstreamed). These students do not “break away” from cliques. In the Hispanic/Latino group, one student answered “In my opinion, not really. When I pic- ture diversity at (name of university), I thought it would be like 40% Black, 40% different [races]. When I came here, I felt like there wasn’t a lot of diversity.” Another student agreed saying that she “didn’t see anyone interacting and breaking away from cliques.” From students’ responses, it is clear that there is rejec- tion happening as well as cross-cultural issues. Some students thought that the university represented diversity because there were Deaf, hard of hearing, and hearing students on one cam- pus. Often this view of diversity becomes dominant on campus. The issue of linguistic privilege emerged as a theme for 60% of Asian/Pacific Islanders and 100% of native ASL signers. African American/Black and Hispanic/Latino respondents did not mention linguistic privilege. New signers felt pressured to be able to sign as well as those who had been signing all/most of their lives. One new signer described an incident in which e was voicing with another student and a Deaf student said to her, “I am Deaf, you must sign now.” The new signer said, “New signers can’t communicate too fast… We were left out of the conversation.” Communication barriers were more of an issue for the new signers than any other group. New signers reported positive and negative experiences learning sign language. Negative experi- ences included being left out of class discussions and feeling pressured to sign like native signers. Positive experiences were finding that most pe and sign language; there was support from “most” students for new signers. Some students reported that they enjoyed being at the university. They felt more comfortable. The Deaf world is a “wonderful experience.” One student said it was a dream of hers since she was little to learn sign language. She wanted a richer experience. Another student saw problems when she first Open Access 882  G. L. GILBERT ET AL. arrived at (name of university), but as she adjusted, the univer- sity started to feel like home. In the Hispanic/Latino focus group, students felt that token- ism was an issue. It was reported by 75% of Hispanic/Latino participants that students of color were being used as tokens on the basis of making an organization look diverse and exploita- tion of student athletes from underrepresented groups by the athletic department. This group of students implied that or- ga ut I am not the only one that ha atino and native A rd- in cific Islanders, 75% of Hispanic/Latinos, and 100% of na merican/Black group felt th w to suc- ce s did uni- include people from their background. Students avoritism and tokenism, and noted th e same time) noted that they were of nizations care more about looking diverse than they do about their minority members. Analysis of transcriptions revealed a favoritism theme. Sixty percent of Asian/Pacific Islanders and 75% of Hispanic/Latino participants reported that they thought that there was favoritism at the university. One student in the Asian/Pacific Islander group said, “I ask a question, the teacher looks at her book and moves on to another chapter. B ppens to. It happens to other students too, but the students it happens to are students of color. Those students who are U.S. citizens or American, the teacher cares about them and answers their questions.” An Asian/Pacific Islander also stated an inci- dent where a White student was promoted ahead of her, which she attributed to the student being in the same fraternity as their boss. The student said, “We both started working in the com- puter lab at the same time, but the other student is higher up and is the boss’ personal assistant. I felt ashamed.” In the current study, students agreed that there is separation on campus, but they did not necessarily see these separations by race and ethnicity. Rather, they were centered on sharing simi- lar interests such as sports, student organizations, and having attended a Deaf school. Twenty-five percent of African Ameri- can/Black respondents, and 75% of Hispanic/L SL respondents reported cliques. Respondents in the Asian/ Pacific Islander group blamed student organizations for the separation on campus. One Asian/Pacific Island respondent said, “I know diversity means we have organizations but I think that is one of the reasons for separation. Like BDSU (Black Deaf Student Union), APA (Asian/Pacific-Islander Association), ELISO (English Language Institute Student Organization) could cause people to think that these are Asian groups or Black groups. They have to because (name of university) has diverse organizations, but it could be one of the reasons for making people separated.” A suggestion to reduce the issue of separation and cliques was to make all student organizations one diversity organization. The top officers of each organiza- tion (Presidents and Vice Presidents) would lead the larger diversity group. “That way, all student organizations will sup- port each other’s events. The structure should be similar to ELISO (English Language Institute Student Organization).” A Hispanic/Latino participant said that friendships were mostly between those who interacted through sports, reflecting this type of common bond as a basis for friendships. While Asian/Pacific Islanders perceive student organizations as barriers to diverse interactions, the Hispanic/Latino group had a different perspective. They reported that international students from Europe or those with a lighter complexion fit in more with Whites, whereas “darker skinned international stu- dents… struggle more to fit in with different groups.” Acco g to one student, groups are “really based on skin color.” Asian/Pacific Islanders said that students tend to gather with those of the same race, e.g. Whites with Whites, Blacks with Blacks, while Asian and international students “mix with each other.” Sports and other special interests also influenced social circles. The issues of mixed interactions where they pertain to inter- racial and interethnic friendships and interacting with individu- als of different groups was raised in the SCACS report. We followed up on this perception in the 2012 focus groups. Fifty percent, (n = 2) of African American/Blacks, 20% of Asian/Pa tive ASL respondents agreed that there are mixed interactions on campus. One Hispanic/Latino student said of these mixed interactions, “I do see some friendships based on having the same interests such as sports, academics, work, and similar major.” Another student in this group stated, “Yes, I feel I in- teract, but I feel that [I interact] more with people in my FCS major who are White and Latino.” These comments indicate that while students may see these interactions as mixed, they are based on interests, and not race. Within these mixed interactions, students do not always feel comfortable around their same-race peers. A Hispanic/Latino student said, “I feel more comfortable interacting with different groups at (name of university) compared to Hispanics”, which shows that these students pursue such interactions. In contrast, the remaining 50% in the African A at there was not much racial diversity in regards to group interactions. Students socialize “inside” their race. While these students hold their own beliefs and perceptions, they remain open to interacting with different people on campus. The majority (100%) of Hispanic/Latino respondents re- ported a lack of mentors and role models at the university. Stu- dents felt that the absence of Hispanic/Latino mentors played a major role in the lack of retention of Hispanic/Latino students. These mentors should exemplify how the students should func- tion as community members. How can they know ho ed when they “do not see Latino staff, faculty, and adminis- trator role models in the community?” Students know that the mentors are there; but they are not visible at the university. One student asked, “What have they been doing all this time?” Discussion As can be seen in these qualitative comments, diversity re- mains an issue on campus. Local groups have specific problems in terms of feeling valued and/or respected. Latino student not see role models, noting that the faculty and staff at the versity do not reported issues related to f at like groups often find comfort within their own members. International students from Africa noted that they did not “fit in” as well as international students from Europe and those with lighter skin. These responses seem to reflect Color-blind Ra- cism, with implicit racist attitudes being overlooked by groups with more privilege but impacting those who have historically been targets of overt racism. New signers noted an issue related to linguistic privilege. This issue was also seen in the Cultural Racism subscale dis- cussed earlier. This university is a bilingual environment, with ASL and written English given equal standing. Those students who are late learners of ASL or use simultaneous communica- tion (signing and voicing at th ten the targets of heated comments that focused on their use of oral language. Using spoken English was reported as “taboo” and could make one the target of bullying. Linguistic privilege has been the target of many programs established through the Open Access 883  G. L. GILBERT ET AL. Office of Diversity as well as the chief academic officers of the campus. It appears that this issue is more of a “hot button” than more traditional diversity issues such as sexism or racism. General Discussion Overall, the current studies support past research, where stu- dents stay within their comfort zones because those are where they feel they can truly be themselves. However, Pratt (1990; as cited in McTighe Musil et al., 1999) emphasized the need for students to leave thr a “contact zone” where they can get to know each other. Our findings showed th d that Black students tend to ic minority was equally important while A ore White students than International students be From our transcriptions, we could see how im ss with being a native signer. T und them, provided that the signer is signing at a ative ASL signers. In the new signer focus group, our fi e “comfort zone” and ente at students were moving beyond their comfort zones into the contact zone at the institutional level. From both studies, stu- dents clearly recognize the importance of diversity. At the more localized level, there are still perceptions of separation and staying within one’s comfort zone reported in the focus groups. Mixed interactions often did not occur. But there was the men- tion of cliques, who often based on attending a deaf school. This focus on favoritism and linguistic privilege was also de- tected in the EFA in the Cultural Racism subscale. Interestingly, some definitions of diversity focused only on hearing status, i.e., there was diversity because deaf, hard of hearing, and hearing students were on campus. Importantly, most native ASL users are white; most native signers come from a European back- ground and are often of Jewish descent, as they are the group who carry this specific genetic trait. In their study of perceptions of deaf ethnic minority students, Parasnis and Fischer (2005) quoted a participant who said that being around people like themselves was related to being in their comfort zone. Within a group of people who are similar, one does not feel judged and they feel free to be themselves. Additionally, Tatum (2003) explaine sit together because there is less pressure. In the current study, we found similar results in that students in the focus groups said that groupings were linked to having things in common. In the current study, students in the Hispanic/Latino focus group, implied that they felt more comfortable having another student of the same race there. Students also said that whatever they said would be supported when they had someone else of the same race/ethnicity in their class. It was important for students to see themselves not only in the student body, but also in the faculty and staff at the university. They placed value on ethnic role models. Past research (Parasnis, Samar, & Fischer, 2005) supported the view that having ethnic minority role models was more important than having a deaf role model. They found that White, Hispanic, and Asian deaf students at the National Technical Institute for the Deaf (NTID) felt that having role models who are deaf and of an ethn frican American deaf students reported that they needed eth- nic minority role models more than deaf role models. This finding seemed to be true of our Hispanic/Latino focus group participants. In the current study, we found that White and African American/Black students thought that diversity was not an is- sue and there was equal access for all. In contrast, Parasnis and Fischer (2005) cited research maintaining that social status and access to information was not equal for everyone. It was also found that m lieved that everyone had the same opportunities. Both find- ings support a color-blind perspective by Whites. The afore- mentioned statement is not only true within the university but for society as a whole. Some students honestly answered that they only knew of their own privileges in regard to having the same opportunities. Parasnis and Fischer (2005) pointed out that it was vital to the retention and success of ethnic minority students that insti- tutions confront diversity in curricular and co-curricular activi- ties. Programs that teach students about multicultural back- grounds as well as ongoing dialogues about race and diversity should be provided. portant it was for students to see themselves not only in the curriculum, but also in the faculty. A university should be a reflection of its student body. New signers found it hard to follow class discussions. The abovementioned situations by new signers can be reflective of White privilege in which White individuals feel entitled to cer- tain privileges based on their race. In this focus group, all members were White, a sampling strategy to attempt to address the confounding of Whitene herefore, in this situation linguistic privilege can be attributed to native signers feel entitled because of visual language access. Native signers have constant access to communication whereas new signers who have just entered a signing environment are faced with the task of adapting to a new culture and language. Although linguistic privilege has yet to be defined in the litera- ture, this discussion poses the following question: Is linguistic privilege for native signers similar to the privileges found in other dominant groups? Are native signers a dominant group at this university? Is there a mechanism that will make new sign- ers more a part of this group? These questions warrant further exploration. Transcriptions from the new signers group indicated com- munication barriers that could be attributed to being in the early stages of language acquisition. New signers are still learning to communicate and are not near the level of proficiency as their more experienced peers. They may be able to catch on to what is being said aro steady pace. Thus, it seems that more understanding needs to happen as well as support from faculty, staff, and fellow stu- dents. The perspectives of new signers and native ASL signers to- wards the campus climate were an arena that has not been vis- ited in the past. These two groups were not based solely on hearing status. When designing this study, we suspected that new signers would have different perspectives of the campus from n ndings were not similar to the other groups. This group had more specific issues. Clearly, this group struggled with two things during their discussion: one was their feelings of oppres- sion; the other was communication—putting their thoughts into words due to their level of signing experience. Future research should focus on facilitating communication for new signers. Campus-wide dialogue can focus on the new signer experience with past and current new signers sharing perspectives on how welcoming or unwelcoming the university is towards them. Because this study occurred at a private university for the Deaf, native ASL signers are the majority culture while new signers are the minority. The majority, in an effort to preserve their culture, may feel the need for the minority to conform to the majority culture. This pressure to conform is applied to both hearing students and new deaf and hard of hearing signers who were elected to come to a bilingual university. Open Access 884  G. L. GILBERT ET AL. Open Access 885 012 one can see ch org/10.1080/0141987042000268530 If the university is to keep up with the changing times and an ever-increasing diverse society, changes in the student body, faculty and staff, overall campus climate, as well as the cur- riculum are necessary to continue to move forward. Barriers need to be confronted and what works should be the focus for improvement. In general, between 2009 and 2 anges in how diversity is viewed within this university. Ear- lier negative responses to diversity were overt and explicit. Currently, there is a move to a more Multicultural perspective where diversity is seen as enhancing one’s life, which is a posi- tive change. But one also finds Color-Blind Racism with its implicit and covert negative views toward diverse groups. This kind of mixed method investigation can help identify local groups that may be overlooked when only more global instru- ments are employed. As in the larger culture, racism has not been eliminated; rather it has changed and reflects a more ab- stract liberalism. This viewpoint may lead one to blame the individual if they are not successful because everyone is be- lieved to have equal opportunities and access. The university is to be congratulated on past efforts but warned to be aware of more implicit attitudes that may lead local groups to feel un- welcome. REFERENCES Bonilla-Silva, E. (2004). From bi-racial to tri-racial. Ethnic and Racial Studies, 27, 931-950. http://dx.doi. Bonilla-Silva, E., & Dietrich, D. (2011). Race, racial attitudes, and stratification beliefs: Evolving directions for research and policy: The sweet enchantmm in Obamerica. The ent of color-blind racis Annals of the American Acad emy of Political and Social Scien c e , 6 4 3 , 190-206. http://dx.doi.org/10.1177/0002716210389702 harmaz, K. (2006). Cons through qualitative anal ys i s. Thousand Oaks: Sage Ctructing grounded theory: A practical guide . G Mc Carter, N. M., DeFrancesco Soto, V. M., Lyle, M. L., in a Creswell, J. W. (2009). Research design: Qualitative, quantitative, and mixed methods approaches (3rd ed.). Los Angeles: Sage. allaudet University (2012). Fast facts 2012. http://www.gallaudet.edu/gallaudet_university/about_gallaudet/fast _facts.html Matthews, E. T., Aina, O., & Johnson, J. (2009). Shades of distinction: How students of color experience Gallaudet University. Report. Clain, P. D., Grynaviski, J. D., Nunnally, S. C., Scotto, T. J., Kendrick, J. A., Lackey, G. F., & Davenport Cotton, K. (2006). Racial distancing southern city: Latino immigrants’ view of black Americans. Journal of Politics, 68, 571-584. http://dx.doi.org/10.1111/j.1468-2508.2006.00446.x cTighe, C. (1999). Centrality of diversity to the academy’s institu- tional mission. In C. McTi T. Nettles, W. E. Sedlacek, & D. G. Smith, (Eds.), M ghe Musil, M. Garcia, C. A. Hudgins, M. To form a more M 0, 637-652. perfect union (pp. 7-12). Washington DC: Association of American Colleges and Universities. ills, J., Bonner, A., & Francis, K. (2006). The development of con- structivist grounded theory. International Journal of Qualitative Me- thods, 5, 1-10. Monnat, S. M. (2010). Toward a critical understanding of gendered color-blind racism within the US welfare institution. Journal of Black Studies, 4 http://dx.doi.org/10.1177/0021934708317739 arasnis, I., & Fischer, S. D. (2005). Perceptions of diverse educators regarding ethnic-minority de versity. American Annals of the Deaf, 150, 341 P af college students, role models, and di- -349. http://dx.doi.org/10.1353/aad.2005.0045 arasnis, I., Samar, V. J., & Fischer, S. D. (2005). Deaf students’ atti- tudes toward ethnic diversity, campus climate, an American Annals of the Deaf, 1 50 , 47-58. P d role models. http://dx.doi.org/10.1353/aad.2005.0022 icheson, J. A., & Nussbaum, R. J. (2003). The impact of multicultura- lism versus colorblindness on racial bias. Social Psychology, 40, 417-423. R Journal of Experimental http://dx.doi.org/10.1016/j.jesp.2003.09.002 osenblatt, P. C. (2009). Racism and black-white relationships in end- of-life care in the United States: A sis, and Loss, 17, 113-124. R speculative analysis. Illness, Cri- 0.2190/IL.17.2.chttp://dx.doi.org/1 Shattell, M. M., & Villalba, J. (2008). Anti-immigration rhetoric in the United States: Veiled racism? Issues in Mental Health Nursing, 29, 541-543. http://dx.doi.org/10.1080/01612840801981538 Smith, D. G. (2009). Diversity’s promise for higher education: Making it work. Baltimore: The Johns Hopkins University Press. wine, F. W., & Gallagher, C. (2008). The future of whitenTess. Ethnic U-blind ra- and Racial Studies, 31, 4-24. llucci, K. (2006). Review of racism without racists: Color cism and the persistence of racial inequality in the United States. Urban Education, 41, 533-540. http://dx.doi.org/10.1177/0042085906291929  G. L. GILBERT ET AL. Appendix A Perceptions of Diversity Survey 1) Diversity encourages a deeper understanding of students and the ways that our identities influence learning. 2) When we commit to diversity, we are also paving the way for equal opportunities. 3) Past history with discrimination has influenced today’s society. 4) Everyone has the same opportunities. 5) The university promotes diversity. 6) Diversity education brings society together. 7) The university provides students, faculty, and staff with opportunities to learn from different cultures. 8) Diversity values differences more than commonalities. 9) My experiences at the university have encouraged me to pursue social interactions with others of different cultural or ethnic backgrounds. 10) I feel pressured to use ASL, even though it is not my primary language. 11) I feel comfortable approaching faculty who are of a dif- ferent race/ethnicity than mine. 12) Minorities get unnecessary special privileges ahead of more qualified people. 13) The university should require students to take at least one cultural and ethnic diversity course as a graduation require- ment. 14) Diversity is a distraction from major issues that threat- ens national unity and local communities. 15) Interacting with diverse groups will improve learning, build community involvement, and new attitudes of the mind and heart. 16) Diversity is the key to helping students understand and find their many identities. 17) Diversity influences how and what students learn. 18) Diversity is a non-issue—we all have equal access to re- sources. 19) The university plays an important role in helping all members of the community understand diversity. 20) Supporting diversity is the right thing to do. 21) Diversity creates a commitment to equality and equal opportunities. 22) Diversity depends on groups of people to build fairness and equality. 23) Support programs and financial aid are provided equally to all students. 24) I prefer to interact with students of the same race/ethnic- ity because I feel that students of different races/ethnicities do not understand my culture. 25) Instruction is modified to suit students’ language and learning styles. 26) Faculty sees all students as capable regardless of race/ ethnicity. 27) My sense of ethnic identity is strengthened by my sense of self and my community. 28) I do not understand why people of color eat together at the cafeteria or are often seen sitting and walking together around campus. 29) It is important that my professors use examples that are relevant to different race/ethnic groups. 30) My opinions are valued by others. 31) Faculty use race/ethnic examples where appropriate. 32) There is diversity and equality in faculty and staff of color. 33) I feel that when I participate in class, I have the support of my classmates and faculty. 34) New changes will lead to the loss of tradition. 35) Students and faculty are accepting of individual differ- ences. 36) There is increased confusion about identity categories (e.g. deaf/hard of hearing, race/ethnicity). 37) When the university tries to accommodate diverse groups, the result is lowered standards. 38) Students need a curriculum that helps them to analyze their identities, and increase opportunities to learn about other cultures. 39) My race gives me special privileges. 40) Being able to voice your opinion allows for different per- spectives to be heard. Note: Survey responses were rated on the Likert (1 - 5) scale from strongly disagree (1) to strongly agree (5). Appendix B Focus Group Questions 1) Diversity means similar and different things to everyone. What is your definition of diversity? 2) Based on your definition of diversity, do you feel that the university represents diversity? From “Shades of Distinction: How Students of Color Experience the University” 2009 Campus Climate Survey In 2009, a Student Cultural Attitudes and Climate Survey was distributed to students on campus. The findings suggested strengths and areas of opportunity for improvement at the uni- versity. For example, students reported that their experiences encouraged them to initiate contact with people of different ethnicities or cultures. The following questions are meant to give us more insight on the 2009 findings that were found to be areas where the university can improve. 3) We have heard from some students that they feel that their professors ignore their comments or questions. Why do you think that students feel ignored by their professors? What be- haviors by professors may lead students to believe they are being ignored? 4) We found in a 2009 survey that more White, Biracial, and Asian/Pacific Islanders are comfortable being in situations where they are the only person in their racial/ethnic group than African American students. What would make you comfortable in such situations? 5) We asked students whether they think that students should be required to take at least one course on the role of ethnicity and race in society as a condition for graduation. Do you think that completion of a course on ethnicity and race should be required of all students? 6) Some students believe that there is racial/ethnic separation on campus. What factors do you think contribute to this percep- tion? 7) Not everyone agrees that there are friendships between students of different racial and ethnic groups on campus. Is there a strong presence of interracial and inter-ethnic friend- Open Access 886  G. L. GILBERT ET AL. Open Access 887 ships on campus? 8) There was a variety of responses about being able to rec- ognize culturally biased behavior based at the university. Has your ability to recognize culturally biased behaviors been in- fluenced during your time as a student? 9) A high number of students responded ‘No’ and ‘Don’t know’ when asked whether they stop themselves from using language that may be offensive to others. Do some students use offensive language? 10) A low percentage of Asian/Pacific Islanders reported that they initiate contact with people of different cultural and ethnic backgrounds. Do you interact with people of different racial/ ethnic groups? 11) There are differences among groups in feeling that they belong at this university. Why do you think that this difference among groups exists? Is there a difference in how people ex- perience the university? 12) A high number of seniors and graduate students disagree that the quality of academic programs here at the university is excellent compared to freshmen, sophomores, and juniors. What do you think is the quality of the curriculum here at the university?
|