 Food and Nutrition Sciences, 2013, 4, 1209-1220 Published Online December 2013 (http://www.scirp.org/journal/fns) http://dx.doi.org/10.4236/fns.2013.412155 Open Access FNS Antioxidants from Syrah Grapes (Vitis vinifera L. cv. Syrah). Extraction Process through Optimization by Response Surface Methodology Youssef El Hajj1,2, Espérance Debs3, Catherine Nguyen2, Richard G. Maroun1*, Nicolas Louka1 1Unité Technologies et Valorisation Alimentaire, Centre d’Analyses et de Recherche, Faculté des Sciences, Université Saint-Joseph de Beyrouth, Beirut, Lebanon; 2INSERM, U928, Technological Advances for Genomics and Clinics Laboratory, Marseille, France; 3Department of Biology, Faculty of Sciences, University of Balamand, Tripoli, Lebanon. Email: *richard.maroun@usj.edu.lb Received September 1st, 2013; revised October 1st, 2013; accepted October 8th, 2013 Copyright © 2013 Youssef El Hajj et al. This is an open access article distributed under the Creative Commons Attribution License, which permits unrestricted use, distribution, and reproduction in any medium, provided the original work is properly cited. In accor- dance of the Creative Commons Attribution License all Copyrights © 2013 are reserved for SCIRP and the owner of the intellectual property Youssef El Hajj et al. All Copyright © 2013 are guarded by law and by SCIRP as a guardian. ABSTRACT In this work, optimization of phenolic compounds (PC) and monomeric anthocyanins (MA) extraction from Syrah (Sy) wine grapes (Vitis vinifera L. cv. Syrah) using response surface methodology was conducted. The comparisons between two extraction mixtures, Acetone/Water (A/W) as well as Methanol/Water (M/W) and the effects of three critical vari- ables, Extraction Time (between 8 and 88 h), Extraction Temperature (between 1°C and 35°C) and Solvent Content (be- tween 63% and 97%), on Phenolic Compounds Yield (PCY), Monomeric Anthocyanins Yield (MAY) and the DPPH Free Radical Inhibition Potential (DFRIP) were studied. The highest PCY was obtained in 63% A/W solvent content after 88 h incubation at 35°C. The highest MAY was acquired in 97% M/W solvent content after 8 h incubation at 17°C. The highest DFRIP of the extract was attained using 97% A/W solvent content after 16 h incubation at 35°C. The low cost of this process, on economic and environmental levels, could lead to interesting applications on an industrial scale. It could be used to obtain bioactive phytochemicals from direct material or byproducts for either therapeutic or nutri- tional purposes. Keywords: Phenolic Compounds; Monomeric Anthocyanins; Antiradical Scavenging Potential; Extraction Optimization; Grape; Time; Solvent and Temperature 1. Introduction Importance of natural antioxidants for medical and food sectors has been underlined by numerous works [1-15]. Nowadays, many studies report increasing interest in wine grapes such as Syrah (Vitis vinifera L. cv. Syrah) as source of powerful antioxidants, mainly phenolic com- pounds (PC). The aromatic ring, bound to a hydroxyl group, is the basal structure common to all phenolic compounds [3]. This configuration allows radical scavenging potential and gives phenolic compounds a multitude of bioactive roles [4]. Furthermore, the high industrial value of these molecules is well proven, especially due to food lipid antioxidation [5]. Thus PC can be considered as added- value phytochemicals of plant waste material, justifying their isolation from the plant matrix by extraction. Recovery of PC is commonly performed through a sol- vent-extraction procedure but, currently, only ambiguous data on the methods and conditions for extraction are available and sometimes contradictory. The aim of an extraction process should be to provide a possible maximum yield of substances of the highest quality (quantity of target compounds and antioxidant potential of the extract). Just few works, on antioxidant recovery from grapes, have targeted the optimization of some process parameters [6]. The variables mostly stud- ied have been: the type of extraction solvent or solvent mixture, extraction time and extraction temperature [6]. Type of solvent has been the most investigated factor. Acetone and methanol were reported as two of the best *Corresponding author.  Antioxidants from Syrah Grapes (Vitis vinifera L. cv. Syrah). Extraction Process through Optimization by Response Surface Methodology 1210 solvents for extraction of PC and MA from plants [7-10]. Mixtures of solvents and water have revealed to be more efficient in extracting phenolic constituents than the cor- responding mono-component solvent system [11,12]. Time and temperature of extraction are important pa- rameters to be optimized especially in order to minimize energy cost of the process. Many authors agreed on the fact that an increase in the working temperature favors extraction and enhances both the solubility of the solute and the diffusion coefficient. However, phenolic com- pounds can be denatured beyond a certain range [2,11, 13]. More contradictories are the data available for incu- bation time during extraction: some authors chose quite short extraction times [11,13,14]; other long ones [2,9, 12,15,16]. After having optimized the extraction process of Total Phenolic Compounds (TPC) and MA from Cabernet Sauvignon (CS) grapes in a previous study [1], our ob- jective in this work is to optimize the extraction process of TPC and MA from Sy grapes in addition to the deter- mination of FRIP (Free Radical Inhibition Potential) of the extracts. This will provide us with a better under- standing of the extraction process parameters impact on the quality of the extracted PC and MA. In order to achieve our goal, we used the response surface method- ology (RSM) with a five-level, and three-variable central composite design. We have noticed that literature lacks optimization studies regarding the extraction process of TPC and MA from grapes as well as FRIP analysis of the obtained extracts. Therefore we determined the optimal parameters (solvent type, water concentration in the sol- vent system, extraction time and extraction temperature) needed to give the highest TPC, MA yields and FRIP from Sy grapes extracts. We draw a response surface plot of the extraction kinetics corresponding to these parame- ters and aimed to improve the extraction to a low cost and energy depending procedure. A solvent extraction method was proposed with simple, no complex machin- ery and without expensive pre-treatments of the starting material or excessive heating. We obtained a PC rich extracts with a high free radical scavenging potential. These extracts could be used as additives for food pres- ervation, as well as in pharmaceutical, cosmetics and nutraceutical industries. 2. Material and Methods 2.1. Reagents The solvents used for the extraction of the samples were pure water, acetone and methanol of analytical grade from Scharlau (Barcelona, Spain) same as Ethanol (Merck) used for DFRIP (DPPH Free Radical Inhibition Potential) determination. The Folin reagent (Sigma Che- mical Co., St. Louis, MO, USA) and sodium carbonate (Fluka, Buchs, Switzerland) were used for the measure- ment of the total phenolic compounds concentrations using the Folin-Ciocalteu method, the calibration curve was constructed with gallic acid (Sigma Chemical Co., St. Louis, MO, USA). Potassium chloride (Fluka, Buchs, Switzerland) and sodium acetate (Scharlau, Barcelona, Spain) were used for total monomeric anthocyanin de- termination by the pH-differential method. Resveratrol (Sigma Chemical Co.) and DPPH (2,2-Diphenyl-picryl- hydrazyl) reagent (Sigma Chemical Co.) were used for DFRIP determination. 2.2. Sample Preparation Grapes (Vitis vinifera L. cv. Syrah) were collected from different crop areas located at different regions in the Lebanese Bekaa valley. Harvesting took place during summer/fall of 2010 (August till October). Grapes from different regions, at different maturity stages and from several localization on the vine were placed in a single container. All batch was crushed to obtain a fine grape paste (maximum particle size = 1 mm). The paste was frozen at −80ºC until use. Each tube/experimental point was subjected to a different parametrical pattern (Table 1). Extracts were then centrifuged (6000 g) and filtered through RC membranes (0.2 µm). Samples were kept at −80ºC ready to be analyzed. 2.3. Total Phenolic Compound Determination Total phenolic compounds were determined according to the Folin-Ciocalteu reagent with the Micro method pre- viously described by Andrew Waterhouse (Department of Viticulture and Enology, University of California, Davis, USA). The absorbance of each solution was de- termined at 765 nm against the blank (water). A calibra- tion curve was created by plotting absorbance vs. con- centration of the standards (solutions of different Gallic Acid concentrations) and the total phenols concentrations were determined in all samples. Phenolic Compound Yield (PCY) was calculated by transforming milligrams of Gallic Acid Equivalents (GAE) per liter (mg GAE/L) into grams of GAE per 100 g of grape paste or fresh weight (g GAE/100g) which is % GAE. 2.4. Total Monomeric Anthocyanin Determination Monomeric anthocyanins were measured by the pH-dif- ferential method, which relies on the structural transfor- mation of the anthocyanin chromophore as a function of pH, and can then be measured using optical spectroscopy [17]. Two dilutions of each sample were prepared using he appropriate, previously determined dilution factor: t Open Access FNS 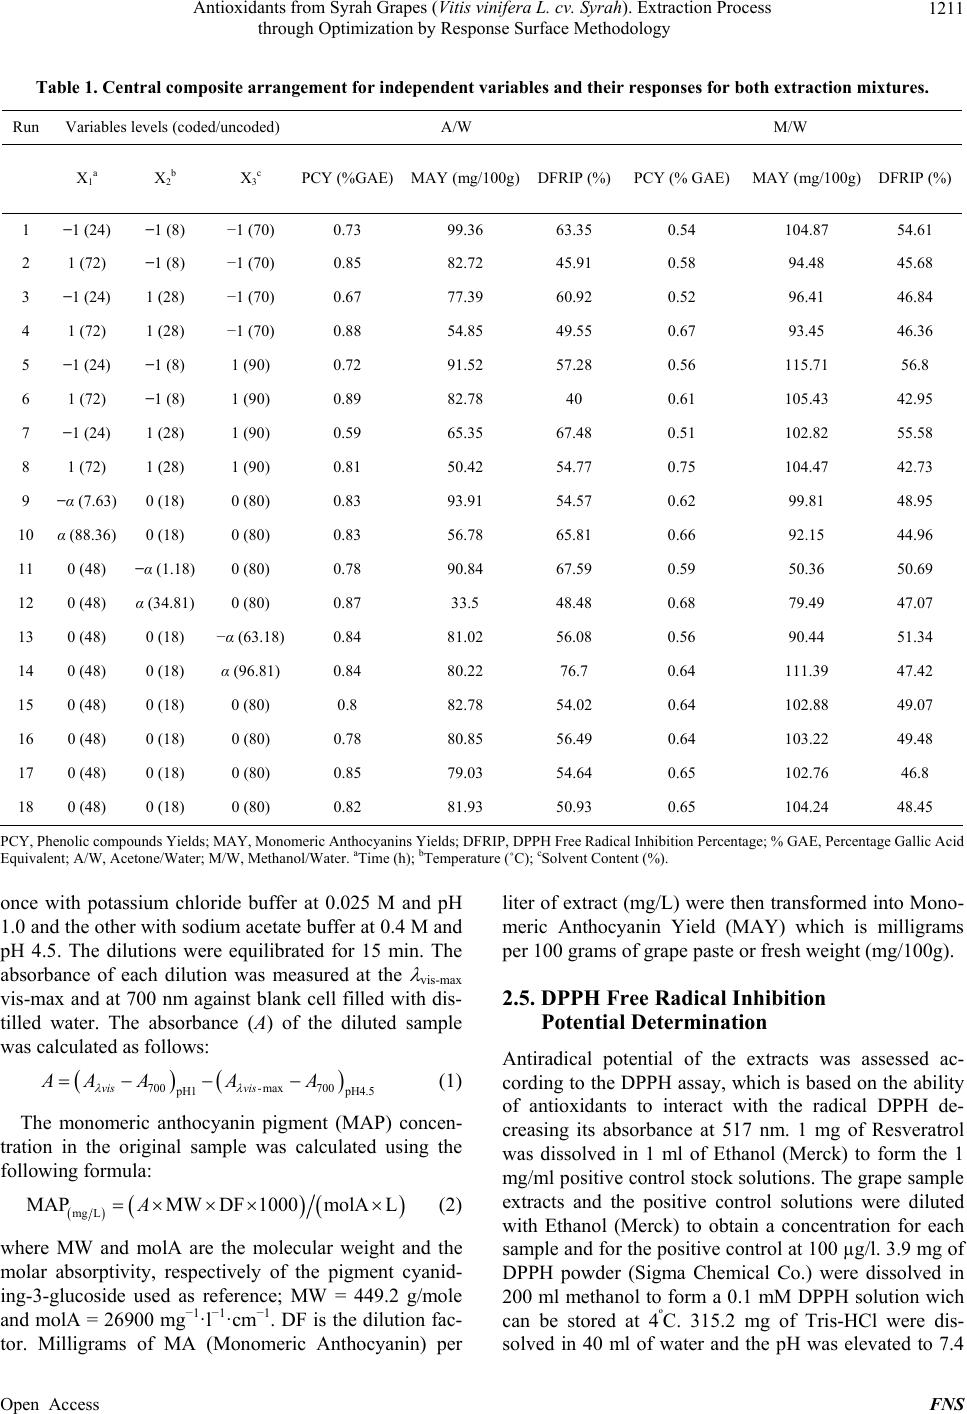 Antioxidants from Syrah Grapes (Vitis vinifera L. cv. Syrah). Extraction Process through Optimization by Response Surface Methodology Open Access FNS 1211 Table 1. Central composite arrangement for independent variables and their responses for both extraction mixtures. Run Variables levels (coded/uncoded) A/W M/W X 1a X 2b X 3c PCY (%GAE)MAY (mg/100g)DFRIP (%)PCY (% GAE) MAY (mg/100g) DFRIP (%) 1 −1 (24) −1 (8) −1 (70) 0.73 99.36 63.35 0.54 104.87 54.61 2 1 (72) −1 (8) −1 (70) 0.85 82.72 45.91 0.58 94.48 45.68 3 −1 (24) 1 (28) −1 (70) 0.67 77.39 60.92 0.52 96.41 46.84 4 1 (72) 1 (28) −1 (70) 0.88 54.85 49.55 0.67 93.45 46.36 5 −1 (24) −1 (8) 1 (90) 0.72 91.52 57.28 0.56 115.71 56.8 6 1 (72) −1 (8) 1 (90) 0.89 82.78 40 0.61 105.43 42.95 7 −1 (24) 1 (28) 1 (90) 0.59 65.35 67.48 0.51 102.82 55.58 8 1 (72) 1 (28) 1 (90) 0.81 50.42 54.77 0.75 104.47 42.73 9 −α (7.63) 0 (18) 0 (80) 0.83 93.91 54.57 0.62 99.81 48.95 10 α (88.36) 0 (18) 0 (80) 0.83 56.78 65.81 0.66 92.15 44.96 11 0 (48) −α (1.18) 0 (80) 0.78 90.84 67.59 0.59 50.36 50.69 12 0 (48) α (34.81) 0 (80) 0.87 33.5 48.48 0.68 79.49 47.07 13 0 (48) 0 (18) −α (63.18) 0.84 81.02 56.08 0.56 90.44 51.34 14 0 (48) 0 (18) α (96.81) 0.84 80.22 76.7 0.64 111.39 47.42 15 0 (48) 0 (18) 0 (80) 0.8 82.78 54.02 0.64 102.88 49.07 16 0 (48) 0 (18) 0 (80) 0.78 80.85 56.49 0.64 103.22 49.48 17 0 (48) 0 (18) 0 (80) 0.85 79.03 54.64 0.65 102.76 46.8 18 0 (48) 0 (18) 0 (80) 0.82 81.93 50.93 0.65 104.24 48.45 PCY, Phenolic compounds Yields; MAY, Monomeric Anthocyanins Yields; DFRIP, DPPH Free Radical Inhibition Percentage; % GAE, Percentage Gallic Acid Equivalent; A/W, Acetone/Water; M/W, Methanol/Water. aTime (h); bTemperature (˚C); cSolvent Content (%). once with potassium chloride buffer at 0.025 M and pH 1.0 and the other with sodium acetate buffer at 0.4 M and pH 4.5. The dilutions were equilibrated for 15 min. The absorbance of each dilution was measured at the vis-max vis-max and at 700 nm against blank cell filled with dis- tilled water. The absorbance (A) of the diluted sample was calculated as follows: 700-max 700 H1 pH4.5 vis vis AA AAA (1) The monomeric anthocyanin pigment (MAP) concen- tration in the original sample was calculated using the following formula: mg L MAPMWDF 1000molALA (2) where MW and molA are the molecular weight and the molar absorptivity, respectively of the pigment cyanid- ing-3-glucoside used as reference; MW = 449.2 g/mole and molA = 26900 mg−1·l−1·cm−1. DF is the dilution fac- tor. Milligrams of MA (Monomeric Anthocyanin) per liter of extract (mg/L) were then transformed into Mono- meric Anthocyanin Yield (MAY) which is milligrams per 100 grams of grape paste or fresh weight (mg/100g). 2.5. DPPH Free Radical Inhibition Potential Determination Antiradical potential of the extracts was assessed ac- cording to the DPPH assay, which is based on the ability of antioxidants to interact with the radical DPPH de- creasing its absorbance at 517 nm. 1 mg of Resveratrol was dissolved in 1 ml of Ethanol (Merck) to form the 1 mg/ml positive control stock solutions. The grape sample extracts and the positive control solutions were diluted with Ethanol (Merck) to obtain a concentration for each sample and for the positive control at 100 µg/l. 3.9 mg of DPPH powder (Sigma Chemical Co.) were dissolved in 200 ml methanol to form a 0.1 mM DPPH solution wich can be stored at 4ºC. 315.2 mg of Tris-HCl were dis- solved in 40 ml of water and the pH was elevated to 7.4  Antioxidants from Syrah Grapes (Vitis vinifera L. cv. Syrah). Extraction Process through Optimization by Response Surface Methodology 1212 with NaOH solution (10 mM) to obtain a Tris-HCl (50 mM, pH 7.4) buffer. A mix of 50 µl of the different sample and positive control dilutions, 450 µl of the Tris-HCl buffer and 1.5 ml of the DPPH solution were incubated for 30 minutes at room temperature then the absorbance was read at 517 nm. DFRIP of the original sample was calculated using the following formula: % DFRIP 100 res sres AAA (3) where Ares is the absorbance of the solution containing DPPH after inhibition of its free radicals by resveratrol, and As is the absorbance of the solution containing DPPH after inhibition of its free radicals by the grape extract sample. 2.6. Experimental Design In this response surface methodology study, a rotatable central composite design was used to evaluate the main effects of the factors: extraction time (X1), extraction temperature (X2), and solvent content (degree or per- centage) (X3) and their interaction on total phenolic compounds, monomeric anthocyannins yields and DPPH Free Radical Inhibition Potential obtained from grapes (Vitis vinifera L. cv. Syrah) using Acetone or Methanol separately as extraction solvents. Eighteen experiments (Table 1) were performed per extraction solvent mixture including four experiments as the repeatability of the measurements at the center of the experimental domain. All the factors levels are reported in Table 2. Data pertaining to three independent, and two response, vari- able were analyzed to get a multiple regression equation: 33 23 2 0 11 11 nn nnnnmnm nn nmn Yb bXbXbXX (4) where Y is the predicted response, Xn and Xm are the coded values of the factors, b0 is the mean value of re- sponses at the central point of the experiment; and bn, bnn and bnm are the linear, quadratic and interaction coeffi- Table 2. Independent variables and their levels used for central composite rotatable design. Independent variables SymbolCoded variable levels −α −1 0 +1+α Extraction time (h) X1 7.64 24 48 7288.36 Extraction temperature (˚C) X2 1.18 8 18 2834.82 Solvent degree (%) X3 63.18 70 80 9096.82 cients, respectively. Analysis of the coefficients of re- gression models was carried out using an ANOVA table to find the significance of each coefficient (Table 3). This significance was illustrated using Pareto charts (Fig- ure 1). The significance of Lack of fit for each extraction model is shown in Table 4. The process was optimized using response surface methodology for two independent variables at a time. The third parameter was fixed at zero level, the response surface graphs gave values of inde- pendent variables allowing the optimization of the proc- ess, considering that all the independent variable condi- tions can be identified for maximum PCY, MAY yields and DFRIP (Figures 2 and 3). The optimum experimen- tal conditions were deduced from this study. Table 5 shows the best time, temperature and solvent degree where the highest PCY, MAY and DFRIP are obtained using A/W or M/W. Table 3. Test of significance effect for each independent variable, quadratic and interaction effect between variables. (A parameter is significant if Pi < 0.05). A/W M/W P1 (PCY) P2 (MAY) P3 (DFRIP) P4 (PCY) P5 (MAY) P6 (DFRIP) X1a 0.04630.00020.0185 0.0001 0.00080.0022 X2b 0.77920.00010.5357 0.0007 0.00190.0439 X3c 0.70490.02340.0274 0.0013 0.00010.674 X12d0.74110.06170.3929 0.0134 0.01960.3028 X1X2e0.56620.07750.2022 0.0004 0.002 0.0659 X1X30.80410.04280.8683 0.0088 0.08910.0139 X22 0.68690.00090.8709 0.0079 0.00000.476 X2X30.46390.15370.0359 0.3081 0.10560.1887 X32 0.85390.32160.0222 0.0008 0.00080.271 aTime, bTemperature, cSolvent Content, dQuadratic effect of time, eInterac- tion effect between Time and Temperature. Table 4. Validation of the model showed by the responses lack of fit values. Lack of fit Sum of squares Df f ratio P value PCY 0.052 5 11.68 0.0351 MAY 135.83 5 10.38 0.0412 A/W DFRIP930.545 5 34.82 0.0074 PCY 0.0119 5 72 0.0025 MAY 1260.14 5 557.79 0.0001 M/W DFRIP54.558 5 7.85 0.0601 Open Access FNS 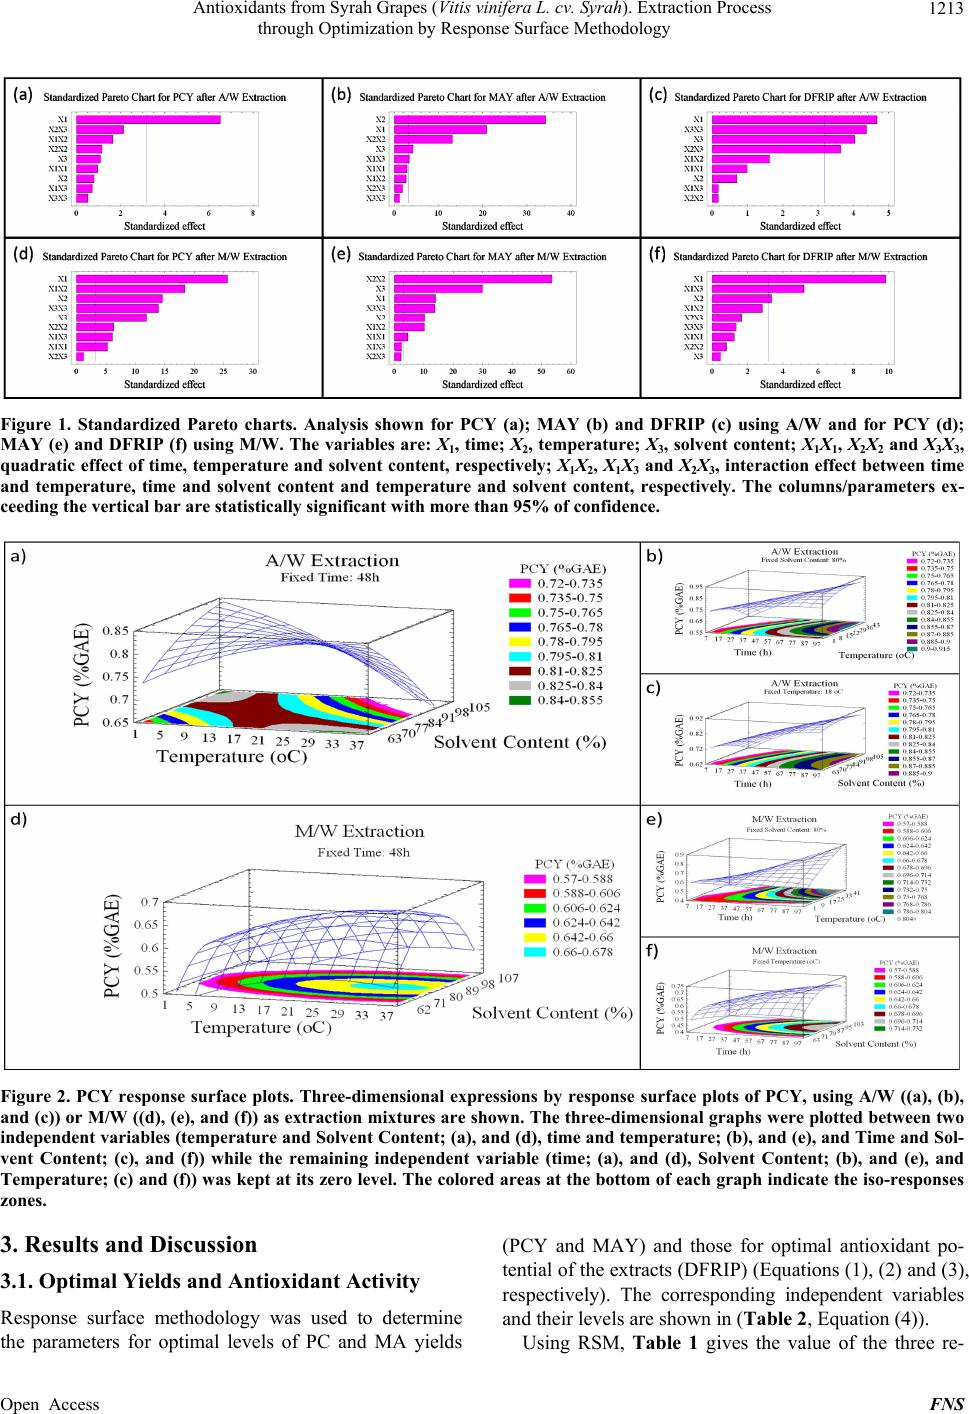 Antioxidants from Syrah Grapes (Vitis vinifera L. cv. Syrah). Extraction Process through Optimization by Response Surface Methodology Open Access FNS 1213 Figure 1. Standardized Pareto charts. Analysis shown for PCY (a); MAY (b) and DFRIP (c) using A/W and for PCY (d); MAY (e) and DFRIP (f) using M/W. The variables are: X1, time; X2, temperature; X3, solvent content; X1X1, X2X2 and X3X3, quadratic effect of time, temperature and solvent content, respectively; X1X2, X1X3 and X2X3, interaction effect between time and temperature, time and solvent content and temperature and solvent content, respectively. The columns/parameters ex- ceeding the vertical bar are statistically significant with more than 95% of confidence. Figure 2. PCY response surface plots. Three-dimensional expressions by response surface plots of PCY, using A/W ((a), (b), and (c)) or M/W ((d), (e), and (f)) as extraction mixtures are shown. The three-dimensional graphs were plotted between two independent variables (temperature and Solvent Content; (a), and (d), time and temperature; (b), and (e), and Time and Sol- vent Content; (c), and (f)) while the remaining independent variable (time; (a), and (d), Solvent Content; (b), and (e), and Temperature; (c) and (f)) was kept at its zero level. The colored areas at the bottom of each graph indicate the iso-responses zones. 3. Results and Discussion 3.1. Optimal Yields and Antioxidant Activity Response surface methodology was used to determine the parameters for optimal levels of PC and MA yields (PCY and MAY) and those for optimal antioxidant po- tential of the extracts (DFRIP) (Equations (1), (2) and (3), respectively). The corresponding independent variables and their levels are shown in (Table 2, Equation (4)). Using RSM, Table 1 gives the value of the three re- 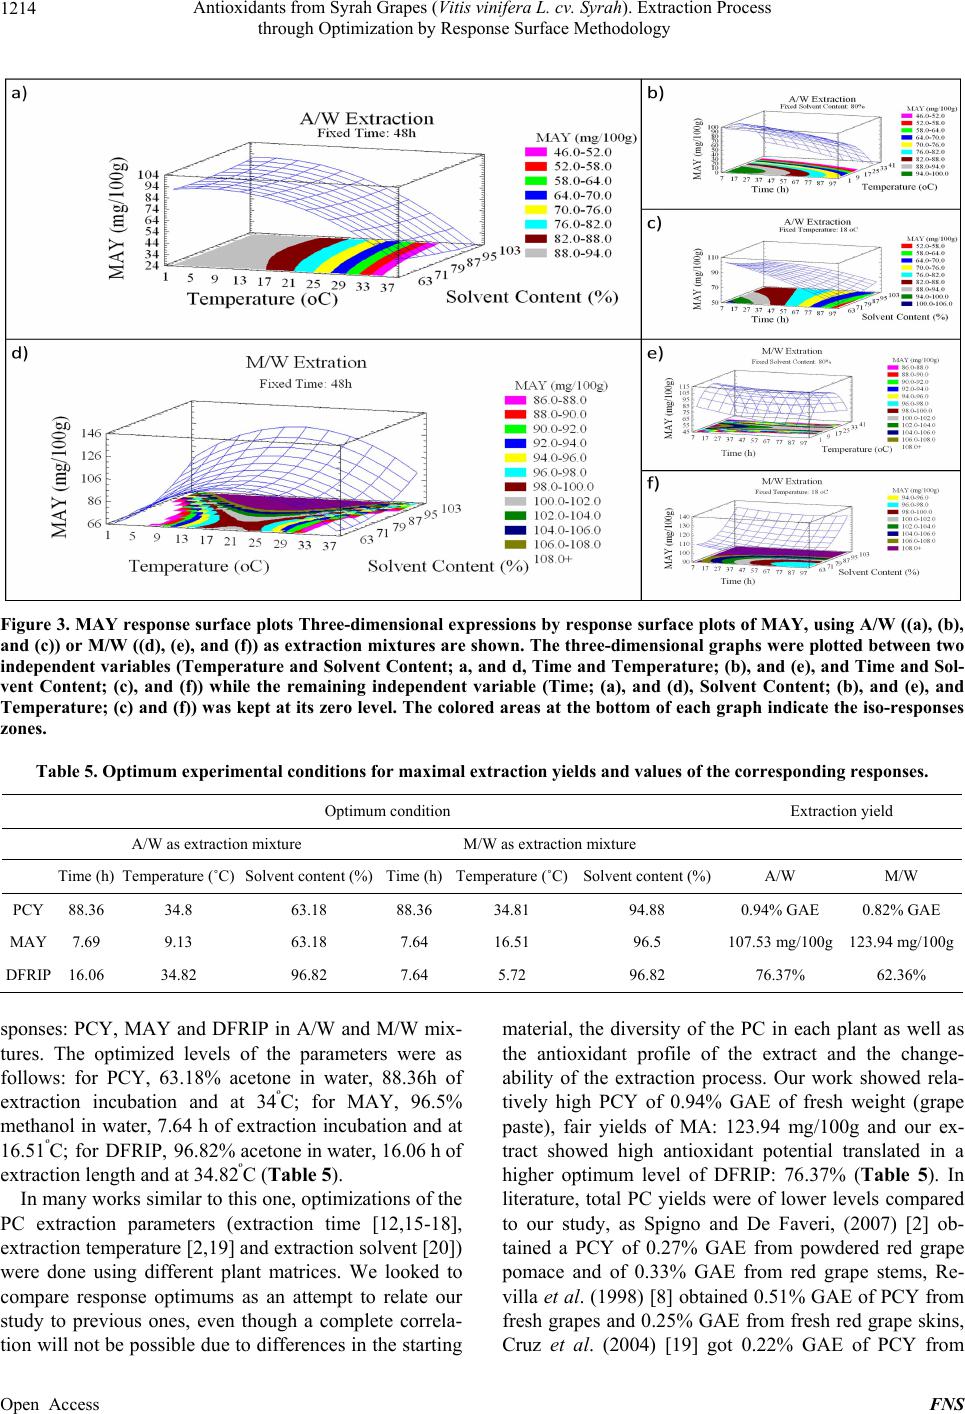 Antioxidants from Syrah Grapes (Vitis vinifera L. cv. Syrah). Extraction Process through Optimization by Response Surface Methodology 1214 Figure 3. MAY response surface plots Three-dimensional expressions by response surface plots of MAY, using A/W ((a), (b), and (c)) or M/W ((d), (e), and (f)) as extraction mixtures are shown. The three-dimensional graphs were plotted between two independent variables (Temperature and Solvent Content; a, and d, Time and Temperature; (b), and (e), and Time and Sol- vent Content; (c), and (f)) while the remaining independent variable (Time; (a), and (d), Solvent Content; (b), and (e), and Temperature; (c) and (f)) was kept at its zero level. The colored areas at the bottom of each graph indicate the iso-responses zones. Table 5. Optimum experimental conditions for maximal extraction yields and values of the corresponding responses. Optimum condition Extraction yield A/W as extraction mixture M/W as extraction mixture Time (h) Temperature (˚C) Solvent content (%) Time (h)Temperature (˚C)Solvent content (%)A/W M/W PCY 88.36 34.8 63.18 88.36 34.81 94.88 0.94% GAE 0.82% GAE MAY 7.69 9.13 63.18 7.64 16.51 96.5 107.53 mg/100g 123.94 mg/100g DFRIP 16.06 34.82 96.82 7.64 5.72 96.82 76.37% 62.36% sponses: PCY, MAY and DFRIP in A/W and M/W mix- tures. The optimized levels of the parameters were as follows: for PCY, 63.18% acetone in water, 88.36h of extraction incubation and at 34ºC; for MAY, 96.5% methanol in water, 7.64 h of extraction incubation and at 16.51ºC; for DFRIP, 96.82% acetone in water, 16.06 h of extraction length and at 34.82ºC (Table 5). In many works similar to this one, optimizations of the PC extraction parameters (extraction time [12,15-18], extraction temperature [2,19] and extraction solvent [20]) were done using different plant matrices. We looked to compare response optimums as an attempt to relate our study to previous ones, even though a complete correla- tion will not be possible due to differences in the starting material, the diversity of the PC in each plant as well as the antioxidant profile of the extract and the change- ability of the extraction process. Our work showed rela- tively high PCY of 0.94% GAE of fresh weight (grape paste), fair yields of MA: 123.94 mg/100g and our ex- tract showed high antioxidant potential translated in a higher optimum level of DFRIP: 76.37% (Table 5). In literature, total PC yields were of lower levels compared to our study, as Spigno and De Faveri, (2007) [2] ob- tained a PCY of 0.27% GAE from powdered red grape pomace and of 0.33% GAE from red grape stems, Re- villa et al. (1998) [8] obtained 0.51% GAE of PCY from fresh grapes and 0.25% GAE from fresh red grape skins, Cruz et al. (2004) [19] got 0.22% GAE of PCY from Open Access FNS 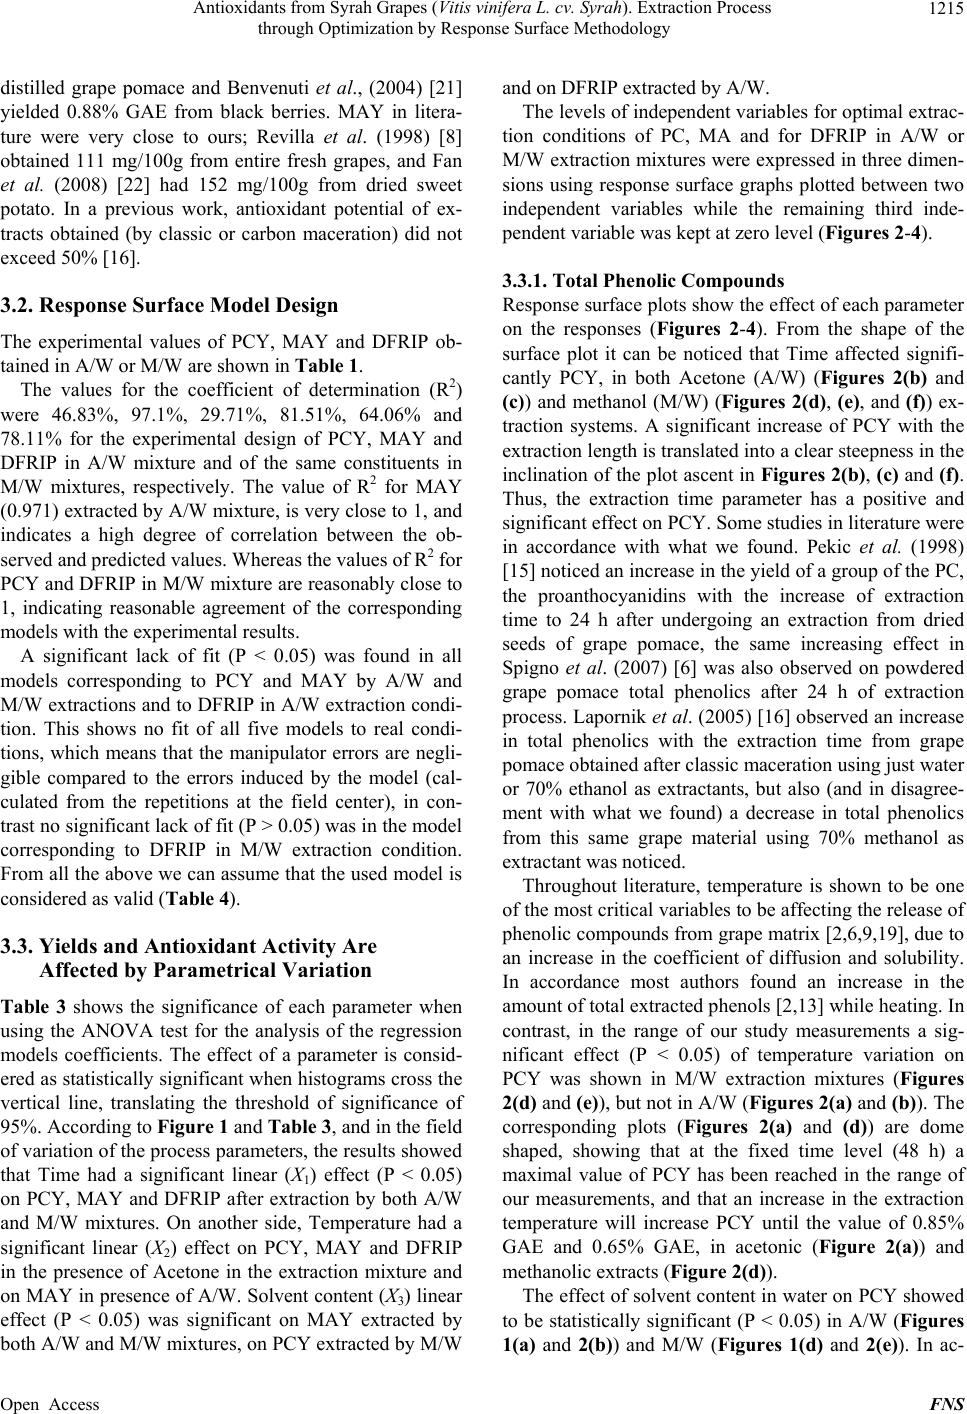 Antioxidants from Syrah Grapes (Vitis vinifera L. cv. Syrah). Extraction Process through Optimization by Response Surface Methodology 1215 distilled grape pomace and Benvenuti et al., (2004) [21] yielded 0.88% GAE from black berries. MAY in litera- ture were very close to ours; Revilla et al. (1998) [8] obtained 111 mg/100g from entire fresh grapes, and Fan et al. (2008) [22] had 152 mg/100g from dried sweet potato. In a previous work, antioxidant potential of ex- tracts obtained (by classic or carbon maceration) did not exceed 50% [16]. 3.2. Response Surface Model Design The experimental values of PCY, MAY and DFRIP ob- tained in A/W or M/W are shown in Table 1. The values for the coefficient of determination (R2) were 46.83%, 97.1%, 29.71%, 81.51%, 64.06% and 78.11% for the experimental design of PCY, MAY and DFRIP in A/W mixture and of the same constituents in M/W mixtures, respectively. The value of R2 for MAY (0.971) extracted by A/W mixture, is very close to 1, and indicates a high degree of correlation between the ob- served and predicted values. Whereas the values of R2 for PCY and DFRIP in M/W mixture are reasonably close to 1, indicating reasonable agreement of the corresponding models with the experimental results. A significant lack of fit (P < 0.05) was found in all models corresponding to PCY and MAY by A/W and M/W extractions and to DFRIP in A/W extraction condi- tion. This shows no fit of all five models to real condi- tions, which means that the manipulator errors are negli- gible compared to the errors induced by the model (cal- culated from the repetitions at the field center), in con- trast no significant lack of fit (P > 0.05) was in the model corresponding to DFRIP in M/W extraction condition. From all the above we can assume that the used model is considered as valid (Table 4). 3.3. Yields and Antioxidant Activity Are Affected by Parametrical Variation Table 3 shows the significance of each parameter when using the ANOVA test for the analysis of the regression models coefficients. The effect of a parameter is consid- ered as statistically significant when histograms cross the vertical line, translating the threshold of significance of 95%. According to Figure 1 and Table 3, and in the field of variation of the process parameters, the results showed that Time had a significant linear (X1) effect (P < 0.05) on PCY, MAY and DFRIP after extraction by both A/W and M/W mixtures. On another side, Temperature had a significant linear (X2) effect on PCY, MAY and DFRIP in the presence of Acetone in the extraction mixture and on MAY in presence of A/W. Solvent content (X3) linear effect (P < 0.05) was significant on MAY extracted by both A/W and M/W mixtures, on PCY extracted by M/W and on DFRIP extracted by A/W. The levels of independent variables for optimal extrac- tion conditions of PC, MA and for DFRIP in A/W or M/W extraction mixtures were expressed in three dimen- sions using response surface graphs plotted between two independent variables while the remaining third inde- pendent variable was kept at zero level (Figures 2-4). 3.3.1. Total Phenolic Compounds Response surface plots show the effect of each parameter on the responses (Figures 2-4). From the shape of the surface plot it can be noticed that Time affected signifi- cantly PCY, in both Acetone (A/W) (Figures 2(b) and (c)) and methanol (M/W) (Figures 2(d), (e), and (f)) ex- traction systems. A significant increase of PCY with the extraction length is translated into a clear steepness in the inclination of the plot ascent in Figures 2(b), (c) and (f). Thus, the extraction time parameter has a positive and significant effect on PCY. Some studies in literature were in accordance with what we found. Pekic et al. (1998) [15] noticed an increase in the yield of a group of the PC, the proanthocyanidins with the increase of extraction time to 24 h after undergoing an extraction from dried seeds of grape pomace, the same increasing effect in Spigno et al. (2007) [6] was also observed on powdered grape pomace total phenolics after 24 h of extraction process. Lapornik et al. (2005) [16] observed an increase in total phenolics with the extraction time from grape pomace obtained after classic maceration using just water or 70% ethanol as extractants, but also (and in disagree- ment with what we found) a decrease in total phenolics from this same grape material using 70% methanol as extractant was noticed. Throughout literature, temperature is shown to be one of the most critical variables to be affecting the release of phenolic compounds from grape matrix [2,6,9,19], due to an increase in the coefficient of diffusion and solubility. In accordance most authors found an increase in the amount of total extracted phenols [2,13] while heating. In contrast, in the range of our study measurements a sig- nificant effect (P < 0.05) of temperature variation on PCY was shown in M/W extraction mixtures (Figures 2(d) and (e)), but not in A/W (Figures 2(a) and (b)). The corresponding plots (Figures 2(a) and (d)) are dome shaped, showing that at the fixed time level (48 h) a maximal value of PCY has been reached in the range of our measurements, and that an increase in the extraction temperature will increase PCY until the value of 0.85% GAE and 0.65% GAE, in acetonic (Figure 2(a)) and methanolic extracts (Figure 2(d)). The effect of solvent content in water on PCY showed to be statistically significant (P < 0.05) in A/W (Figures (a) and 2(b)) and M/W (Figures 1(d) and 2(e)). In ac- 1 Open Access FNS 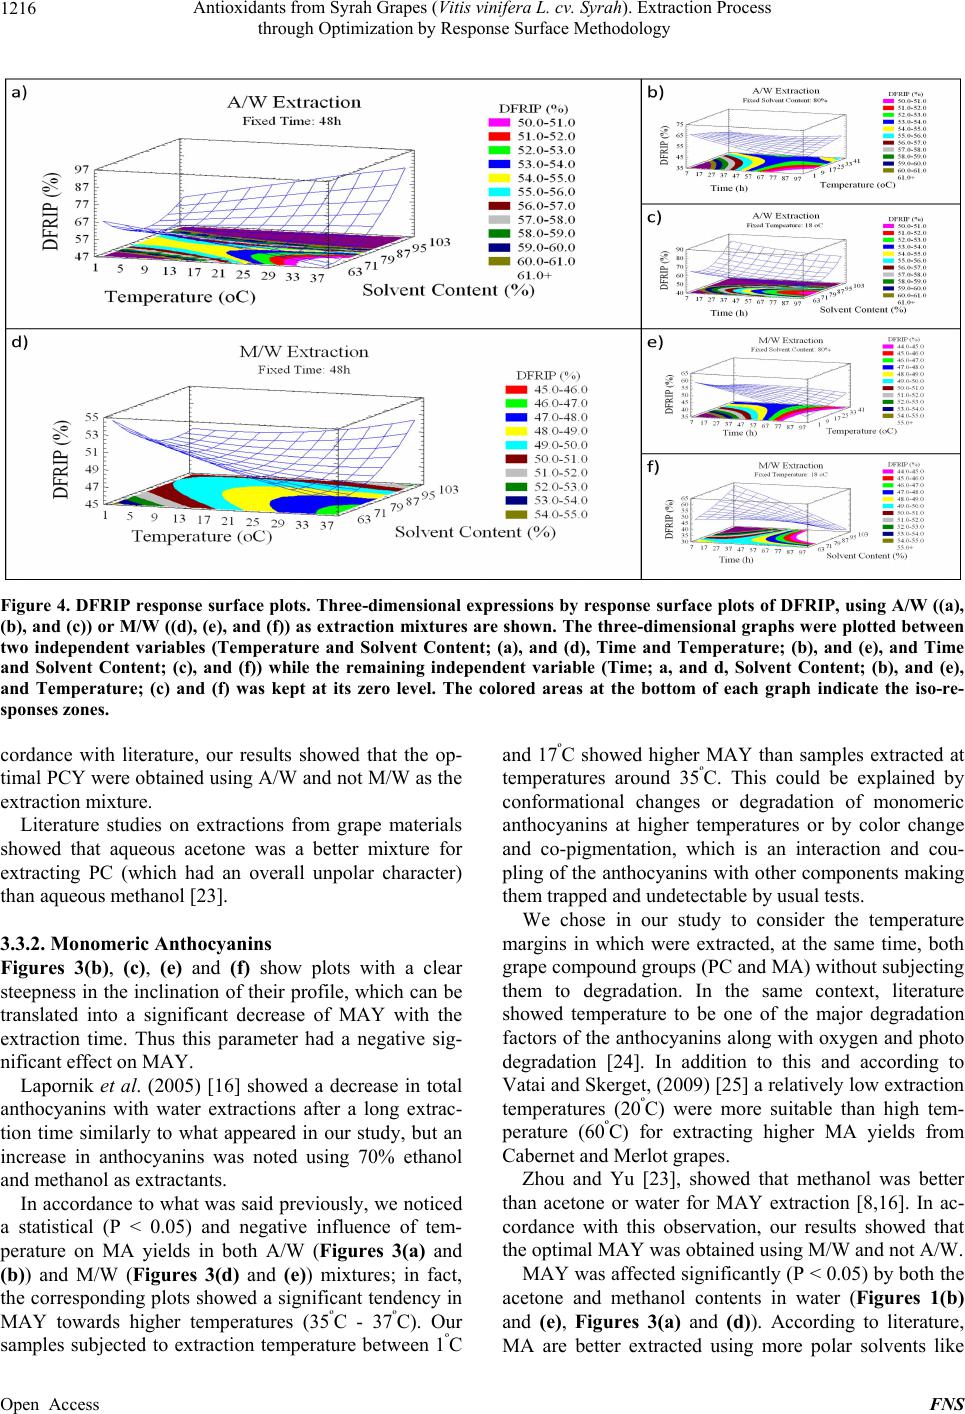 Antioxidants from Syrah Grapes (Vitis vinifera L. cv. Syrah). Extraction Process through Optimization by Response Surface Methodology Open Access FNS 1216 Figure 4. DFRIP response surface plots. Three-dimensional expressions by response surface plots of DFRIP, using A/W ((a), (b), and (c)) or M/W ((d), (e), and (f)) as extraction mixtures are shown. The three-dimensional graphs were plotted between two independent variables (Temperature and Solvent Content; (a), and (d), Time and Temperature; (b), and (e), and Time and Solvent Content; (c), and (f)) while the remaining independent variable (Time; a, and d, Solvent Content; (b), and (e), and Temperature; (c) and (f) was kept at its zero level. The colored areas at the bottom of each graph indicate the iso-re- sponses zones. cordance with literature, our results showed that the op- timal PCY were obtained using A/W and not M/W as the extraction mixture. Literature studies on extractions from grape materials showed that aqueous acetone was a better mixture for extracting PC (which had an overall unpolar character) than aqueous methanol [23]. 3.3.2. Monomeric Anthocyanins Figures 3(b), (c), (e) and (f) show plots with a clear steepness in the inclination of their profile, which can be translated into a significant decrease of MAY with the extraction time. Thus this parameter had a negative sig- nificant effect on MAY. Lapornik et al. (2005) [16] showed a decrease in total anthocyanins with water extractions after a long extrac- tion time similarly to what appeared in our study, but an increase in anthocyanins was noted using 70% ethanol and methanol as extractants. In accordance to what was said previously, we noticed a statistical (P < 0.05) and negative influence of tem- perature on MA yields in both A/W (Figures 3(a) and (b)) and M/W (Figures 3(d) and (e)) mixtures; in fact, the corresponding plots showed a significant tendency in MAY towards higher temperatures (35ºC - 37ºC). Our samples subjected to extraction temperature between 1ºC and 17ºC showed higher MAY than samples extracted at temperatures around 35ºC. This could be explained by conformational changes or degradation of monomeric anthocyanins at higher temperatures or by color change and co-pigmentation, which is an interaction and cou- pling of the anthocyanins with other components making them trapped and undetectable by usual tests. We chose in our study to consider the temperature margins in which were extracted, at the same time, both grape compound groups (PC and MA) without subjecting them to degradation. In the same context, literature showed temperature to be one of the major degradation factors of the anthocyanins along with oxygen and photo degradation [24]. In addition to this and according to Vatai and Skerget, (2009) [25] a relatively low extraction temperatures (20ºC) were more suitable than high tem- perature (60ºC) for extracting higher MA yields from Cabernet and Merlot grapes. Zhou and Yu [23], showed that methanol was better than acetone or water for MAY extraction [8,16]. In ac- cordance with this observation, our results showed that the optimal MAY was obtained using M/W and not A/W. MAY was affected significantly (P < 0.05) by both the acetone and methanol contents in water (Figures 1(b) and (e), Figures 3(a) and (d)). According to literature, MA are better extracted using more polar solvents like 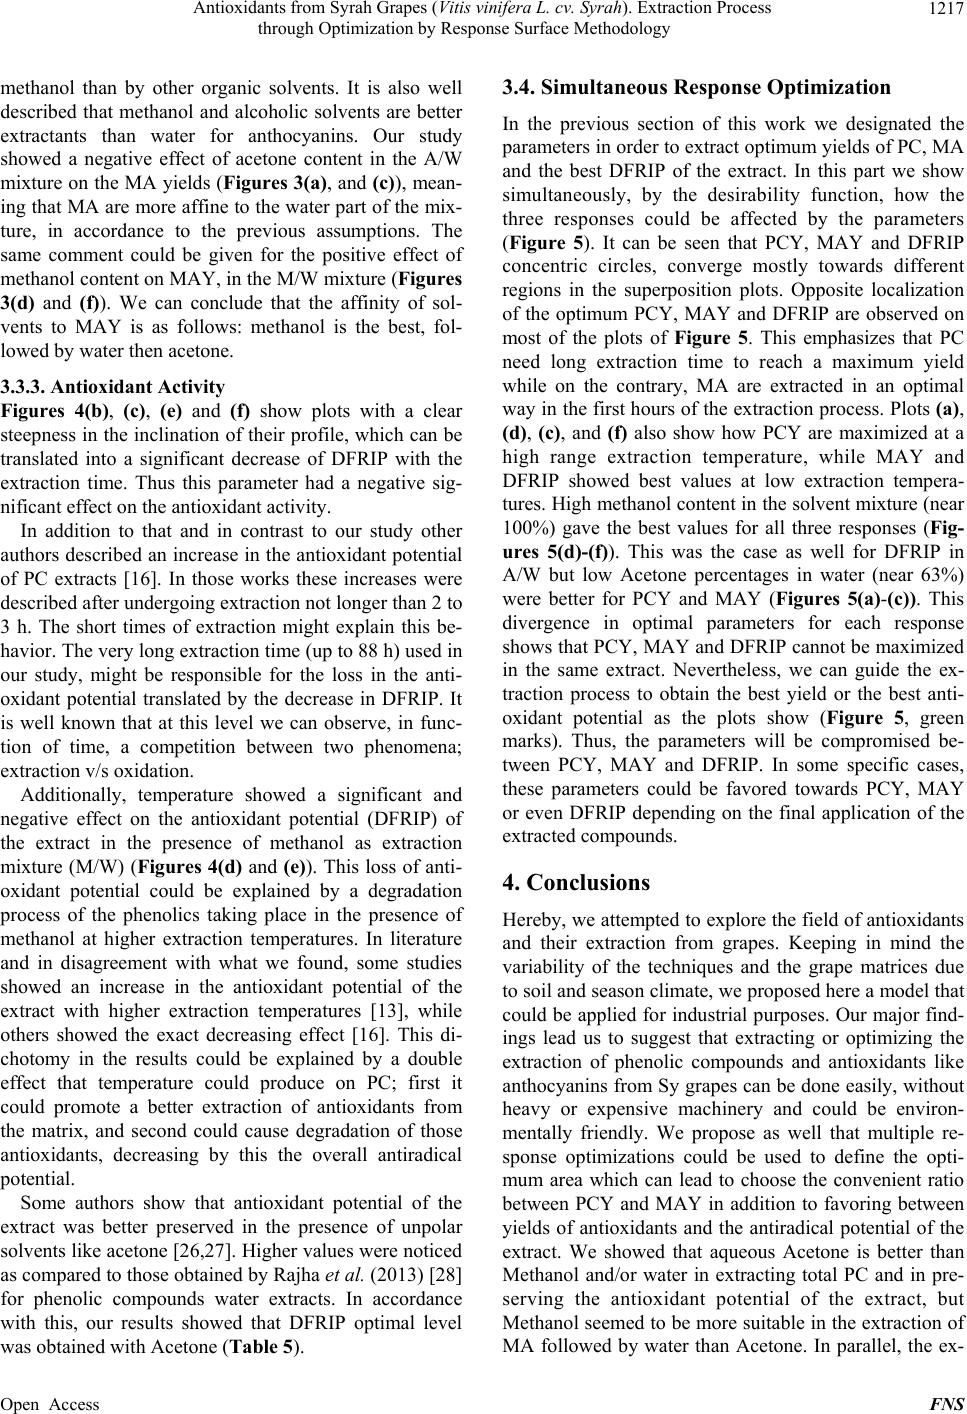 Antioxidants from Syrah Grapes (Vitis vinifera L. cv. Syrah). Extraction Process through Optimization by Response Surface Methodology 1217 methanol than by other organic solvents. It is also well described that methanol and alcoholic solvents are better extractants than water for anthocyanins. Our study showed a negative effect of acetone content in the A/W mixture on the MA yields (Figures 3(a), and (c)), mean- ing that MA are more affine to the water part of the mix- ture, in accordance to the previous assumptions. The same comment could be given for the positive effect of methanol content on MAY, in the M/W mixture (Figures 3(d) and (f)). We can conclude that the affinity of sol- vents to MAY is as follows: methanol is the best, fol- lowed by water then acetone. 3.3.3. Antioxidant Activity Figures 4(b), (c), (e) and (f) show plots with a clear steepness in the inclination of their profile, which can be translated into a significant decrease of DFRIP with the extraction time. Thus this parameter had a negative sig- nificant effect on the antioxidant activity. In addition to that and in contrast to our study other authors described an increase in the antioxidant potential of PC extracts [16]. In those works these increases were described after undergoing extraction not longer than 2 to 3 h. The short times of extraction might explain this be- havior. The very long extraction time (up to 88 h) used in our study, might be responsible for the loss in the anti- oxidant potential translated by the decrease in DFRIP. It is well known that at this level we can observe, in func- tion of time, a competition between two phenomena; extraction v/s oxidation. Additionally, temperature showed a significant and negative effect on the antioxidant potential (DFRIP) of the extract in the presence of methanol as extraction mixture (M/W) (Figures 4(d) and (e)). This loss of anti- oxidant potential could be explained by a degradation process of the phenolics taking place in the presence of methanol at higher extraction temperatures. In literature and in disagreement with what we found, some studies showed an increase in the antioxidant potential of the extract with higher extraction temperatures [13], while others showed the exact decreasing effect [16]. This di- chotomy in the results could be explained by a double effect that temperature could produce on PC; first it could promote a better extraction of antioxidants from the matrix, and second could cause degradation of those antioxidants, decreasing by this the overall antiradical potential. Some authors show that antioxidant potential of the extract was better preserved in the presence of unpolar solvents like acetone [26,27]. Higher values were noticed as compared to those obtained by Rajha et al. (2013) [28] for phenolic compounds water extracts. In accordance with this, our results showed that DFRIP optimal level was obtained with Acetone (Table 5). 3.4. Simultaneous Response Optimization In the previous section of this work we designated the parameters in order to extract optimum yields of PC, MA and the best DFRIP of the extract. In this part we show simultaneously, by the desirability function, how the three responses could be affected by the parameters (Figure 5). It can be seen that PCY, MAY and DFRIP concentric circles, converge mostly towards different regions in the superposition plots. Opposite localization of the optimum PCY, MAY and DFRIP are observed on most of the plots of Figure 5. This emphasizes that PC need long extraction time to reach a maximum yield while on the contrary, MA are extracted in an optimal way in the first hours of the extraction process. Plots (a), (d), (c), and (f) also show how PCY are maximized at a high range extraction temperature, while MAY and DFRIP showed best values at low extraction tempera- tures. High methanol content in the solvent mixture (near 100%) gave the best values for all three responses (Fig- ures 5(d)-(f)). This was the case as well for DFRIP in A/W but low Acetone percentages in water (near 63%) were better for PCY and MAY (Figures 5(a)-(c)). This divergence in optimal parameters for each response shows that PCY, MAY and DFRIP cannot be maximized in the same extract. Nevertheless, we can guide the ex- traction process to obtain the best yield or the best anti- oxidant potential as the plots show (Figure 5, green marks). Thus, the parameters will be compromised be- tween PCY, MAY and DFRIP. In some specific cases, these parameters could be favored towards PCY, MAY or even DFRIP depending on the final application of the extracted compounds. 4. Conclusions Hereby, we attempted to explore the field of antioxidants and their extraction from grapes. Keeping in mind the variability of the techniques and the grape matrices due to soil and season climate, we proposed here a model that could be applied for industrial purposes. Our major find- ings lead us to suggest that extracting or optimizing the extraction of phenolic compounds and antioxidants like anthocyanins from Sy grapes can be done easily, without heavy or expensive machinery and could be environ- mentally friendly. We propose as well that multiple re- sponse optimizations could be used to define the opti- mum area which can lead to choose the convenient ratio between PCY and MAY in addition to favoring between yields of antioxidants and the antiradical potential of the extract. We showed that aqueous Acetone is better than Methanol and/or water in extracting total PC and in pre- serving the antioxidant potential of the extract, but Methanol seemed to be more suitable in the extraction of MA followed by water than Acetone. In parallel, the ex- Open Access FNS  Antioxidants from Syrah Grapes (Vitis vinifera L. cv. Syrah). Extraction Process through Optimization by Response Surface Methodology Open Access FNS 1218 Figure 5. Desirability analysis. Superposition plots, showing the best experimental parameters (Time, Temperature, and Sol- vent Content) that maximizes PCY, MAY and DFRIP at the same time are shown. In A/W ((a), (b), and (c)) and M/W ((d), (e), and (f)) extraction mixtures, the contours graphs were plotted between two independent variables (Temperature and time; (a), and (d), Solvent Content and Time; (b), and (e), and Solvent Content and Temperature; (c), and (f)) while the remaining independent variable (Solvent Content; (a), and (d), Temperature; (b), and (e), and Time; (c), and (f)) was at its zero level. The green mark shows the “middle way” parameters that compromise between PCY and MAY. traction time effect showed to be significant on the grape phenolic yields; MA were fast to extract from Sy grapes, and 8 h as extraction time gave higher yields than longer time, while extraction yielded the maximum of PC after 88 h. Longer extraction times contributed in decreasing the antioxidant properties of the extract. We demon- strated as well that the extraction temperature had a sig- nificantly negative effect on the MA extraction and on the antioxidant potential of the extract and low extraction temperature (10ºC) yielded more MA and gave more an- tioxidant potential to the extract than high extraction temperature (35ºC). Finally, complementary studies are needed in order to solve the problem concerning preservation of the anti- oxidant capacity of a grape extracts, and to be able to fully understand the effect of parameters such as extrac- tion time, temperature and solvent content on the extrac- tion process. Future work should take into consideration larger intervals of the extraction parameters, in order to be able to enhance the quantity and the quality of the extracted compounds. All the combined data obtained through an optimal extraction strategy could lead to the production of pure natural antioxidant molecules. These could be used for the quality improvement of several industrial products such as cosmetics, pharmaceutics and agrofood. 5. Acknowledgements This project was funded by the Research Council of Saint-Joseph University-Lebanon (Project FS20). The authors are grateful to Joseph Yaghi and Nada El Darra for technical assistance. REFERENCES [1] Y. El Hajj, N. Louka, C. Nguyen and R. Maroun, “Low Cost Process for Phenolic Compounds Extraction from Cabernet Sauvignon Grapes (Vitis vinifera L. cv. Caber- net Sauvignon). Optimization by Response Surface Me- thodology,” Food and Nutrition Sciences, Vol. 3, No. 1, 2012, pp. 89-103. http://dx.doi.org/10.4236/fns.2012.31014 [2] G. Spigno and D. M. De Faveri, “Antioxidants from Grape Stalks and Marc: Influence of Extraction Procedure on Yield, Purity and Antioxidant Power of the Extracts,” Journal of Food Engineering, Vol. 78, No. 3, 2007, pp. 793-801. http://dx.doi.org/10.1016/j.jfoodeng.2005.11.020 [3] C. Flanzy, “Oenologie: Fondements Scientifiques et Tech- nologiques,” Tec & doc-Lavoisier, 1998. [4] M. F. Molina, I. Sanchez-Reus, I. Iglesias and J. Benedi, “Quercetin, a Flavonoid Antioxidant, Prevents and Pro- tects against Ethanol-Induced Oxidative Stress in Mouse Liver,” Biological & Pharmaceutical Bulletin, Vol. 26, No. 10, 2003, pp. 1398-1402. http://dx.doi.org/10.1248/bpb.26.1398 [5] C. Negro, L. Tommasi and A. Miceli, “Phenolic Com- pounds and Antioxidant Activity from Red Grape Marc Extracts,” Bioresource Technology, Vol. 87, No. 1, 2003, pp. 41-44.  Antioxidants from Syrah Grapes (Vitis vinifera L. cv. Syrah). Extraction Process through Optimization by Response Surface Methodology 1219 http://dx.doi.org/10.1016/S0960-8524(02)00202-X [6] G. Spigno, L. Tramelli and D. M. De Faveri, “Effects of Extraction Time, Temperature and Solvent on Concentra- tion and Antioxidant Activity of Grape Marc Phenolics,” Journal of Food Engineering, Vol. 8, No. 1, 2007, pp. 200-208. http://dx.doi.org/10.1016/j.jfoodeng.2006.10.021 [7] R. Liorach, F. A. Tomas-Barberan and F. Ferreres, “Let- tuce and Chicory Byproducts as a Source of Antioxidant Phenolic Extracts,” Journal of Agricultural and Food Chemistry, Vol. 52, No. 16, 2004, pp. 5109-5116. http://dx.doi.org/10.1021/jf040055a [8] E. Revilla, J. M. Ryan and G. Martin-Ortega, “Compari- son of Several Procedures Used for the Extraction of An- thocyanins from Red Grapes,” Journal of Agricultural and Food Chemistry, Vol. 46, No. 11, 1998, pp. 4592- 4597. http://dx.doi.org/10.1021/jf9804692 [9] G. K. Jayaprakasha, R. P. Singh and K. K. Sakariah, “An- tioxidant Activity of Grape Seed (Vitis vinifera) Extracts on Peroxidation Models in Vitro,” Food Chemistry, Vol. 73, No. 3, 2001, pp. 285-290. http://dx.doi.org/10.1016/S0308-8146(00)00298-3 [10] N. G. Baydar, G. Özkan and O. Sagdiç, “Total Phenolic Contents and Antibacterial Activities of Grape (Vitis vi- nifera L.) Extracts,” Food Control, Vol. 15, No. 5, 2004, pp. 335-339. http://dx.doi.org/10.1016/S0956-7135(03)00083-5 [11] Y. Yilmaz and R. T. Toledo, “Oxygen Radical Absorb- ance Capacities of Grape/Wine Industry Byproducts and Effect of Solvent Type on Extraction of Grape Seed Poly- phenols,” Journal of Food Composition and Analysis, Vol. 19, No. 1, 2006, pp. 41-48. http://dx.doi.org/10.1016/j.jfca.2004.10.009 [12] M. Pinelo, P. Del Fabbro, L. Manzocco, M. J. Nuñez and M. C. Vicoli, “Optimization of Continuous Phenol Ex- traction from Vitis vinifera Byproducts,” Food Chemistry, Vol. 92, No. 1, 2005, pp. 109-117. http://dx.doi.org/10.1016/j.foodchem.2004.07.015 [13] M. Pinelo, M. Rubilar, M. Jerez, J. Sineiro and M. J. Nu- ñez, “Effect of Solvent, Temperature, and Solvent-to- Solid Ratio on the Total Phenolic Content and Antiradical Activity of Extracts from Different Components of Grape Pomace,” Journal of Agricultural and Food Chemistry, Vol. 53, No. 6, 2005, pp. 2111-2117. http://dx.doi.org/10.1021/jf0488110 [14] F. Bonilla, M. Mayen, J. Merida and M. Medina, “Extrac- tion of Phenolic Compounds from Red Grape Marc for Use as Food Lipid Antioxidants,” Food Chemistry, Vol. 66, No. 2, 1999, pp. 209-215. http://dx.doi.org/10.1016/S0308-8146(99)00046-1 [15] B. Pekic, V. Kovac, E. Alonso and E. Revilla, “Study of the Extraction of Proanthocyanidins from Grape Seeds,” Food Chemistry, Vol. 61, No.1-2, 1998, pp. 201-206. http://dx.doi.org/10.1016/S0308-8146(97)00128-3 [16] B. Lapornik, M. Prošek and A. G. Wondra, “Comparison of Extracts Prepared from Plant By-Products Using Dif- ferent Solvents and Extraction Time,” Journal of Food Engineering, Vol. 71, No. 2, 2005, pp. 214-222. http://dx.doi.org/10.1016/j.jfoodeng.2004.10.036 [17] M. M. Giusti and R. E. Wrolstad, “Characterization and Measurement of Anthocyanins by UV-Visible Spectros- copy,” Current Protocols in Food Analytical Chemistry, John Wiley & Sons, Inc. 2001. [18] E. Alonso, M. Bourzeix and E. Revilla, “Suitability of Water/Ethanol Mixtures for the Extraction of Catechins and Proanthocyanidins from Vitis vinifera Seeds Con- tained in a Winery By-Product,” Seed Science and Tech- nology, Vol. 19, No. 3, 1991, pp. 542-552. [19] J. M. Cruz, H. Dominguez and J. C. Parajo, “Assessment of the Production of Antioxidants from Winemaking Waste Solids,” Journal of Agricultural and Food Chem- istry, Vol. 52, No. 18, 2004, pp. 5612-5620. http://dx.doi.org/10.1021/jf049376c [20] N. G. Baydar, G. Özkan and O. Sagdiç, “Total Phenolic Contents and Antibacterial Activities of Grape (Vitis vi- nifera L.) Extracts,” Food Control, Vol. 15, No. 5, 2004, pp. 335-339. http://dx.doi.org/10.1016/S0956-7135(03)00083-5 [21] S. Benvenuti, F. Pellati, M. Melegari and D. Bertelli, “Polyphenols, Anthocyanins, Ascorbic Acid, and Radical Scavenging Activity of Rubus, Ribes, and Aronia,” Jour- nal of Food Science, Vol. 69, No. 3, 2004, pp. 164-169. [22] G. Fan, Y. Han, Z. Gu and D. Chen, “Optimizing Condi- tions for Anthocyanins Extraction from Purple Sweet Po- tato Using Response Surface Methodology (RSM),” LWT- Food Science and Technology, Vol. 41, No. 1, 2008, pp. 155-160. [23] K. Zhou and L. Yu, “Effects of Extraction Solvent on Wheat Bran Antioxidant Activity Estimation,” Lebens- mittel-Wissenschaft und-Technologie, Vol. 37, No. 7, 2004, pp. 717-721. [24] R. L. Jackman, R. Y. Yada, M. A. Tung and R. A. Speers, “Anthocyaninsas Food Colorants—A Review,” Journal of Food Biochemistry, Vol. 11, No. 3, 1987, pp. 201-247. http://dx.doi.org/10.1111/j.1745-4514.1987.tb00123.x [25] T. Vatai and M. Skerget, “Extraction of Phenolic Com- pounds from Elder Berry and Different Grape Marc Va- rieties Using Organic Solvents and/or Supercritical Car- bon Dioxide,” Journal of Food Engineering, Vol. 90, No. 2, 2009, pp. 246-254. http://dx.doi.org/10.1016/j.jfoodeng.2008.06.028 [26] J. Tabart, C. Kevers, A. Cipel, J. Pincemail, J. O. DE- fraigne and J. Dommes, “Optimisation of Extraction of Phenolics and Antioxidants from Black Currant Leaves and Buds and of Stability during Storage,” Food Chemis- try, Vol. 105, No. 3, 2007, pp. 1268-1275. http://dx.doi.org/10.1016/j.foodchem.2007.03.005 [27] N. El Darra, J. Tannous, P. BouMouncef, J. Palge, J. Ya- ghi, E. Vorobiev, N. Louka and R. G. Maroun, “A Com- parative Study on Antiradical and Antimicrobial Proper- ties of Red Grapes Extracts Obtained from Different Vitis vinifera Varieties,” Food and Nutrition Sciences, Vol. 3, No. 10, 2012, pp. 1420-1432. http://dx.doi.org/10.4236/fns.2012.310186 [28] H. N. Rajha, N. El Darra, E. Vorobiev, N. Louka and R. G. Maroun, “An Environment Friendly, Low-Cost Ex- Open Access FNS  Antioxidants from Syrah Grapes (Vitis vinifera L. cv. Syrah). Extraction Process through Optimization by Response Surface Methodology Open Access FNS 1220 traction Process of Phenolic Compounds from Grape By- products. Optimization by Multi-Response Surface Me- thodology,” Food and Nutrition Sciences, Vol. 4, No. 6, 2013, pp. 650-659. http://dx.doi.org/10.4236/fns.2013.46084
|