 Vol.3, No.4, 244-251 (2013) Journal of Diabetes Mellitus http://dx.doi.org/10.4236/jdm.2013.34037 Compared with insulin glargine, insulin degludec narrows the day-to-day variability in the glucose-lowering effect rather than lowering blood glucose levels* Susumu Ogawa1,2#, Kazuhiro Nako1, Masashi Okamura1, Miho Senda1, Takuya Sakamoto1, Sadayoshi Ito1 1Division of Nephrology, Endocrinology and Vascular Medicine, Tohoku University Hospital, Sendai, Japan; #Corresponding Author: ogawa-s@hosp.tohoku.ac.jp 2Center for the Advancement of Higher Education, Tohoku University, Sendai, Japan Received 29 October 2013; revised 19 November 2013; accepted 25 November 2013 Copyright © 2013 Susumu Ogawa et al. This is an open access article distributed under the Creative Commons Attribution License, which permits unrestricted use, distribution, and reproduction in any medium, provided the original work is properly cited. ABSTRACT Background: Changes in the day-to-day vari- ability in the glucose-lowering effect of insulin [fluctuations of blood glucose levels (BG) seen during the same time period] that occur when insulin glargine (glargine) is replaced with insu- lin degludec (degludec) have not been suffi- ciently evaluated. Subjects: Five diabetics with unstable BG undergoing basal-bolus treatment using insulin glargine as basal insulin. Methods: Basal insulin was changed from glargine to same-dose degludec. The subjects’ HbA1c, gly- coalbumin, and 1.5-anhydro-D-glucitol were meas- ured before and after the switchover. Fasting blood glucose concentration (FBG) and pre- dinner blood glucose concentration (PDBG) were measured continuously for 28 days immediately before the switchover, and 28 days immediately thereafter, to compare and evaluate 1) the chan- ges in their mean values and standard devia- tions (SDs) before and after the switchover, and 2) the frequency of appearance of BG of over 180 mg/dL (BG ≥ 180) and under 70 mg/dL (BG < 70), among other items. Bolus insulin remained completely unchanged. Results: The levels of HbA1c, glycoalbumin, FBG’s mean value, SDs, BG ≥ 180 and BG < 70 all decreased. On the other hand, although PDBG’s SD as well as BG ≥ 180 and BG < 70 decreased, PDBG’s but not FBG’s mean values remained unchanged. The levels of 1.5-anhydro-D-glucitol rose. The mean values of BG ≥ 180 decreased in all subjects. Conclusion: The possibility was shown that de- gludec, to a greater extent than glargine, sup- pressed daily fluctuations of FBG and PDBG, suppressed the occurrence frequency of hyper- glycemia and hypoglycemia, and exerted more steady hypoglycemic actions. Keywords: Degludec; Glargine; Hyperglycemia; Hypoglycemia; The Day-to-Day Variability in the Glucose-Lowering Effect of Insulin 1. INTRODUCTION Rigorous glycemic control that includes the suppres- sion of glucose spikes is imperative to prevent diabetic complications [1,2]. On the other hand, to prolong the life prognosis of patients with diabetes, hypoglycemia must be avoided [3]. In other words, blood glucose levels should ideally be kept within a narrow set range that is not too high or not too low. Insulin basal-bolus treatment (intensive insulin therapy) is being used to attain these conditions. However, there are numerous diabetic pa- tients whose blood glucose levels cannot be sufficiently controlled, even by using this basal-bolus treatment. These patients include those whose blood glucose levels, measured during the same time period, fluctuate dra- matically from day to day (Ta ble 1 ). The fasting blood glucose (FBG) of these patients, for example, may be below 50 mg/dL in one day, but above 250 mg/dL on another, making it difficult to set the dose of basal insulin, which is the acting insulin (the insulin that influences blood glucose at a particular time juncture the most *Disclosure statement: no potential conflicts of interest. Copyright © 2013 SciRes. OPEN ACCESS  S. Ogawa et al. / Journal of Diabetes Mellitus 3 (2013) 244-251 245 Table 1. One subject’s 4-week record of self-monitored blood glucose (SMBG) for fasting blood glucose (FBG). Day FBG (mg/dL) Day FBG (mg/dL) 1 217 15 245 2 289 16 322 3 205 17 178 4 197 18 205 5 65 19 57 6 248 20 285 7 350 21 46 8 217 22 214 9 269 23 309 10 304 24 178 11 216 25 283 12 185 26 37 13 62 27 85 14 203 28 217 strongly). As one reason for this, physicians suggest the difference, with each injection, in the timing of the manifestation of the effects of the basal insulin that is currently being used [4]. In other words, because the way insulin works differs day by day, blood glucose levels, even when measured at the same point in the day, fluctu- ate dramatically. The recently-developed drug insulin degludec (degludec) is longer-acting than conventional basal insulin, and gives smaller peaks [5]. Moreover, its effects are reported to vary less with each injection [6]. Therefore, in patients it shows dramatic and sharp fluc- tuations in FBG and pre-dinner blood glucose (PDBG) concentration, despite already undergoing basal-bolus treatment and those whose acting insulin is believed to be basal insulin, their fluctuations in blood glucose are expected to be improved (i.e., stabilized) by replacing their basal insulin with degludec. However, this has not yet been clinically confirmed. We therefore evaluated blood glucose fluctuations in patients manifesting unsta- ble FBG and PDBG despite undergoing basal-bolus treatment using insulin glargine (glargine) as the basal insulin, in case basal insulin had been changed from glargine to same-dose degludec. 2. METHODS The subjects of this study were five patients presenting unstable FBG and PDBG despite undergoing basal-bolus treatment that used glargine as basal insulin. Table 1 shows one study-subject’s 4-week record of self-monitored blood glucose (SMBG) for FBG. Even his/her FBG, which is believed to be least influenced by meals and is stable, varied drastically depending on the day, from a minimum of 37 mg/dL to a maximum of 350 mg/dL. In this subject, 8 units of glargine were adminis- tered in the morning, and 14 units were administered before going to bed. Therefore, the insulin acting on FBG appears to be glargine taken before going to bed. We raised and lowered the dose in an attempt to make adjustments, but failed. The dose of glargine could be neither increased nor decreased, making blood glucose control extremely difficult. We recruited such patients as study subject. The definition of unstable blood glucose was deter- mined as follows: “Of the 28 measurements of FBG and PDBG, respectively, hyperglycemia of over 180 mg/dl [7] occurred more than 10 times, and hypoglycemia of under 70 mg/dl [8] occurred more than three times; the causes of these blood glucose fluctuations could not be attrib- uted to changes in meals or physical exercise.” 180 mg/dL is the blood glucose level at which urinary glu- cose begins to appear. Basal insulin is believed to be the acting insulin for FBG and PDBG; however, pre-lunch blood glucose and pre-bed blood glucose were elimi- nated from this study, since it would have been necessary to consider the influence on their levels of bolus insulin. We changed the subjects’ basal insulin (glargine) to same-dose degludec, and then asked them to carry out self-monitoring of blood glucose levels (FBG and PDBG) every day for the 28 days immediately prior to the change, and the 28 days immediately thereafter. We also evaluated their body mass index (BMI), HbA1c (NGSP), glycoalbumin (GA), and 1.5-anhydro-D-glucitol (1.5-AG) levels immediately before the change and 28 days after the change. The dose of bolus insulin remained un- changed. Japanese regulations stipulate that degludec be administered once daily, so we decided to inject degludec once a day, regardless of the frequency of glargine injec- tions. The study fully conformed to the Helsinki Declaration and it was approved by the ethics committee of the To- hoku University Hospital. This study was only performed after they had been fully explained to the subjects, and obtaining their informed consent. 3. STATISTICAL ANALYSIS Since all the measurement values evaluated in this study showed a normal distribution (based on Shapiro- Wilk test), they were shown in the form of mean ± SD. Paired student’s t-test was performed to identify any sig- nificant differences in the changes in numerical values before and after switching the treatment regimen. P < 0.05 was regarded as significant. Copyright © 2013 SciRes. OPEN ACCESS  S. Ogawa et al. / Journal of Diabetes Mellitus 3 (2013) 244-251 Copyright © 2013 SciRes. OPEN ACCESS 246 4. RESULTS We provide basic information of studied subjects as follows, e.g. type (the number of type 1 diabetes subjects = 4, the number of type 2 diabetes subject = 1), duration of diabetes (15.3 ± 7.3 years), reasons for basal-bolus treatment (because of 4 type 1 diabetes and a brittle type 2 diabetes), blood pressure (125.3 ± 10.2/74.2 ± 5.7 mmHg), blood lipids (triglyceride: 69.7 ± 30.4 mg/dL, total cholesterol: 186.5 ± 38.3 mg/dL, high density lipo- protein: 58.9 ± 5.9 mg/dL) and diabetes complications (retinopathy = 3, neuropathy = 4 and nephropathy = 2). Table 2 shows the changes in the subjects’ blood glu- cose control indicators before and after switching basal insulin. Although BMI remained unchanged with the change in treatment, HbA1c, GA, and 1.5-AG improved significantly. The rate of change was –5.1% ± 1.3% for HbA1c; –19.5% ± 4.6% for GA, and 39.2% ± 8.2% for 1.5-AG. The dose of basal insulin remained unchanged at 24.4 ± 5.3 U/day. Glargine was administered twice a day in all subjects but degludec was administered once a day in all subjects. After switching the basal insulin, the mean value of FBG decreased from 212.4 ± 24.8 to 179.8 ± 23.8 mg/dL, and SD decreased from 92.9 ± 15.2 to 60.3 ± 11.8. In comparison, while the SD of PDBG decreased from 80.7 ± 7.8 to 53.8 ± 4.9, the mean value decreased from 183.6 ± 11.0 to 182.1 ± 13.5, which was not a significant change. The maximum value of FBG decreased from 345.4 ± 33.5 mg/dL to 292.8 ± 30.1 mg/dL, while the minimum value rose from 40.8 ± 8.5 mg/dL to 67.8 ± 18.5 mg/dL. The maximum value of PDBG, moreover, decreased from 336.8 ± 27.3 mg/dL to 283.0 ± 16.6 mg/dL, and the minimum value rose from 49.8 ± 4.0 mg/dL to 61.6 ± 8.9 mg/dL. Table 3 shows FBG’s mean and SD values for each subject before and after changing the treatment regimen, and Ta ble 4 shows the PDBG’s mean and SD values for each subject before and after changing the treatment regimen. FBG’s mean value decreased in three of the five subjects, but did not show significant changes in two subjects. None of the five subjects showed any signifi- cant changes in PDBG’s mean value. However, all their SD values had decreased. Figure 1 shows the changes in mean values and SD values of FBG and PDBG (measured 28 times) in each subject. The mean value of FBG’s 28 measurements dropped significantly in 3 of the 5 subjects, but remained unchanged in 2 subjects (Table 3). It had dropped sig- nificantly in 5 subjects as a whole (Figure 1(a)). FBG’s SD decreased in all 5 subjects, and the mean value also decreased significantly (Figure 1(b)). On the other hand, the mean value of all 28 PDBG measurements remained unchanged in all five subjects (Table 4), and the mean value of the five subjects as a whole did not change (Figure 1(c)). However, SD decreased in all the subjects, and its mean value also decreased (Figure 1(d)). With Table 2. The changes in the subjects’ glycemic control indicators between before and after switching basal insulin. Basal insulin Glargine Degludec P Age (Years) 51.2 ± 16.5 (28 - 72) Gender (male/female) 2/3 Body mass index (kg/m2) 22.4 ± 1.5 22.4 ± 1.4 0.85 HbA1c (%) 8.7 ± 0.4 8.2 ± 0.4 <0.01 Glycoalbumin (%) 25.4 ± 1.2 20.4 ± 1.1 <0.01 1.5-anhydroglucitol (μg/mL) 6.7 ± 0.4 9.2 ± 0.7 <0.01 Mean of FBG (mg/dL) 212.4 ± 24.8 179.8 ± 23.8 <0.01 SD of FBG 92.9 ± 15.2 60.3 ± 11.8 <0.01 Mean of FBG max (mg/dL) 345.4 ± 33.5 292.8 ± 30.1 <0.01 Mean of FBG min (mg/dL) 40.8 ± 8.5 67.8 ± 18.5 <0.01 Mean of PDBG (mg/dL) 183.6 ± 11.0 182.1 ± 13.5 0.79 SD of PDBG 80.7 ± 7.8 53.8 ± 4.9 <0.01 Mean of PDBG max (mg/dL) 336.8 ± 27.3 283.0 ± 16.6 <0.01 Mean of PDBG min (mg/dL) 49.8 ± 4.0 61.6 ± 8.9 <0.01 Mean ± SD H bA1c: glycated hemoglobin A1c, FBG: fasting blood glucose concentration, PDBG: pre-dinner blood glucose concentration, SD: standard deviation. 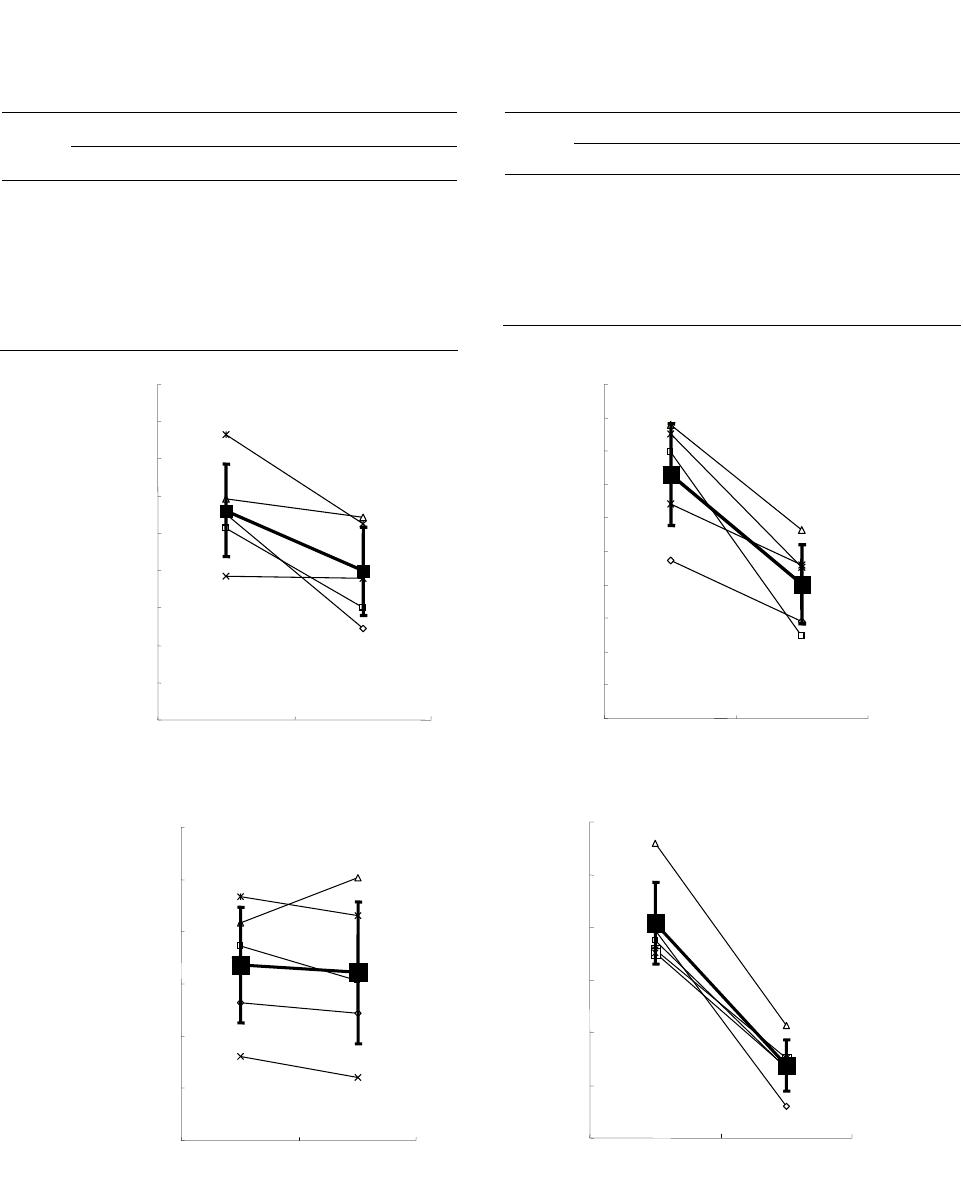 S. Ogawa et al. / Journal of Diabetes Mellitus 3 (2013) 244-251 247 Table 3. FBG’s mean and SD values for each subject before and after changing the treatment regimen. Mean SD Case Glargine Degludec P Glargine Degludec 1 210.6 149.0 0.01 67.3 49.1 2 202.8 160.3 0.02 99.8 44.6 3 218.6 208.8 0.73 107.9 76.6 4 176.9 175.9 0.85. 84.3 66.0 5 253.4 205.3 0.04 105.1 65.3 Table 4. The PDBG’s mean and SD values for each subject before and after changing the treatment regimen. Mean SD Case G D P G D 1 176.4 174.4 0.69 79.4 45.9 2 187.2 180.5 0.66 77.5 53.2 3 191.7 200.4 0.81 96.0 61.3 4 166.1 162.2 0.90 75.7 55.2 5 196.8 193.0 0.87 75.1 53.4 G: glargine, D: degludec. glargine degludec 100 120 140 160 180 200 220 240 260 280 Mean values of FBG (mg/dL) 179.8 ±23.8212.4 ±24.8 * 20 30 40 50 60 70 80 90 100 110 120 SD values of FBG (mg/dL) glargine degludec * 60.3 ±11.892.9 ±15.2 (a) (b) 150 160 170 180 190 200 210 glargine degludec 182.1 ±13.5 183.6 ±11.0 n.s. Mean values of PDBG (mg/dL) 40 50 60 70 80 90 100 glargine degludec 53.8 ±4.9 80.7 ±7.8 * SD values of PDBG (mg/dL) (c) (d) Figure 1. This figure illustrates the following when basal insulin was changed from glargine to same- dose degludec: (1) the changes in each subject’s mean values and standard deviations (SD) of fasting blood glucose (FBG) (the changes are shown as thin lines in (a) and (b)); (2) the changes in FBG’s mean values and SD’s mean values in all five subjects (the changes are shown as bold lines in (a) and (b)); (3) the changes in each subject’s mean values and SD of pre-dinner blood glucose (PDBG) (the changes are shown as thin lines in (c) and (d)); and (4) the changes in PDBG’s mean values and SD’s mean values in all five subjects (the changes are shown as bold lines in (c) and (d)). Copyright © 2013 SciRes. OPEN ACCESS 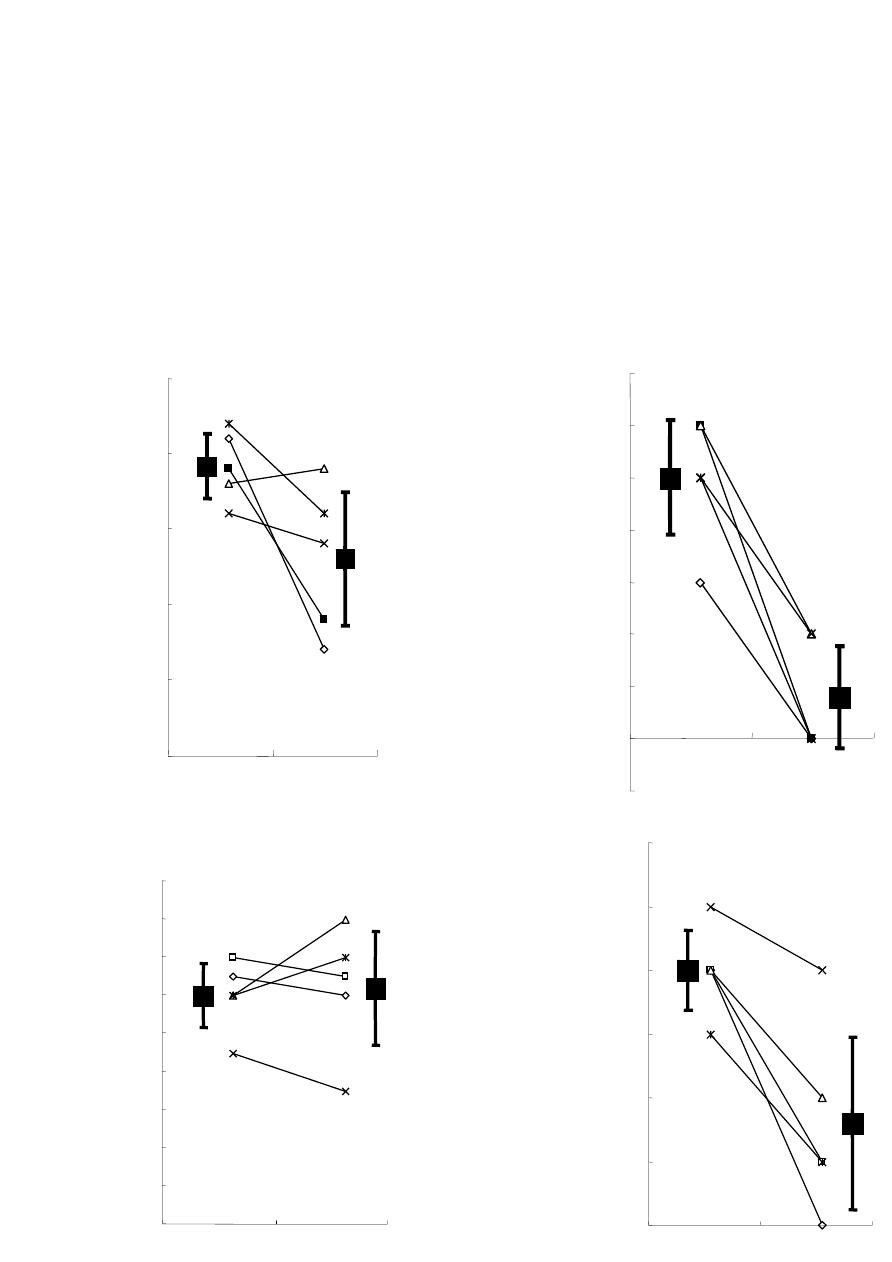 S. Ogawa et al. / Journal of Diabetes Mellitus 3 (2013) 244-251 248 FBG, the mean blood glucose value decreased, and fluc- tuations (variability in blood glucose levels) were sup- pressed; while with PDBG, although its mean blood glu- cose value did not drop, the fluctuations (variability in blood glucose levels) were suppressed. This may be at- tributable to the fact that, whereas glargine was adminis- tered twice a day in all subjects (in the morning and at night), degludec was administered once a day in the eve- ning in all subjects. Figure 2 shows the changes in frequency of blood glu- cose levels exceeding 180 mg/dL or falling below 70 mg/dL in FBG ((a), (b)) and PDBG ((c), (d)). By switch- ing from glargine to degludec, the frequency of blood glucose levels exceeding 180 mg/dL in FBG decreased from 19.2 ± 2.1 (times/28 days) to 13.0 ± 4.4 (times/28 days), while the frequency of blood glucose levels falling below 70 mg/dL decreased from 5.0 ± 1.1 (times/28 days) to 0.8 ± 1.0 (times/28 days) (Figures 2(a) and (b)). The frequency of FBG exceeding 180 mg/dL decreased in four subjects and increased in one subject because of the switchover; FBG significantly decreased in five subjects as a whole (Figure 2(a)). Moreover, the frequency of FBG falling below 70 mg/dL decreased in all five sub- jects; average FBG also decreased significantly in all Glargine Degludec 19.2 ±2.1 13.0 ±4.4 0 5 10 15 20 25 Frequency of FBG ≥180 mg/dL(times/28 days) 5.0 ±1.1 0.8 ±1.0 Glargine Degludec 0 1 2 3 4 5 6 7 Frequency of FBG < 70 mg/dL(times/28 days) (a) (b) 12.0 ±1.712.4 ±3.0 glargine degludec 0 2 4 6 8 10 12 14 16 18 Frequency of PDBG ≥180 mg/dL(times/28 days) 4.0 ±0.6 1.6 ±1.4 glargine degludec 0 1 2 3 4 5 6 Frequency of PDBG < 70 mg/dL(times/28 days) (c) (d) Figure 2. This figure focuses on each of the 28 measurements of fasting blood glucose (FBG) and pre-dinner blood glucose (PDBG), and shows how the frequency of numerical values exceeding 180 mg/dL ((a), (c)), and the frequency of the numerical values falling below 70 mg/dL ((b), (d)) changed if glargine was switched to degludec. Copyright © 2013 SciRes. OPEN ACCESS 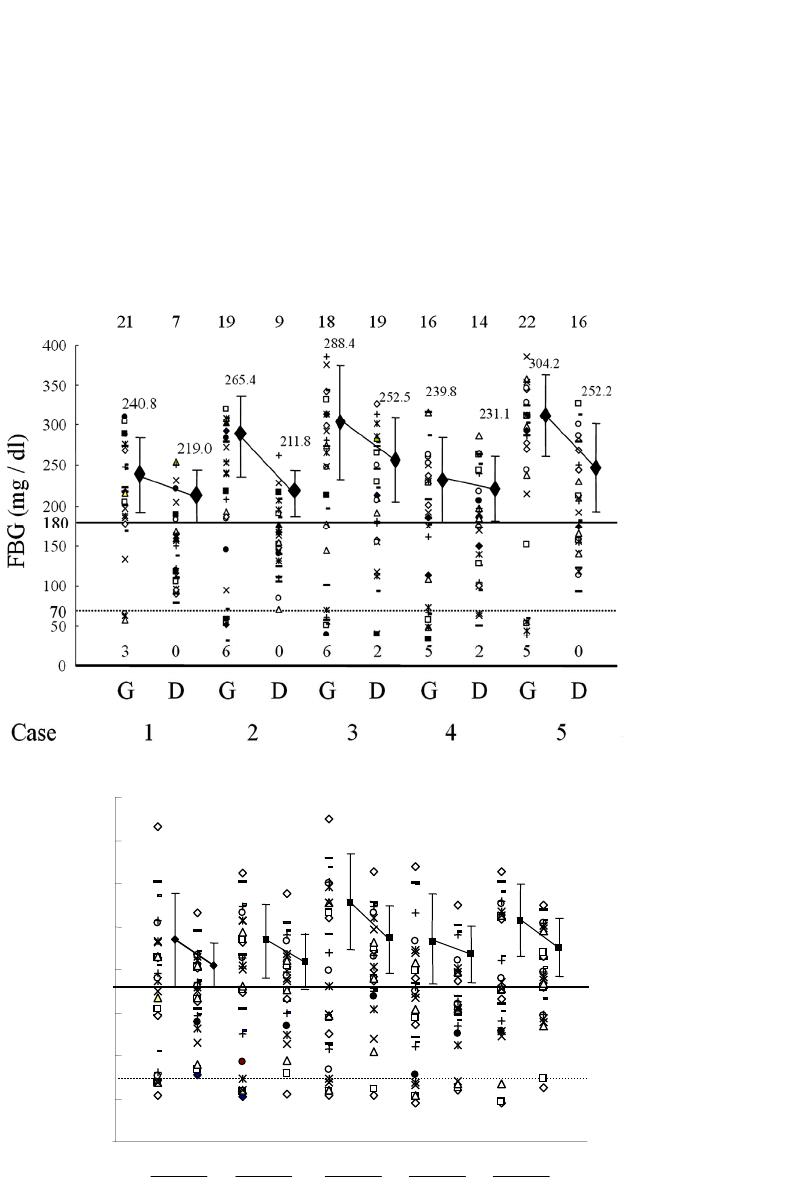 S. Ogawa et al. / Journal of Diabetes Mellitus 3 (2013) 244-251 249 five subjects as a whole (Figure 2(b)). On the other hand, the frequency of PDBG exceeding 180 mg/dL decreased in three subjects and increased in two subjects as a result of the switchover. However, no changes in PDBG were seen in five subjects as a whole (Figure 2(c)). In addi- tion, the frequency of PDBG falling below 70 mg/dL decreased in all five subjects, and PDBG also decreased significantly in these individuals (Figur e 2(d)). Figure 3 plots all the FBG (Figure 3(a)) values and PDBG (Figure 3(b)) values before and after switchover of insulin in each subject. The topmost line shows the frequency of blood glucose levels exceeding 180 mg/dL, and the bottommost line shows the frequency of the blood glucose level falling below 70 mg/dL. The changes in each subject’s mean values of FBG and PDBG ex- ceeding 180 mg/dL are also shown. The frequency of blood glucose levels exceeding 180 mg/dL in PDBG remained unchanged from 12.7 ± 1.7 (times/28days) to 12.4 ± 3.0 (times/28days), but the frequency of blood glucose levels falling below 70 mg/dL decreased from (a) 12345Case 15 G 4 0 50 100 150 200 250 300 350 400 G 17 4 0 D 14 G 15 4 1 D 16 70 180 G 12 52 D 19 D 17 1 G 15 3 D 10 4 237.2 210.8 240.6 217.3 271.6 232.9 234.8 219.6 255.1 226.7 PDBG (mg / dl) (b) Figure 3. This figure plots all the fasting blood glucose (FBG) (a) values and pre-dinner blood glucose (PDBG) (b) values before and after switchover of insulin in each subject. The topmost line shows the frequency of blood glucose levels exceeding 180 mg/dL, and the bottommost line shows the frequency of the blood glucose level falling below 70 mg/dL. The changes in each subject’s mean values of DBG and PDBG exceeding 180 mg/dL are also shown. Copyright © 2013 SciRes. OPEN ACCESS  S. Ogawa et al. / Journal of Diabetes Mellitus 3 (2013) 244-251 250 4.0 ± 0.6 (times/28days) to 1.6 ± 1.4 (times/28days). The mean value of blood glucose levels exceeding 180 mg/dL had decreased in both FBG and PDBG. An examination of the plotting of all the measurement values of FBG and PDBG in these subjects revealed that the fluctuations in blood glucose levels had decreased in all the subjects, and that the blood glucose levels had converged. Degludec and glargine treatments were well tolerated; no serious adverse events were reported in either treat- ment. No injection-site reactions or severe hypoglycemic events were reported. In total, 21 confirmed hypoglyce- mic episodes (self-declaration and/or BG < 70 mg/dL) in 5 subjects were observed with degludec compared with 65 episodes with glargine in 5 subjects. Fewer confirmed hypoglycemic episodes were reported for degludec than glargine. 5. DISCUSSION Changing glargine to degludec reduced the mean FBG value but not mean PDBG values. More important, however, is that both the SD values and the fluctuations in blood glucose became smaller (Figure 4). This is be- cause, if blood glucose levels are stabilized, adjustment of the insulin dose is made easier. (If the blood glucose level is always high, you need only to increase the dose of acting insulin; conversely, if it is always low, you need only to decrease its dose.) By switching from glargine to degludec, the mean value of FBG decreased, but that of PDBG remained unchanged. This may have been be- cause, whereas glargine was administered twice a day— in the morning and evening—in all the subjects (with the exception of one), degludec was administered once a day in the evening. Glargine has a shorter duration of action than degludec; however, if administered in the morning as well, its effectiveness in reducing pre-dinner blood glucose appears to be not inferior to that of degludec. Since fluctuations were seen in the effects, however, hy- perglycemic (≥180 mg/dL) days and hypoglycemic (<70 mg/dL) days were believed to have occurred frequently, increasing the SD. Due to this switchover from glargine to degludec, the SD values of both FBG and PDBG de- creased, so degludec appears to have exerted more steady hypoglycemic actions (the day-to-day variability in the glucose-lowering effect is narrow) on a fasting and prior to dinner. In other words, the appearance of insulin ac- tion from about 8 hours after injection to about 15 hours was believed to change less for each injection of de- gludec than with glargine [4,6]. Because of the switchover to degludec, all the indica- tors of blood glucose control, namely HbA1c, GA, and 1.5-AG, improved. The rate of improvement was the greatest in 1.5-AG, followed by GA and HbA1c, in that order. The major reason for this may have been that the evaluation period was short, at only 28 days. The sup- Mean Blood glucose Effect of insul in a t the sa m e ti me 2SD1 2SD1 2SD2 2SD2 70 mg / dL180 mg / dL Insulin glargine Insulin degludec Figure 4. This figure schematically shows the changes in blood glucose distribution that occurred as a result of switching from insulin glargine to insulin degludec. Even though the mean blood glucose value did not change very sharply, the SD nar- rowed (from SD1 to SD2), so the frequency of hyperglycemia exceeding 180 mg/dL and hypoglycemia falling below 70 mg/dL appears to have decreased. Especially problematic is the reduction in the number of events of severe hypoglycemia of below 50 mg/dL and severe hyperglycemia of over 200 mg/dL (inside the circle in the diagram). This is because the blood glucose levels at both of these extremes are the most strongly related to the onset of such events in the patients. In other words, this shows that manifestation of insulin effects at the same time period is markedly more constant in degludec than in glargine. pression of a rise in blood glucose levels during brief periods that are unlikely to be reflected in HbA1c (but which are reflected in GA values), as well as a reduction in the frequency and numerical value of blood glucose levels exceeding the level at which urinary glucose gen- erally begins appearing (≥180 mg/dL) (reflected in 1.5- AG values), were largely reflected in GA and 1.5-AG values, to a greater extent than HbA1c values. In other words, minor fluctuations in blood glucose appear to have decreased. This also shows that degludec demon- strated more steady hypoglycemic actions (the day-to- day variability in the glucose-lowering effect is narrow) than glargine. One option for patients with wide blood glucose fluc- tuations that make setting the dose of long-acting insulin difficult may be to switch long-acting insulin to degludec with the aim of stabilizing their blood glucose level. 6. CONCLUSION AND LIMITATION The biggest problem with this study is the very small sample size and a single arm non-controlled study. Thus, it will be necessary to carry out further studies on a lar- ger scale randomized control trial or cross-over study. The number of the study participants was too small to draw any firm conclusion. Because this was a single arm Copyright © 2013 SciRes. OPEN ACCESS  S. Ogawa et al. / Journal of Diabetes Mellitus 3 (2013) 244-251 251 non-controlled study, the improved glycemic fluctuation could be explained by “regression to the mean” phe- nomenon. The sample size was too small to do the analy- sis and to compare the efficacy and safety of insulin de- gludec and insulin glargine in diabetic patients. However, this report is a previous work to lead a further research in the future. We hope our report becomes provisions of a further research in the future. 7. ACKNOWLEDGEMENTS The authors acknowledge the editorial assistance and clinical support of Miss Manami Simizu for her help with preparing the references and for their expert assistance with the management of clinical data. We would like to express our sincere gratitude to all the study subjects who measured with many SMBG for this study. REFERENCES [1] Holman, R.R., Paul, S.K., Bethel, M.A., Matthews, D.R. and Neil, H.A. (2008) 10-year follow-up of intensive glucose control in type 2 diabetes. New England Journal of Medicine, 359, 1577-1589. http://dx.doi.org/10.1056/NEJMoa0806470 [2] Nathan, D.M., Cleary, P.A., Backlund, J.Y., Genuth, S.M., Lachin, J.M., Orchard, T.J., Raskin, P., Zinman, B., Dia- betes Control and Complications Trial/Epidemiology of Diabetes Interventions and Complications (DCCT/EDIC) Study Research Group (2005) Intensive diabetes treat- ment and cardiovascular disease in patients with type 1 diabetes. New England Journal of Medicine, 353, 2643- 2653. http://dx.doi.org/10.1056/NEJMoa052187 [3] NICE-SUGAR Study Investigators, Finfer, S., Liu, B., Chittock, D.R., Norton, R., Myburgh, J.A., McArthur, C., Mitchell, I., Foster, D., Dhingra, V., Henderson, W.R., Ronco, J.J., Bellomo, R., Cook, D., McDonald, E., Dodek, P., Hébert, P.C., Heyland, D.K. and Robinson, B.G. (2012) Hypoglycemia and risk of death in critically ill patients. New England Journal of Medicine, 367, 1108-1118. http://dx.doi.org/10.1056/NEJMoa1204942 [4] Heise, T., Nosek, L., Rønn, B.B., Endahl, L., Heinemann, L., Kapitza, C. and Draeger, E. (2004) Lower within-sub- ject variability of insulin detemir in comparison to NPH insulin and insulin glargine in people with type 1 diabetes. Diabetes, 53, 1614-1620. http://dx.doi.org/10.2337/diabetes.53.6.1614 [5] Heise, T., Nosek, L., Bøttcher, S.G., Hastrup, H. and Haahr, H. (2012) Ultra-long-acting insulin degludec has a flat and stable glucose-lowering effect in type 2 diabetes. Diabetes, Obesity and Metabolism, 14, 944-950. http://dx.doi.or g/10.1111/j.1463-1326.2012.01638.x [6] Heise, T., Hermanski, L., Nosek, L., Feldman, A., Ras- mussen, S. and Haahr, H. (2012) Insulin degludec: Four times lower pharmacodynamic variability than insulin glargine under steady-state conditions in type 1 diabetes. Diabetes, Obesity and Metabolism, 14, 859-864. http://dx.doi.or g/10.1111/j.1463-1326.2012.01627.x [7] Moghissi, E.S., Korytkowski, M.T., DiNardo, M., Ein- horn, D., Hellman, R., Hirsch, I.B., Inzucchi, S.E., Is- mail-Beigi, F., Kirkman, M.S. and Umpierrez, G.E. Ame- rican Association of Clinical Endocrinologists; American Diabetes Association (2009) American Association of Clinical Endocrinologists and American Diabetes Asso- ciation consensus statement on inpatient glycemic control. Diabetes Care , 32, 1119-1131. http://dx.doi.org/10.2337/dc09-9029 [8] Seaquist, E.R., Anderson, J., Childs, B., Cryer, P., Da- gogo-Jack, S., Fish, L., Heller, S.R., Rodriguez, H., Ro- senzweig, J. and Vigersky, R. (2013) Hypoglycemia and diabetes: A report of a workgroup of the American Dia- betes Association and the Endocrine Society. Diabetes Care, 36, 1384-1395. http://dx.doi.org/10.2337/dc12-2480 Copyright © 2013 SciRes. OPEN ACCESS
|