 J. Biomedical Science and Engineering, 2011, 4, 83-89 doi:10.4236/jbise.2011.42011 Published Online February 2011 (http://www.SciRP.org/journal/jbise/ JBiSE ). Published Online February 2011 in SciRes. http://www.scirp.org/journal/JBiSE Simultaneous measurements of aeroacoustic sounds and wall vibration for exploring the contribution of tooth vibration in the production of sibilant sounds/s/ Masanori Nakamura1, Kazunori Nozaki1, Haruka Takimoto2, K azuya Nagamune2, Motoharu Fujigaki3, Shigeo Wada2 1The Center for Advanced Medical Engineering and Informatics, Osaka University, Toyonaka, Japan; 2Department of Mechanical Science and Bioengineering, Osaka University, Toyonaka, Japan; 3Department of Opto-Mechatronics, Faculty of Systems Engineering, Wakayama University, Wakayama, Japan. Email: masanori@me.es.osaka-u.ac.jp Received 3 December 2010; revised 23 December 2010; accepted 28 December 2010 ABSTRACT In order to understand the contribution of teeth vibration to the production of sibilant/s/, the pre- sent study was designed to develop a method of si- multaneously measuring aeroacoustic sounds and the vibration of an obstacle. To measure the vibra- tion without disturbing flow, the Michelson inter- ferometer was employed. The flow channel, which had an obstacle wall inside of it, was fabricated such that it morphologically mimicked the simpli- fied geometry of the oral cavity. Given airflows at a flow rate of 7.5 × 10⁻⁴ m 3/s from the inlet, aero- acoustic sounds were generated. A spectrum analy- sis of the data demonstrated two prominent peaks in the sound at 1,300 and 3,500 Hz and one peak in the wall vibration at 3,500 Hz. The correlation in peak frequencies between the sound and wall vi- bration suggests that the sound at 3,500 Hz was induced by the wall vibration. In fact, the sound amplitude at 3,500 Hz decreased when the obstacle wall was thickened, which increased its rigidity (p < 0.05, t-test). The experimental results demonstrate that the developed techniques are capable of meas- uring aeroacoustic sound and obstacle wall vibra- tion simultaneously, and suggest the potential to pave the way for detailed analysis of the production of sibilant sounds /s/. Keywords: Acoustic Measurement; Vibration Measurement; Michelson Interferometer; Aeroacoustics; Sibilant/s/ 1. INTRODUCTION Oral therapies for speech disorders are directly linked to quality of life (QOL). In oral therapies, the modification of oral morphological features including changes in the spa- tial position of the jaw is performed surgically for the pur- pose of maxillofacial orthodontic therapies [1], prosthetic treatments [2], and the insertion of sports mouth-guards [3]. Alterations in oral morphologies, however, often bring about vocal disorders, in particular, dental fricative sounds that are produced within the oral cavity. Among the dental fricative voices, sibilant /s/ has gained relatively much attention from dentists and scien- tists because sibilant sounds /s/ are frequently used in daily conversations and most languages [4-6]. The sound source of sibilant /s/ is generally accepted to be the ante- rior teeth [7,8]. From a fluid mechanical point of view, when the sibilant /s/ is produced, a jet that develops through the constriction made by the tongue and maxilla is speculated to impinge on the anterior teeth, yielding flow turbulence and causing chaotic formation of vor- tices of many different length scales. The interaction of the vortices leads to rapid variation in pressure on the surface of anterior teeth, thereby inducing pressure fluc- tuations that cause sibilant /s/. Sibilant /s/ has been explored experimentally, theo- retically, and numerically. For example, Stevens [9,10] applied aerodynamic flow theory to study acoustic mechanisms of fricative sounds. The study was later followed by the work of Shadle [7,11,12], who modeled the oral cavity as a circular duct with constriction and an obstacle. Shadle’s model is quite simple, but the ob- tained results were important in the research of sibilant /s/. The study measured velocities and sound pressures that radiated from the model by parametrically varying geometrical features. The authors concluded that acous- tically, the significant parameters are the length of the front cavity, the presence of an obstacle, and flow 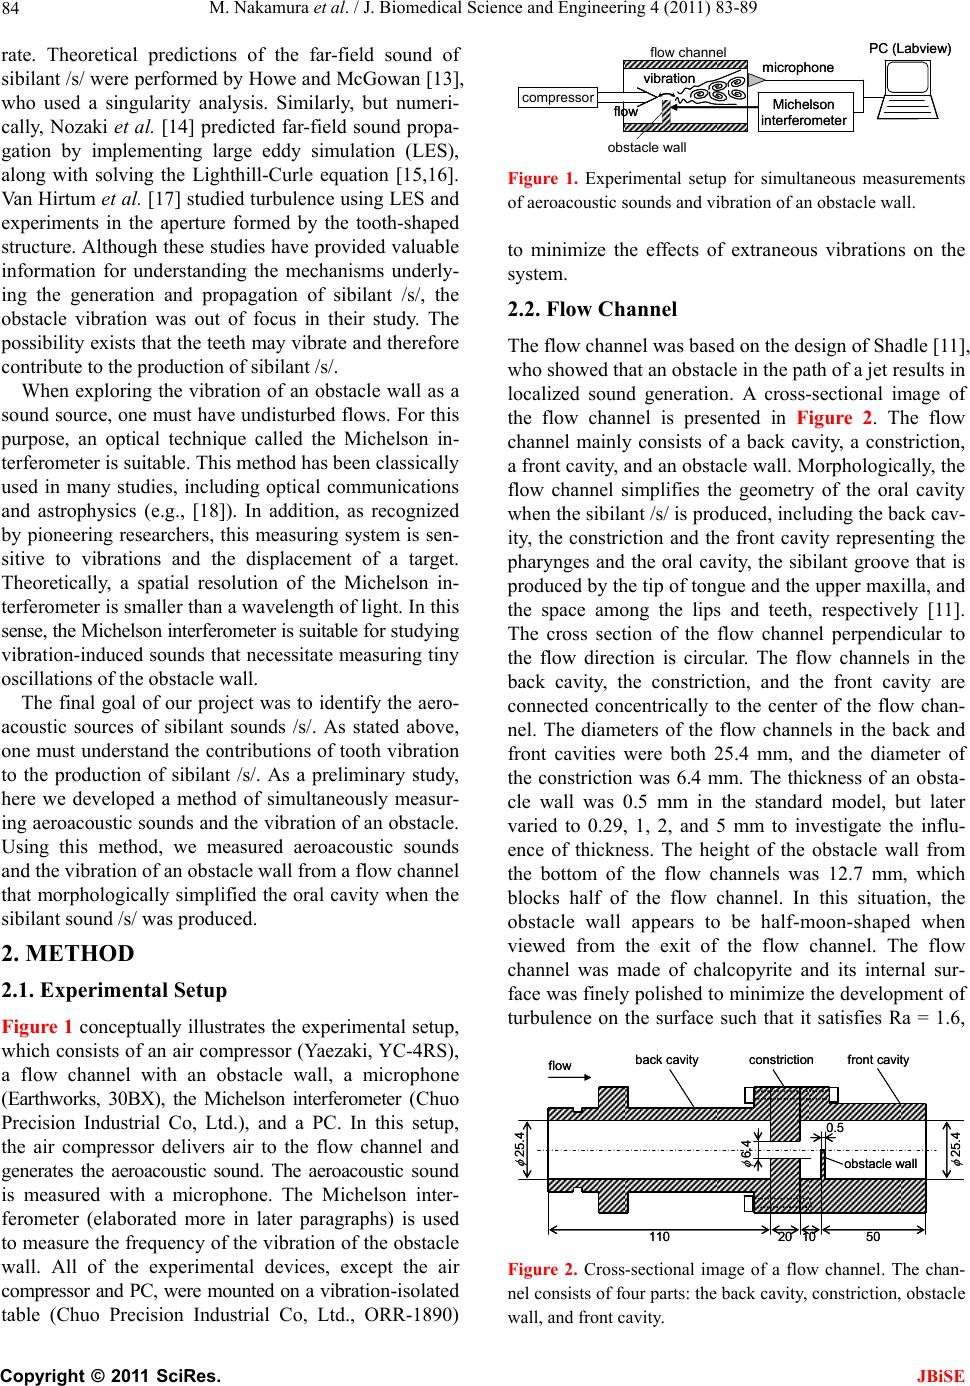 M. Nakamura et al. / J. Biomedical Science and Engineering 4 (2011) 83-89 84 rate. Theoretical predictions of the far-field sound of sibilant /s/ were performed by Howe and McGowan [13], who used a singularity analysis. Similarly, but numeri- cally, Nozaki et al. [14] predicted far-field sound propa- gation by implementing large eddy simulation (LES), along with solving the Lighthill-Curle equation [15,16]. Van Hirtum et al. [17] studied turbulence using LES and experiments in the aperture formed by the tooth-shaped structure. Although these studies have provided valuable information for understanding the mechanisms underly- ing the generation and propagation of sibilant /s/, the obstacle vibration was out of focus in their study. The possibility exists that the teeth may vibrate and therefore contribute to the production of sibilant /s/. When exploring the vibration of an obstacle wall as a sound source, one must have undisturbed flows. For this purpose, an optical technique called the Michelson in- terferometer is suitable. This method has been classically used in many studies, including optical communications and astrophysics (e.g., [18]). In addition, as recognized by pioneering researchers, this measuring system is sen- sitive to vibrations and the displacement of a target. Theoretically, a spatial resolution of the Michelson in- terferometer is smaller than a wavelength of light. In this sense, the Michelson interferometer is suitable for studying vibration-induced sounds that necessitate measuring tiny oscillations of the obstacle wall. The final goal of our project was to identify the aero- acoustic sources of sibilant sounds /s/. As stated above, one must understand the contributions of tooth vibration to the production of sibilant /s/. As a preliminary study, here we developed a method of simultaneously measur- ing aeroacoustic sounds and the vibration of an obstacle. Using this method, we measured aeroacoustic sounds and the vibration of an obstacle wall from a flow channel that morphologically simplified the oral cavity when the sibilant sound /s/ was produced. 2. METHOD 2.1. Experimental Setup Figure 1 conceptually illustrates the experimental setup, which consists of an air compressor (Yaezaki, YC-4RS), a flow channel with an obstacle wall, a microphone (Earthworks, 30BX), the Michelson interferometer (Chuo Precision Industrial Co, Ltd.), and a PC. In this setup, the air compressor delivers air to the flow channel and generates the aeroacoustic sound. The aeroacoustic sound is measured with a microphone. The Michelson inter- ferometer (elaborated more in later paragraphs) is used to measure the frequency of the vibration of the obstacle wall. All of the experimental devices, except the air compressor and PC, were mounted on a vibration-isolated table (Chuo Precision Industrial Co, Ltd., ORR-1890) flow channel compressor micro phone Michelson interferometer flow obstacle wall vibration PC (Labvie ) flow channel compressor micro phone Michelson interferometer flow obstacle wall vibration PC (Labvie ) Figure 1. Experimental setup for simultaneous measurements of aeroacoustic sounds and vibration of an obstacle wall. to minimize the effects of extraneous vibrations on the system. 2.2. Flow Channel The flow channel was based on the design of Shadle [11], who showed that an obstacle in the path of a jet results in localized sound generation. A cross-sectional image of the flow channel is presented in Figure 2. The flow channel mainly consists of a back cavity, a constriction, a front cavity, and an obstacle wall. Morphologically, the flow channel simplifies the geometry of the oral cavity when the sibilant /s/ is produced, including the back cav- ity, the constriction and the front cavity representing the pharynges and the oral cavity, the sibilant groove that is produced by the tip of tongue and the upper maxilla, and the space among the lips and teeth, respectively [11]. The cross section of the flow channel perpendicular to the flow direction is circular. The flow channels in the back cavity, the constriction, and the front cavity are connected concentrically to the center of the flow chan- nel. The diameters of the flow channels in the back and front cavities were both 25.4 mm, and the diameter of the constriction was 6.4 mm. The thickness of an obsta- cle wall was 0.5 mm in the standard model, but later varied to 0.29, 1, 2, and 5 mm to investigate the influ- ence of thickness. The height of the obstacle wall from the bottom of the flow channels was 12.7 mm, which blocks half of the flow channel. In this situation, the obstacle wall appears to be half-moon-shaped when viewed from the exit of the flow channel. The flow channel was made of chalcopyrite and its internal sur- face was finely polished to minimize the development of turbulence on the surface such that it satisfies Ra = 1.6, back cavityfront cavity obstac le wall 25.4 25.4 6.4 11020 5010 constriction 0.5 flow back cavityfront cavity obstac le wall 25.4 25.4 6.4 11020 5010 constriction 0.5 flow Figure 2. Cross-sectional image of a flow channel. The chan- nel consists of four parts: the back cavity, constriction, obstacle wall, and front cavity. C opyright © 2011 SciRes. JBiSE  M. Nakamura et al. / J. Biomedical Science and Engineering 4 (2011) 83-89 85 Rz = 6.3, and RJIS = 6.3 of the Japanese Industrial Stan- dards. Note that this is a scale model, about 3 times as large as an anatomical scale of the oral cavity [19]. 2.3. Wall Vibration Measurem ent Wall vibration frequency was measured using the Michelson interferometer and photomultiplier. Figure 3 shows a schematic drawing of the experimental appara- tus for measuring wall vibrations. The experimental ap- paratus consisted of a He-Ne laser beam oscillator (LO) (Chuo Precision Industrial Co, Ltd., GL5230, true wavelength 632.8 nm, maximum optical output power 20 mW), a beam expander unit (BE) (Chuo Precision Industrial Co, Ltd., C-80, ×20), a slit unit (SU) (Chuo Precision Industrial Co, Ltd., C-25, 2-30 mm), a beam splitter unit (BS) (Chuo Precision Industrial Co, Ltd., IU-BS1, 20 mm), a mirror unit (MU) (Chuo Precision Industrial Co, Ltd., IU-M1, 20 mm), and a photomulti- plier (PM) (Hamamatsu Photonics, light sensor module H9656, effective wavelength 632.8 nm). Additionally, a circular mirror with a diameter of 6.3 mm (Edmund Op- tics, 4-6 ) was glued to the upper edge of the obstacle wall for reflecting the laser beam. The experimental parts were precisely positioned as follows: The distance was 330 mm between the OW and BS, 330 mm between the MU and BS, 200 mm between the PM and BS, 220 mm between the BS and SU, 60 mm between the SU and BE, and 10 mm between the SE and LO. The Michelson interferometer produces interference fringes by recom- bining two beams of light generated from the same beam source. In brief, the beam of light was generated by the He-Ne laser beam oscillator. It was then expanded and made to be parallel by the downstream beam expander and split in two by the semitransparent mirror. From this point, two paths of light went to the detector. One re- flected off the semitransparent mirror, struck the bottom mirror, and then bounced back, passing through the LOBESU BS PM MU flow channel OW flow LOBESU BS PM MU flow channel OW flow photomultiplierPM mirror unitMU slit uni tSU beam expanderBE laser beam oscillatorLO obstacle wallOW photomultiplierPM mirror unitMU slit uni tSU beam expanderBE laser beam oscillatorLO obstacle wallOW Figure 3. Schematic illustration of the Michelson interferome- ter used to measure the wall vibration. semitransparent mirror to the photomultiplier. The other first passed through the semitransparent mirror to the mirror on the obstacle wall. The reflected light from the mirror on the obstacle wall continued to the semitrans- parent mirror and then reflected back into the photomul- tiplier. Recombination of the two reflected light beams that followed different paths produced an interference fringe. Since spacing of the interference fringes was as- sociated with a difference in the path lengths of two light beams, vibrations in obstacle wall gave rise to alternat- ing patterns of interference fringes. A temporal change in light intensity of interference fringes was detected and amplified by the photomultiplier. A frequency analysis of these data provided the vibration frequency of the obsta- cle wall. 2.4. Experimental Conditions During the experiments, air was delivered at a steady flow rate of 7.5 × 10⁻⁴ m 3/s (45 L/min) to the flow channel by the compressor. The Reynolds number cal- culated from the constriction diameter and material properties of the air at 15˚C (density of 1.225 kg/m3 and viscosity of 1.78 × 10⁻⁵ kg/(m·s)) was 10,269. Generated aeroacoustic sounds were measured by a microphone that was situated 200 mm distal to the center of the flow channel. The vibration frequency of the obstacle wall was measured with the Michelson interferometer as de- scribed above. Measurements of sound and vibration were synchronized by Labview ver 8.0 (National In- struments). The sampling frequency was 40,000 Hz. Three experiments were performed under the same flow conditions as described above. In the first experi- ment, we examined the effects of the presence of an ob- stacle wall and front cavity on sounds. For this experi- ment, we prepared three models as summarized in Table 1. In the second experiment, we performed simultaneous measurements of sound pressure and vibration of the obstacle wall to identify vibration-induced sound. In the third experiment, the thickness of the obstacle wall was varied to be 0.29, 0.5, 1, 2, and 5 mm to examine the effects of wall rigidity on the sounds. 2.5. Data Analysis A Fourier transformation with a Hanning window was used to attain a frequency spectrum. For smoothening, the amplitude data were averaged in each frequency bin, Table 1. Models used for the first experiment. back cavityconstriction front cavity obstacle wall model 1+ + + + model 2+ + + - model 3+ + - - +: Present, –: Absent. C opyright © 2011 SciRes. JBiSE  M. Nakamura et al. / J. Biomedical Science and Engineering 4 (2011) 83-89 86 the center of which was 100 + 200N Hz (N = 0, 1, 2 …); the bandwidth was 200 Hz. For example, a result at the frequency of 500 Hz represents an average of the data from 400 to 600 Hz. All results in this paper are pre- sented in this fashion. Measurements were repeated 5 times in each condi- tion. Although Figure 4 and Figure 5 presented below represent the data of one measurement (not average), reproducibility of the measurements was good enough to give the quantitatively same results. 3. RESULTS 3.1. First Experiment Aeroacoustic sounds were measured for three models that differ in assembly as summarized in Table 1. In brief, model 1 was a completely assembled flow channel that had all components, namely, the back cavity, the constriction, the front cavity, and the obstacle wall. The obstacle wall was not present in model 2, but the rest was the same as model 1. Model 3 lacked both the front cavity and the obstacle wall, and therefore consisted of Frequency [Hz] Sound Amplitude [V] model 1 model 2 model 3 020004000 60008000 ×10-5 5 10 0 Frequency [Hz] Sound Amplitude [V] model 1 model 2 model 3 020004000 60008000 ×10-5 5 10 0 Figure 4. Frequency spectrum of the sound amplitude for model 1 (○), model 2 (∆), and model 3 (□). The models differ in their assembly as summarized in Table 1. 0 5 10 200040006000 80000 0 1 2 3 4 5 ×10⁻³ Vibration Amplitude [V] ×10-5 Frequency [Hz] Sound Amplitude [V] sound vibration 0 5 10 200040006000 80000 0 1 2 3 4 5 ×10⁻³ Vibration Amplitude [V] ×10-5 Frequency [Hz] Sound Amplitude [V] sound vibration Figure 5. Frequency spectrum of the sound amplitude (○) and vibration of the obstacle wall (∆). The thickness of obstacle wall was 0.5 mm and the flow rate was 45 L/min. the back cavity and the constriction. Figure 4 illustrates the frequency spectrum of the sound pressure amplitudes obtained from the models. The symbols represent model 1 (○), model 2 (∆), and model 3 (□). As shown, model 1, which has all parts including the front cavity, constric- tion, back cavity, and obstacle wall, exhibited several peaks over the entire frequency range. In particular, prominent peaks were found at the frequencies of 1,300 Hz and 3,500 Hz. In contrast, model 2, which does not have the obstacle wall, showed a peak at the frequency of 1,300 Hz, but no peak at 3,500 Hz. No peaks were found at these frequencies in model 3, which only had the front cavity and constriction. A comparison of these results clearly indicates that the sound at 1,300 Hz is associated with the presence of a front cavity while that at 3,500 Hz is associated with the presence of an obsta- cle wall. 3.2. Second Experiment Sound and wall vibrations were simultaneously meas- ured for the model that had all elements. Here, the thickness of the obstacle wall was 0.5 mm and the flow rate at the inlet was 7.5 × 10⁻⁴ m 3/s. Figure 5 plots the frequency spectrum of the sound pressure amplitudes and vibration of the obstacle wall. In this graph, circles and triangles represent sound pressure and vibration of the obstacle wall, respectively. Prominent peaks in sound are observed at the frequencies of 1,300 Hz and 3,500 Hz, as described in Section 3.1. In contrast, vibration of the obstacle wall showed a sharp peak at the frequency of 3,500 Hz. These results confirmed that sounds at the frequency of 3,500 Hz are generated by the vibration of the obstacle wall. 3.3. Third Exper iment The thickness of the obstacle wall was varied at 0.29, 0.5, 1, 2, and 5 mm in the model used in Section 3.2. Figure 6 depicts changes in the sound pressure amplitude at the frequencies of (a) 1,300 Hz and (b) 3,500 Hz against the thickness of the obstacle wall. Here, the sound amplitude was normalized with the mean amplitude obtained at the thickness of 0.29 mm. The mean and standard deviations are a result of five repeated experiments. We found that the sound at 1,300 Hz remained almost the same regard- less of the thickness of the obstacle wall. Furthermore, the slope of the linear regression analysis was not statis- tically different from zero in 1,300 Hz. In contrast, the sound at 3,500 Hz decreased with an increase in wall thickness. In this case, the slope obtained using a linear regression analysis showed a significant difference from zero (p < 0.05), indicating a significant decrease in the amplitude with an increase in the wall thickness. Fur- thermore, a statistical analysis (t-test) demonstrated a C opyright © 2011 SciRes. JBiSE 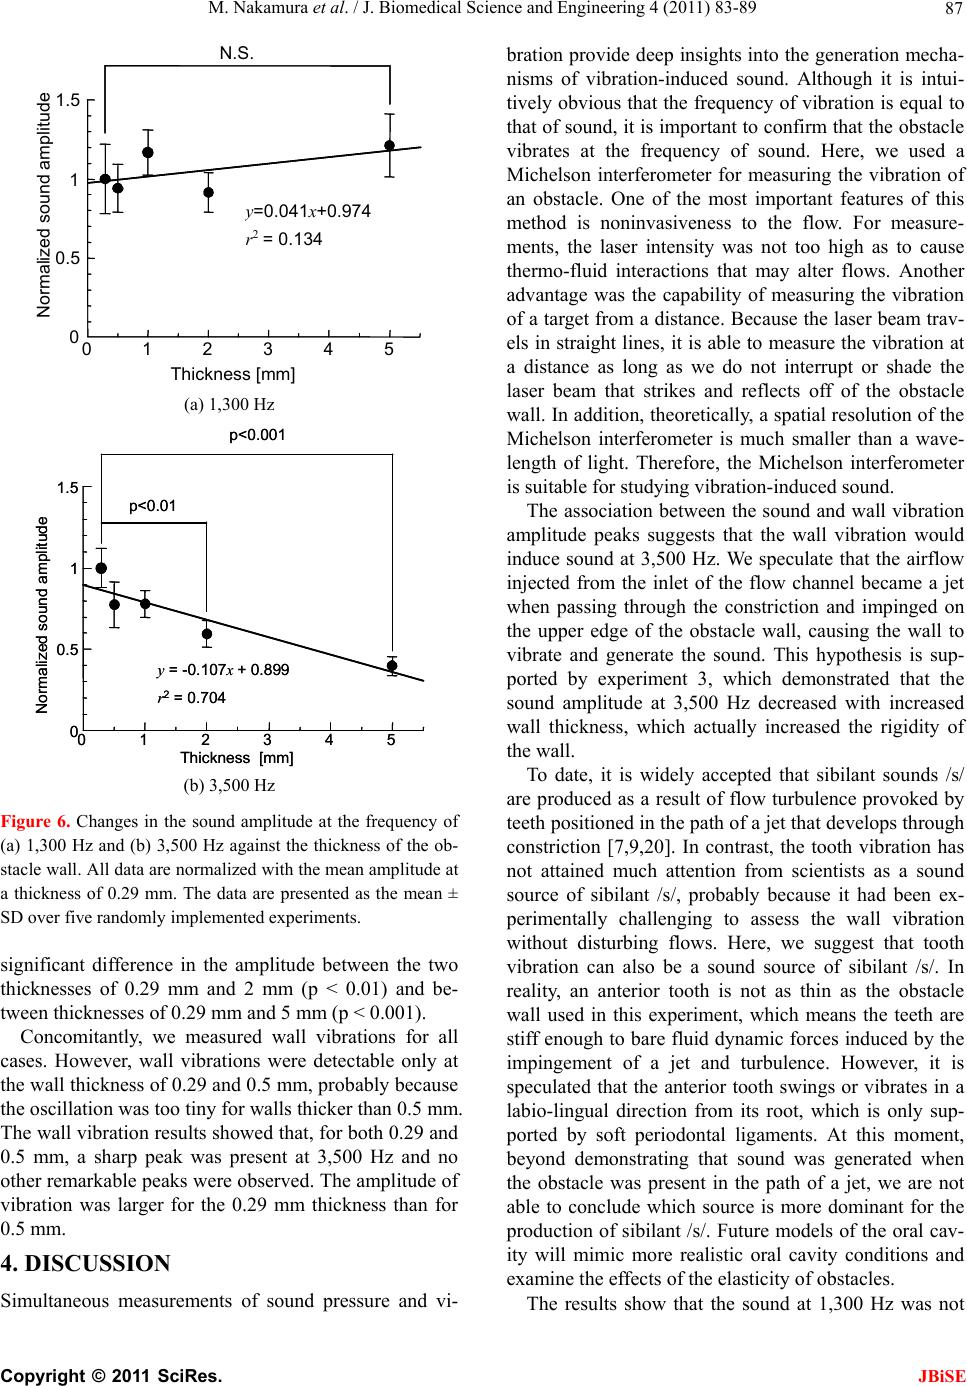 M. Nakamura et al. / J. Biomedical Science and Engineering 4 (2011) 83-89 87 012 3 4 5 0 0.5 1 1.5 N.S. Thickness [mm] Normalized sound amplitude =0.041 +0.974 r 2 = 0.134 (a) 1,300 Hz 012345 0 0.5 1 1.5 Thickness [mm] Normalized sound amplitude y= -0.107x + 0.899 r2= 0.704 p<0.001 p<0.01 012345 0 0.5 1 1.5 Thickness [mm] Normalized sound amplitude y= -0.107x + 0.899 r2= 0.704 p<0.001 p<0.01 (b) 3,500 Hz Figure 6. Changes in the sound amplitude at the frequency of (a) 1,300 Hz and (b) 3,500 Hz against the thickness of the ob- stacle wall. All data are normalized with the mean amplitude at a thickness of 0.29 mm. The data are presented as the mean ± SD over five randomly implemented experiments. significant difference in the amplitude between the two thicknesses of 0.29 mm and 2 mm (p < 0.01) and be- tween thicknesses of 0.29 mm and 5 mm (p < 0.001). Concomitantly, we measured wall vibrations for all cases. However, wall vibrations were detectable only at the wall thickness of 0.29 and 0.5 mm, probably because the oscillation was too tiny for walls thicker than 0.5 mm. The wall vibration results showed that, for both 0.29 and 0.5 mm, a sharp peak was present at 3,500 Hz and no other remarkable peaks were observed. The amplitude of vibration was larger for the 0.29 mm thickness than for 0.5 mm. 4. DISCUSSION Simultaneous measurements of sound pressure and vi- bration provide deep insights into the generation mecha- nisms of vibration-induced sound. Although it is intui- tively obvious that the frequency of vibration is equal to that of sound, it is important to confirm that the obstacle vibrates at the frequency of sound. Here, we used a Michelson interferometer for measuring the vibration of an obstacle. One of the most important features of this method is noninvasiveness to the flow. For measure- ments, the laser intensity was not too high as to cause thermo-fluid interactions that may alter flows. Another advantage was the capability of measuring the vibration of a target from a distance. Because the laser beam trav- els in straight lines, it is able to measure the vibration at a distance as long as we do not interrupt or shade the laser beam that strikes and reflects off of the obstacle wall. In addition, theoretically, a spatial resolution of the Michelson interferometer is much smaller than a wave- length of light. Therefore, the Michelson interferometer is suitable for studying vibration-induced sound. The association between the sound and wall vibration amplitude peaks suggests that the wall vibration would induce sound at 3,500 Hz. We speculate that the airflow injected from the inlet of the flow channel became a jet when passing through the constriction and impinged on the upper edge of the obstacle wall, causing the wall to vibrate and generate the sound. This hypothesis is sup- ported by experiment 3, which demonstrated that the sound amplitude at 3,500 Hz decreased with increased wall thickness, which actually increased the rigidity of the wall. To date, it is widely accepted that sibilant sounds /s/ are produced as a result of flow turbulence provoked by teeth positioned in the path of a jet that develops through constriction [7,9,20]. In contrast, the tooth vibration has not attained much attention from scientists as a sound source of sibilant /s/, probably because it had been ex- perimentally challenging to assess the wall vibration without disturbing flows. Here, we suggest that tooth vibration can also be a sound source of sibilant /s/. In reality, an anterior tooth is not as thin as the obstacle wall used in this experiment, which means the teeth are stiff enough to bare fluid dynamic forces induced by the impingement of a jet and turbulence. However, it is speculated that the anterior tooth swings or vibrates in a labio-lingual direction from its root, which is only sup- ported by soft periodontal ligaments. At this moment, beyond demonstrating that sound was generated when the obstacle was present in the path of a jet, we are not able to conclude which source is more dominant for the production of sibilant /s/. Future models of the oral cav- ity will mimic more realistic oral cavity conditions and examine the effects of the elasticity of obstacles. The results show that the sound at 1,300 Hz was not C opyright © 2011 SciRes. JBiSE  M. Nakamura et al. / J. Biomedical Science and Engineering 4 (2011) 83-89 88 the vibration-induced sound. In fact, this sound was gen- erated when the front cavity was present. Since the front cavity of the flow channel has a rigid surface at the inlet (constriction) and is open at the outlet, it can be regarded as a cylinder with one closed end and one open end. In such a cylinder, the acoustic resonance frequency f is calculated by 4 nv fLl where n is an odd number, L is the length of the front cavity, v is the speed of sound, and l is the length of the end correction. The end correction is practically given by lr where r is the radius of the flow channel (= 12.7 mm) and is a correction coefficient. According to Levine and Schwinger [21], the correction coefficient varies from around 0.15 to 0.6133 depending on the ratio of the wavelength to the radius of the flow channel. Given the length of the front cavity (= 60 mm), the length of the end correction l is 1.905-7.789 mm. Consequently, as- suming that the speed of sound v is 343 m/s, we predict that acoustic resonance occurs at the frequency of 1,264- 1,385 Hz or its integral multiple in this flow channel. This acoustic resonance frequency falls in the frequency band of 1,200-1,400 Hz represented by its central fre- quency of 1,300 Hz. Therefore, we speculate that the sound at 1,300 Hz was a result of the acoustic resonance in the front cavity. The present experiment has some limitations. First, the thickness of the mirror (0.5 mm) attached to the ob- stacle wall to ensure the reflection of the light beam for vibration measurements is comparable to that of obstacle wall. This may have resulted in losing intrinsic nature of the wall vibration. To overcome this problem, we may need to use a negligibly thin mirror or polish the surface of the obstacle wall like a mirror. Second, the present setup of the Michelson interferometer is not capable of measuring the displacement amplitude in length metrics like a “micrometer” and analyzing spatial variations over the wall vibration. This information would be essential to gain a deeper insight into the generation mechanisms of vibration-induced sound. Third, due to this averaging procedure, we might have lost information regarding the frequency shift of sound pressure and vibration of the obstacle wall with changing wall thicknesses. Although we have examined various bandwidths of the frequency to the averaged data to determine if such a shift in the frequency with changes in the wall thickness occurred, it was not observed. Future studies will employ more so- phisticated means to minimize measurement errors such that we can explore the relationship between wall vibra- tion and sound pressure in detail. Notwithstanding these limitations, the results in this paper suggest the potential of the presented methodology to pave the way for de- tailed analysis of vibration-induced sound. 5. SUMMARY AND CONCLUSION In the present study, we performed simultaneous meas- urements of aeroacoustic sounds and obstacle wall vi- bration utilizing an optical technique called the Michel- son interferometer. The flow channel, which simplified the geometry of the mouth cavity, generated aeroacoustic sounds, given airflows from the inlet. The results dem- onstrate two prominent peaks in sound at 1,300 and 3,500 Hz, and one peak in the wall vibration at 3,500 Hz. The association between peak frequencies of sound and wall vibration suggested that the sound at 3,500 Hz is induced by wall vibration. In fact, the amplitude of sound at 3,500 Hz decreased with thickening of the ob- stacle wall, which also increased its rigidity. The ex- periments demonstrate that the developed techniques are capable of measuring aeroacoustic sound and obstacle wall vibration simultaneously. Future studies will adopt a more complex geometry of the oral cavity and explore the effects of obstacle wall rigidity on generated sounds, while ameliorating fixation of the obstacle to the model and measurements of wall vibration with the Michelson interferometer. These results will provide us with addi- tional insights into the production of vibration-induced sounds and sibilant sounds /s/. 6. ACKNOWLEDGEMENTS This work was supported in part by the Global COE Program “In Silico Medicine-oriented Worldwide Open Platform” at Osaka Univer- sity. REFERENCES [1] Lee, S.Y.A., Whitebill, L.T., Ciocca, V. and Samman, N. (2002) Acoustic and perceptual analysis of the sibilant sound /s/ before and after orthognathic surgery. Journal of Oral and Maxillofacial Surgery, 60, 364-373. [2] Hamlet, S. Geoffrey, V.D. and Bartlett, D.M. (1976) Effect of a dental prosthesis on speaker-specific charac- teristics of voice. Journal of Speech and Hearing Res e a r c h, 19, 639-650. [3] Banky, J. (2000) Mouthguards dental injury and pro- blems: On-field management. Journal of Science and Medicine in Sport, 3, 5-11. doi:10.1016/S1440-2440(00)80063-8 [4] Fletcher, S.G. and Newman, D.G. (1991) [s] and [sh] as a function of linguapalatal contact place and sibilant. Journal of the Acoustical Society of America, 89, 850- 858. doi:10.1121/1.1894646 [5] Čelebić, A. and Knezović-Zlatarić, D. (2003) A comparison of patient’s satisfaction between complete and partial removable denture wearers. Journal of Dentistry, 31, C opyright © 2011 SciRes. JBiSE  M. Nakamura et al. / J. Biomedical Science and Engineering 4 (2011) 83-89 Copyright © 2011 SciRes. 89 JBiSE 445-451. doi:10.1016/S0300-5712(03)00094-0 [6] Hassan, T., Naini, F.B. and Gill, D. S. (2007) The effects of orthognathic surgery on speech: A review. Journal of Oral and Maxillofacial Surgery, 65, 2536-2543. doi:10.1016/j.joms.2007.05.018 [7] Shadle, C.H. (1990) Articulatory-acoustic relationships in fricative consonants. In: Hardcastle W.J. and Marchal A. Eds., Speech Production and Speech Modeling, Kluwer Academic Publishers, The Netherlands, 187-209. [8] Ray, D.K. and Charles R.D., (2002) The Acoustic Analysis of Speech, 2nd Edition, Singular/Thomson Learning, Canada, 38-43. [9] Stevens, K.N. (1971) Airflow and turbulence noise for fricative and stop consonants: Static considerations. Journal of the Acoustical Society of America, 50, 1180-1192. doi:10.1121/1.1912751 [10] Stevens, K.N. (1988) Acoustic Phonetics, MIT Press, Cambridge, MA, 379-412. [11] Shadle, C.H. (1985) The acoustics of fricative consonants, MIT Technical Report, Cambridge, MA. [12] Shadle, C.H. (1991) The effect of geometry on source mechanisms of fricative consonants. Journal of Phonetics, 19, 409-424. [13] Howe, M. and McGowan, R. (2005) Aeroacoustics of [s], Proceedings of Royal Society, London Series A, 461, 1005-1028. doi:10.1098/rspa.2004.1405 [14] Nozaki K., Tamagawa, H. and Shimojo, S. (2008) Prediction of dental fricative sound by Lighthill-Curle equation. In: Takada, K. Ed., In Silico Denti stry, Medigit, Japan, 155-158. [15] Lighthill, M.J. (1952) On sound generation aerody- namically I. General theory. Proceedings of Royal Society, London Series A, 211, 564-587. doi:10.1098/rspa.1952.0060 [16] Curle, N. (1955) The influence of solid boundaries upon aerodynamic sound. Proceedings of Royal Society, London Series A, 231, 505-514. doi:10.1098/rspa.1955.0191 [17] Van Hirtum, A., Grandchamp, X., Pelorson, X., Nozaki, K. and Shimojo, S. (2010) LES simulation and ‘in-vitro’ experimental validation of flow around a teeth-shaped obstacle. International Journal of Applied Mechanics, 2, 265-279. doi:10.1142/S1758825110000603 [18] Ju, L., Blair, D.G. and Zhau C. (2000) Detection of gravitational waves. Reports on Progress in Physics, 63, 1317-1427. doi:10.1088/0034-4885/63/9/201 [19] Narayanan, S., Alwan, A. and Haker K. (1995) An articulartory study of fricative consonants using magnetic resonance imaging. Journal of the Acoustical Society of America, 98, 1325-1347. doi:10.1121/1.413469 [20] Fant, G. (1960) Acoustic theory of speech production, The Hague, The Netherlands, Mouton. [21] Levine, H. and Schwinger, J. (1948) On the radiation of sound from an unflanged circular pipe. Physical Review, 73, 383-406. doi:10.1103/PhysRev.73.383
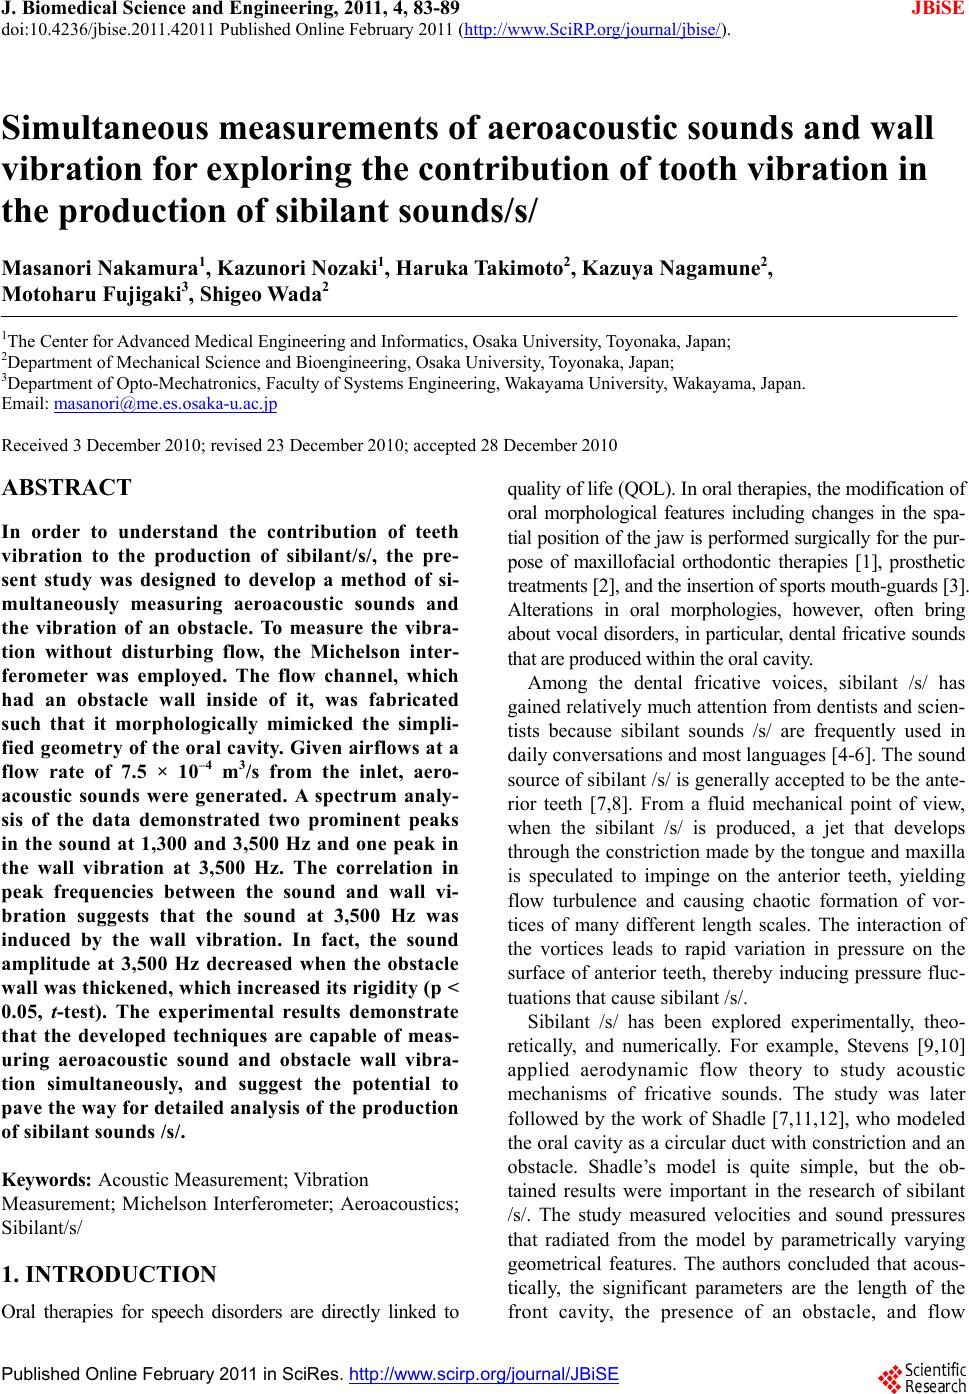
|