Paper Menu >>
Journal Menu >>
 J. Serv. Sci. & Management. 2008, 1: 77-82 Published Online June 2008 in SciRes (www.SRPublishing.org/journal/jssm) Copyright © 2008 SciRes JSSM Empirical Research on Repo Rates Based on Exponen- tial Smooth Transition Autoregressive Model Qi-Zhi He School of Statistics, Anhui University of Finance and Economics, Bengbu 233030, P.R.china ABSTRACT In the process of China's marketization of interest rates, researching the characteristics of interest rates has very im- portant theoretical and practical significance. Based on Chinese interbank repo interest rates, the characteristics of daily interest rates and monthly interest rates and their spreads have been researched, and unit root tests are paid to the level, the first difference and the spread of daily interest rates and monthly interest rates based on the traditional method and the exponential smooth transition autoregressive method (ESTAR) respectively. The results show: Firstly, as for different term of repo interest rates, the characteristics are different. Secondly, both lists of daily rates and monthly rates are integrated of order 1. Thirdly, the spread of daily interest rates and monthly interest rates is not sta- tionary by use of ADF, but stationary by use of ESTAR. Finally, the long-run equilibrium relationship between daily repo interest rates and monthly repo interest rates is stab le with nonlinear adjustment. Keywords: Repo interest rates, Unit root, Nonlin ear, Augmented Dickey-Fuller (ADF), Exponential smooth tra nsition autore gre ss i v e (ESTAR) 1. Introduction Term structure of interest rates provides a characterization of interest rates as a function of maturity. It is the bench- mark of assets pricing, financial product design, risk management and investment such as discussed in [1,2,3].Because of its numerous uses, estimation of the term structure has received considerable attention from researchers and practitioners, such as Xie Chi and Wu Xiong-wei (2002), Xie Chi (2004,2005,2006) [7], Zheng Zhen-long and Lin Hai (2003,2004,2005,2006,2007), ZHOU Rong-xie and QIU Wan-hua(2004), WANG Xiao-Fang(2006), Fan Long-zhen(2006), He Qi-zhi (2007)[4,5], etc..But most of the researches are only about how to estimate the term structure of interest, and few involved in the relationship between the different maturi- ties of interest rates. The expectation theory regarding the term structure of interest rates is one of the bases of finance and mac- roeconomy. According to the expectation theory, the yield spread between different-term interest rates is stationary, or different-term interest rates have the cointegration rela- tionship with cointegrating vector (-1,1). Thus it is helpful to judge the existence of the expectation theory by checking the cointegration relationship between differ- ent-term interest rates. Many documents have studied the expectation theory by use of the traditional unit root tests (DF and ADF)and cointegration tests (EG and AEG), such as Campbell,J.Y. (1987, 1995) ,SHI Min,WANG Shou-yang(2005)[6], and Wu Dan, Xie Chi(2005)[7],etc.. These traditional tests assume only linear adjustment. There are, however, economic situations where a non-linear adjustment process may exist [8]. For example, policy intervention may take place only when the economy deviates from equilibrium by a certain margin. The nature of the policy action may also differ, depending on the di- rection of that deviation. Another example is that arbitra- geurs enter the market only if the price deviation of an asset from its no-arbitrage equilibrium is sufficiently large to compensate for transaction costs. As to the empirical research of the expectation hypothesis of the term structure, for the sake of simplicity, many researches have neglected the inherent nonlinear adjustment of the term structure of interest rate. In fact, sometimes only series of moderate length are available and the number of observations is small. The small number of observations and the market friction including transaction costs in financial assets markets is likely to lead to nonlinear speeds of conver- gence to equilibrium of rates of return, and often lead to the nonlinear adjustment of term structure of interest rates. Recently, some authors have emphasized such nonlinear features and adjustment of economic variables [9]. Typical nonlinear time series models which appear useful in prac- tice concern various forms of regime-switches. Since the seminal articles of Ter asvirtaa && and Anderson (1992)[11] and Ter asvirtaa && (1994) [11], smooth transition autore- gressive (STAR) models have become one of most popular classes of non-linear models in modern applied economics [10]. The STAR models have been employed in modeling the dynamics of various types of economic time series, for  78 Qi-Zhi He Copyright © 2008 SciRes JSSM example industrial production in Ter asvirtaa && and Anderson(1992) [11],unemployment in Skalin and Ter asvirtaa && (2002) [11], interest rates in van Dijk and Franses (2000) [9], exchange rates in Taylor, Peel, and Sarno (2001), real interest and exchange rates in George Kapetanios, etc.(2003)[11], inter alia. Most recently, Maki, Daiki (2005, 2006) [12, 13] investigated the term structure of interest rates in Japan using the nonlinear unit root test: ESTAR. His results provide strong evidence against the unit root of the yield spread between long-term and short-term interest rates, compared with standard unit root tests assuming only linear adjustment. The purpose of this paper is to investigate the term structure of interest rates in china using the unit root test in the exponential nonlinear smooth transition autoregressive (ESTAR) framework, as proposed by Kapetanios (2003) [11]. Their ESTAR approach tests for a unit root against a nonlinear stationary process based on the STAR process. In that paper they analyzed the implications of the exis- tence of a particular kind of nonlinear dynamics for unit root testing procedures, and provided an alternative framework for a test of the null of a unit root process against an alternative of a nonlinear exponential smooth transition autoregressive (ESTAR) process. The plan of the paper is as follows: section 2 addresses the expectation theory and the traditional unit root test (DF, and ADF). Section 3 introduces the nonlinear unit root test proposed by Kapetanios (2003) [11] and applied by Maki, Daiki (2005, 2006) [12] [13] in Japan. Section 4 presents empirical applications in china. Section 5 provides a summary of the paper, and contains some concluding re- marks. 2. The Expectation Theory Regarding Term Structure and the Unit Root Test 2.1. The expectation theory regarding term struc- ture The expectation hypothesis expressed by SHI Min,WANG Shou-yang (2005) [6] is as follows: 1 ()( )() 0 1k nmn tttim i rEr k θ − + = =+ ∑ (1) Where n and m represent respectively the long term and short term, k equal to [n/m], ()n t r is the time t continu- ously compounded yield to maturity of the n period, ()m tim r + is the time tim+ continuously compounded yield to maturity of the m period, Et is the expectation operator based on available information, and ()n θ denotes term premium. Both sides of equation (1) subtract()m t r: 1 (,)()( )( )( ) 0 1 ()( )() 01 1() 1 k nmn mmm ttt ttimt i ki nmn ttjm ij srr Err k Er k θθ − + = − + == =− =− +=Δ + ∑ ∑∑ (2) Known from equation (2), if ()n t r,()m t rhave a unit root, ()( )nm tt rr− will be a stationary process, or ()n t r and ()m t r have the cointegration relationship with cointegrating vector (-1, 1)’. Thus we can test for cointegration using unit root tests including the traditional unit root tests (DF and ADF). 2.2. The traditional unit root tests (DF and ADF) From theoretical and applied point of view, the traditional unit root tests (DF) can be represented as follows1: 1ttt yyu δ − Δ =+ (3) 11ttt yyu β δ − Δ =+ + (4) 12 1ttt ytyu ββ δ − Δ =+ ++ (5) Where δ , 12 , β β is the parameter, δ represents the in- tercept, {t y} denote variable list, t denote time or trend variable, t u i.i.d. 2 (0, ) σ . A null hypothesis with a unit root implies that0 δ = . The choice of formula (3), (4) or (5) is important since the distribution of the test statistic under the null hypothesis differs among these three cases. When the errors in (3), (4) or (5) are serially correlated, (3), (4) or (5) result in the following regression with p-order augmentation (ADF): 1 1 m ttitit i y yyu δα −− = Δ =+Δ+ ∑ (6) 11 1 m ttitit i yy yu βδ α −− = Δ =++Δ + ∑ (7) 12 1 1 m ttitit i y ty yu ββ δα −− = Δ =+++Δ+ ∑ (8) 3. The Nonlinear Unit Root Test (ESTAR) [11, 12, 13] The traditional unit root tests only assume linear adjust- ment, but the term structure of interest rates often has the characteristics of inherent nonlinear adjustment because of market frictions. Thus sometimes, wrong conclusions will be drawn if using the traditional unit root tests for term structure. In order to take into account such nonlinear ad- justment, this paper employs the unit root test in the 1 To know whether the DF model should include the intercept, the intercept and the time trend or neither in the test regression, see [14].  Empirical Research on Repo Rates Based on Exponential 79 Smooth Transition Autoregressive Model Copyright © 2008 SciRes JSSM nonlinear exponential STAR framework developed by Kapetanios, G., Y. Shin, and A. Snell (2003) [11]. 11 (;),1, , tt ttdt y yy ytT βγ θε −− − =+Θ +=L (9) where t ε i.i.d.(0, 2 σ ), and β and γ are unknown pa- rameters. The ESTAR model defines different regimes in terms of small and large absolute deviations of the transi- tion variable values from the threshold parameter value. Hence, this model has a ‘sandwich’ structure with the outer regime that is contrasted with the inner regime (Boriss Siliverstovs, 2005) [10]. The transition function of the exponential form is as follows: 2 ( ;)1exp() td td yy θθ − − Θ=−− (10) where it is assumed that0 θ ≥,and 1d≥ is the delay parameter. The exponential transition function is bounded between zero and 1;..ie Θ:R →[0, 1] has the properties: (0)0; lim()1 xx →±∞ Θ= Θ= and is symmetrically U-shaped around zero. Substituting (6) into (5) Kapetanios, G., Y. Shin, and A. Snell [11] obtain an exponential STAR (ESTAR) model, 2 11 [1 exp()] tt ttdt yy yy βγ θε −− − =+ −− + (11) Both sides of equation (11) subtract1t y −: 2 11 [1 exp()] tt ttdt yy yy φγ θε −− − Δ=+− −+ (12) where 1 φ β =−. The application that motivates the model is that of Sercu et al. (1995) [17] and of Michaelet al. (1997) [1].These authors analyse nonlinearities in the PPP relationship. They adopt a null of a unit root for real exchange rates and have an alternative hypothesis of stationarity, namely the long run PPP. Their theory suggests that the larger the deviation from PPP, the stronger the tendency to move back to equilibrium. In the context of the model, this would imply that while 0 ϕ ≥ is possible, we must have0 γ < and 0 ϕ γ +<for the process to be globally stationary. They claim that the ADF test may lack power against such stationary alternatives and one of the contributions of this paper is to provide an alternative test designed to have a power against such an ESTAR processes. More formally, geometric ergodicity and the associated asymptotic stationarity can be established by the drift condition of Tweedie (1975). A variant of the condition states that an irreducible aperiodic Markov chain t y is geometrically ergodic if there exists constants 1 δ <,B,L <∞ and a small set C such that 1 [/],, tt EyyyyL y c δ −=<+∀∉ 1 [/], , tt EyyyBy c − = ≤∀∈ The concept of the small set is the equivalent of a dis- crete Markov chain state in a continuous context. For more details see Tweedie (1975) [10], Balke and Fomby (1997) [20] and Kapetanios (1999) [11]. Following the practice in the literature (e.g. Balke and Fomby, (1997) [20], in the context of TAR models and Michael et al., 1997 in the context of ESTAR models), Kapetanios (2003) [11] and Daiki Maki (2005, 2006) [12] [13] impose 0 ϕ = in [12], implying that t y follows a unit root process in the middle regime. Kapetanios (2003) [11] and Daiki Maki (2005,2006) [12] [13] consider a null hypothesis that is a special case of a linear unit root which in terms of the above model implies that 0 ϕ = and 0 θ = .Under the alternative hypothesis (0 ϕ = but0 θ >), then t yfollows a nonlinear but globally stationary process provided that −2 < γ < 0, which we assume holds. In practice, there is likely to be little theoretical or prior guidance as to the value of the delay parameter d. We would suggest that d be chosen to maximise goodness of fit over d = {1, 2,max ,dL}.In what follows, to clarify ideas and in keeping with empirical practice to date (as in for example Michael et al.), Kapetanios (2003) [11] and Daiki Maki (2005, 2006) [12] [13] set d = 1. Imposing φ = 0 and d = 1 gives their specific ESTAR model (12) as 2 11 [1 exp()], ttt t yyy u γθ −− Δ =−−+ (13) Hence we test ,0: 0 = θ H (14) Against the alternative 0: 1> θ H. (15) Obviously, testing the null hypothesis (14) directly is not feasible, since γ is not identified under the null. If we compute a first-order Talyor series approximation to the ESTAR model under the null we get the auxiliary regres- sion 1 3, t t yyerror δ − Δ= + (16) This suggests that we could obtain the t-statistic for δ = 0 against δ < 0 as ^^ /..(), NL tse δ δ = (17) Where ^ δ is the OLS estimate of δ and ^ ..( )se δ is the standard error of ^ δ . Their test is motivated by the fact that the auxiliary regression is testing the significance of the score vector from the quasi-likelihood function of the ESTAR model, evaluated at θ = 0. Unlike the case of  80 Qi-Zhi He Copyright © 2008 SciRes JSSM testing linearity against nonlinearity for the stationary process, the NL t test does not have an asymptotic standard normal distribution. When the errors in (13) and (16) are serially correlated, (13) and (16) result in the following regression with p-order augmentation: 2 11 1 [1 exp()], p tjtjt tt j y yy yu ργ θ −− − = Δ=Δ +−−+ ∑(18) 1 3 1 t p tjtj j y yy error ρδ − − = Δ=Δ ++ ∑ (19) We can test the unit root via (18) instead of (13) and (19) instead of (16). 4. Data and Empirical Results In this paper, we employ the monthly interest rates of treasury bonds repurchase trading of national interbank market as long-term interest rates, expressed as R1M, daily interest rates as short-term interest rates, expressed as R1. It is because of the following reason to choose repurchase interest rate data [15]. First, repurchase interest rate of in- terbank market is the main variety of interest rate in China’s money market. In regards to the trading structure of money market, the amount of repurchase trade has a larger proportion in total transaction amount than that of trade in the Offered Market and Bond Market. Second, repurchase interest rate of interbank market is not only the tool of controlling and adjusting economics to every country’s central bank, but also one of important standards to decide the loan and deposit rate to commercial banks. The daily data obtained from www.ChinaMoney.com.cn consists of 572 periods between 2004:8-2006:1. Fig. 1 provides the change situations of R1, R1M and profit spread (R1M-R1). According to Fig. 1 and footnote○ 1, it can be confirmed: Empirical tests to R1 and R1M should include the intercept without the time trend, and empirical test to profit spread=R1M-R1 should not include the con- stant or the time trend. Tab.1 gives the simple statistics characteristics of them. 4.1. Tests for nonlinear of interest rates For simplicity, we estimate the nonlinear effect θ im- posing 1 γ =− on equation (12), similar to Kapet- anios(2003) [11]、Daiki Maki (2005,2006) [12] [13]. From Table 2, we can know that R1M does not have θ at a significant level, and R1 and the yield spread has a sig- nificant θ . This estimation shows that R1M do not have nonlinear adjustment, but R1 and the yield spread have nonlinear adjustment. As for the criteria to determine the appropriate length of the distributed lag, we use the Akaike info criterion (AIC), Schwarz criterion (SC) and t-sig. As to the Akaike info criterion (AIC) and Schwarz criterion (SC), we select the model with the smallest information criterion. As to t-ing, we set the maximum lag=12. t-ing selects the lag order k via top-down testing. To begin with, we estimate the equation with the maximum lag (here, the maximum lag kmax=12). We use the lag order if the t-statistic of the pa- rameter of the maximum lag is significant. If the t-statistic is not significant, we estimate the equation with the 1 max − = klag . That is, when the t-statistic of the pa- rameter of the qklag − = max is significant at a conven- tional level, we employ the lag order [13]. 4.2. Unit root tests ADF and ESTAR denote the unit root tests by Dickey and Fuller (1979) [17] and Kapetanios et al. (2003) [11], re- spectively. As shown in Table 3, all of the tests do not re- ject the unit root of interest rates at the level, but reject the unit root of interest rates at first-order difference. There- fore, the results show that interest rates is integrated of order 1, namely I (1) process. -0.01 0.00 0.01 0.02 0.03 0.04 R1 R1M SPREAD 2004-8-2 2005-6-7 2006-4-25 2006-1-12 Figure 1. Interest rates of repurchase trading 4.3. Cointegration tests According to the expectation theory, if different term in- terest rates are all integrated of order 1 :I(1),the yield spread between different term interest rates are stationary, or different term interest rates have the cointegration rela- tionship with cointegrating vector (-1,1)’. Table 4 shows the results of the unit root tests of the yield spread. The results of ADF test fail to reject a unit root at a 1% sig- nificance level according to either criterion, even at a 5% according to AIC and t-ing criterions. In contrast, the test by Kapetanios et al. (2003) [11] provides strong evidence against the unit root of the yield spread at a 1% signifi- cance level, even when different lag criterions are em- ployed. This finding asserts that the long-run equilibrium relationship between different term interest rates is stable with nonlinear adjustment. 5. Conclusion The paper has researched the characteristics of Chinese interbank repo interest rates, and the relation between Chinese interbank repo interest rates with different ma- turities. The traditional unit root test ADF and the unit root  Empirical Research on Repo Rates Based on Exponential 81 Smooth Transition Autoregressive Model Copyright © 2008 SciRes JSSM test in the exponential nonlinear smooth transition auto- regressive (ESTAR) framework are introduced and ap- plied to the reality of Chinese financial market. Main conclusions are as follows: First, the monthly interest rates R1M do not have the characteristic of nonlinear adjustment, but R1 and the yield spread have the characteristic of nonlinear adjustment. Second, both lists of monthly interest rates R1M and daily interest rates R1 are integrated of order 1 :I(1), whatever tested by ADF test or tested by ESTAR proposed by Kapetanios et al. (2003) [11]. Third, if we test the spread R1M-R1 by use of ADF, No matter use AIC, sc information standard or t-sig criterion, it will not refuse unit root at at a 1% level (AIC information standard and t-sig criterion even at a5% level).Thus we can get the wrong conclusion that the spread R1M-R1 is not a stationary list and the expectation theory can not come into existence. Forth, if we test the spread R1M-R1 by use of ESTAR, after considering non-linear adjustment, No matter use AIC, sc information standard or t-ing criterion, it will re- fuse unit root at a 1% level. Thus the spread R1M-R1 have the cointegration relationship with cointegrating ve ctor(-1, 1)’, and then we can get the conclusion to support the ex- pectation theory. The results provide strong evidence against the unit root of the yield spread between daily interest rates and monthly interest rates. The findings show that the long-run Table 1. Sample descriptive statistics Variables Observations Mean Max Min Std. DevSkewness Kurtosis R1 605 1.650762 3.6029001.0530000.4825110.903755 4.232855 R1M 572 2.071604 3.5347001.1904000.5892630.190826 1.879266 Table 2. Tests for nonlinearityA R1 R1M sperad θ t θ θ t θ θ t θ AIC 16.64400(9) 2.676826** 8.271662(9) 1.647177517.3570(5) 2.889583** sc 17.08785(8) 2.759931** 7.379115(8) 1.470843660.7691(2) 3.725535** t-sig 17.08785(8) 2.759931** 5.405781(5) 1.026662517.3570(5) 2.889583** Annotate: A Parentheses show lag length. *(**) Significant at a 5 %( 1%) level to refuse. Table 3. Unit root tests for repo ratesB methods ADF STAR variables R1 R1M R1 R1M level: AIC -2.724232(9) -2.273499(9) -2.706878(9) -1.654935(9) sc -2.845593(8) -2.147877(8) -2.793031(8) -1.477065(8) t-sig -2.845593(8) -1.801322(5) -2.793031(8) -1.029404(5) first difference: AIC -7.520771**(12) -8.221985**(12) -3.460175**(12) -6.318140**(12) sc -7.520771**(12) -8.221985**(12) -3.460175**(12) -6.318140**(12) t-sig -7.176747**(7) -16.14545(12) -3.397295* (9) -6.293071** (8) Annotate: B Unit root tests are sensitive to lag length, we determine lag length us- ing three lag criterions: the Akaike Information Criterion and Schwarz Criterion and t-sig introduced by Ng and Perron(1995).see[1]. *( **) Significant at 5 %( 1%) level to refuse. Table 4. Unit root tests for the yield spread ADFESTA R AIC -1.571899(5) -3.035473** (5) sc -2.340362* (2) -3.939495** (2) t-sig -1.571899(5) -3.939495** (2) 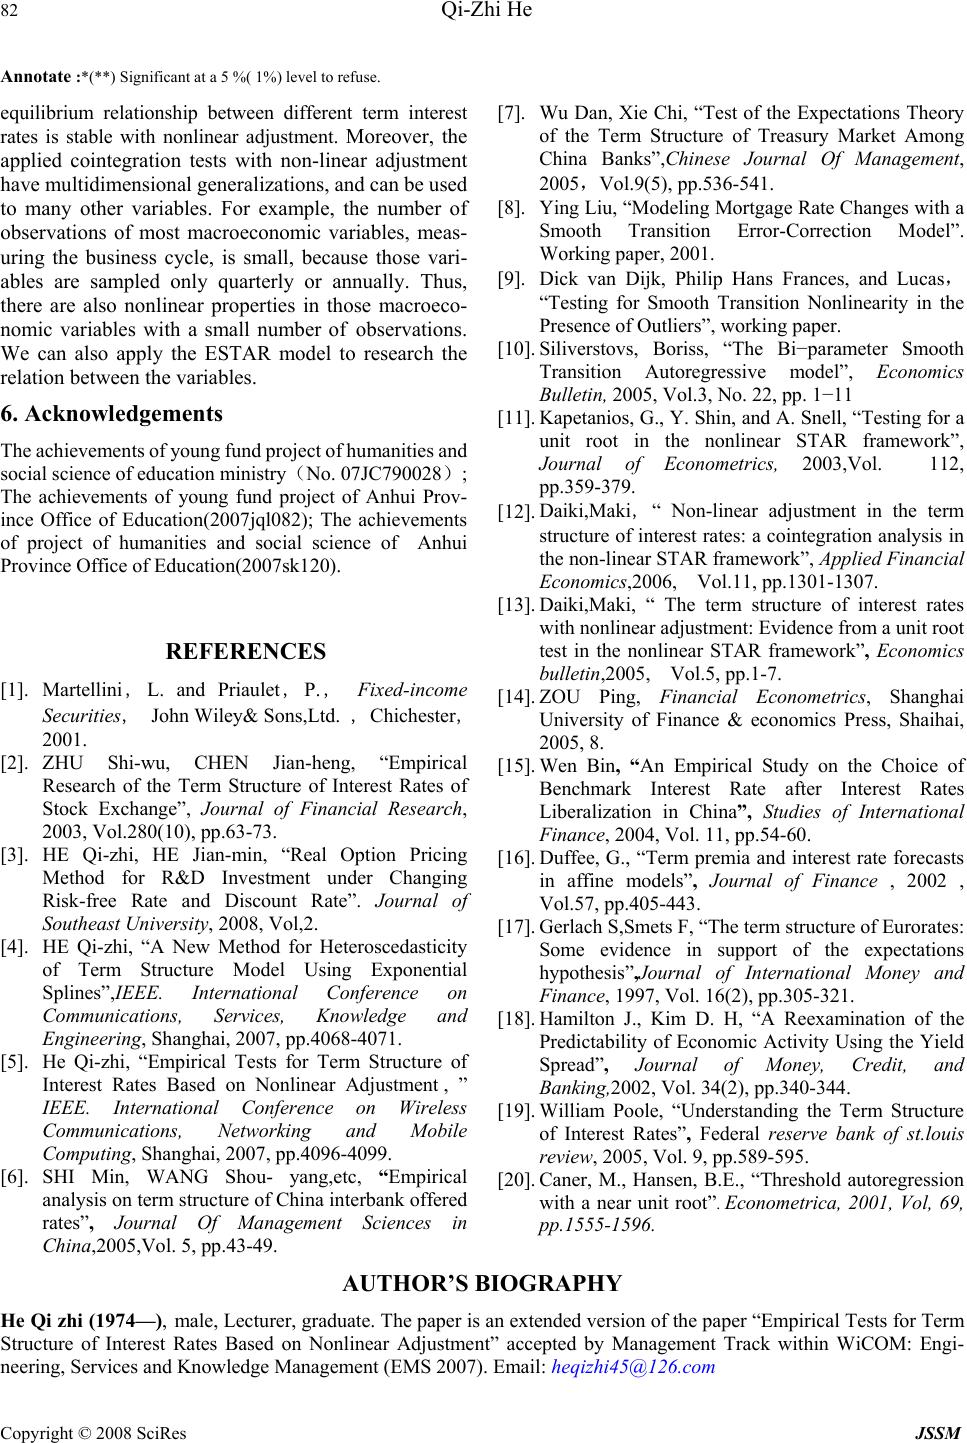 82 Qi-Zhi He Copyright © 2008 SciRes JSSM Annotate :*(**) Significant at a 5 %( 1%) level to refuse. equilibrium relationship between different term interest rates is stable with nonlinear adjustment. Moreover, the applied cointegration tests with non-linear adjustment have multidimensional generalizations, and can be used to many other variables. For example, the number of observations of most macroeconomic variables, meas- uring the business cycle, is small, because those vari- ables are sampled only quarterly or annually. Thus, there are also nonlinear properties in those macroeco- nomic variables with a small number of observations. We can also apply the ESTAR model to research the relation between the variables. 6. Acknowledgements The achievements of young fund project of humanities and social science of education ministry(No. 07JC790028); The achievements of young fund project of Anhui Prov- ince Office of Education(2007jql082); The achievements of project of humanities and social science of Anhui Province Office of Education(2007sk120). REFERENCES [1]. Martellini,L. and Priaulet,P., Fixed-income Securities, John Wiley& Sons,Ltd. ,Chichester, 2001. [2]. ZHU Shi-wu, CHEN Jian-heng, “Empirical Research of the Term Structure of Interest Rates of Stock Exchange”, Journal of Financial Research, 2003, Vol.280(10), pp.63-73. [3]. HE Qi-zhi, HE Jian-min, “Real Option Pricing Method for R&D Investment under Changing Risk-free Rate and Discount Rate”. Journal of Southeast University, 2008, Vol,2. [4]. HE Qi-zhi, “A New Method for Heteroscedasticity of Term Structure Model Using Exponential Splines”,IEEE. International Conference on Communications, Services, Knowledge and Engineering, Shanghai, 2007, pp.4068-4071. [5]. He Qi-zhi, “Empirical Tests for Term Structure of Interest Rates Based on Nonlinear Adjustment , ” IEEE. International Conference on Wireless Communications, Networking and Mobile Computing, Shanghai, 2007, pp.4096-4099. [6]. SHI Min, WANG Shou- yang,etc, “Empirical analysis on term structure of China interbank offered rates”, Journal Of Management Sciences in China,2005,Vol. 5, pp.43-49. [7]. Wu Dan, Xie Chi, “Test of the Expectations Theory of the Term Structure of Treasury Market Among China Banks”,Chinese Journal Of Management, 2005,Vol.9(5), pp.536-541. [8]. Ying Liu, “Modeling Mortgage Rate Changes with a Smooth Transition Error-Correction Model”. Working paper, 2001. [9]. Dick van Dijk, Philip Hans Frances, and Lucas, “Testing for Smooth Transition Nonlinearity in the Presence of Outliers”, working paper. [10]. Siliverstovs, Boriss, “The Bi−parameter Smooth Transition Autoregressive model”, Economics Bulletin, 2005, Vol.3, No. 22, pp. 1−11 [11]. Kapetanios, G., Y. Shin, and A. Snell, “Testing for a unit root in the nonlinear STAR framework”, Journal of Econometrics, 2003,Vol. 112, pp.359-379. [12]. Daiki,Maki,“ Non-linear adjustment in the term structure of interest rates: a cointegration analysis in the non-linear STAR framework”, Applied Financial Economics,2006, Vol.11, pp.1301-1307. [13]. Daiki,Maki, “ The term structure of interest rates with nonlinear adjustment: Evidence from a unit root test in the nonlinear STAR framework”, Economics bulletin,2005, Vol.5, pp.1-7. [14]. ZOU Ping, Financial Econometrics, Shanghai University of Finance & economics Press, Shaihai, 2005, 8. [15]. Wen Bin, “An Empirical Study on the Choice of Benchmark Interest Rate after Interest Rates Liberalization in China”, Studies of International Finance, 2004, Vol. 11, pp.54-60. [16]. Duffee, G., “Term premia and interest rate forecasts in affine models”, Journal of Finance , 2002 , Vol.57, pp.405-443. [17]. Gerlach S,Smets F, “The term structure of Eurorates: Some evidence in support of the expectations hypothesis”,Journal of International Money and Finance, 1997, Vol. 16(2), pp.305-321. [18]. Hamilton J., Kim D. H, “A Reexamination of the Predictability of Economic Activity Using the Yield Spread”, Journal of Money, Credit, and Banking,2002, Vol. 34(2), pp.340-344. [19]. William Poole, “Understanding the Term Structure of Interest Rates”, Federal reserve bank of st.louis review, 2005, Vol. 9, pp.589-595. [20]. Caner, M., Hansen, B.E., “Threshold autoregression with a near unit root”. Econometrica, 2001, Vol, 69, pp.1555-1596. AUTHOR’S BIOGRAPHY He Qi zhi (1974—), male, Lecturer, graduate. The paper is an extended version of the paper “Empirical Tests for Term Structure of Interest Rates Based on Nonlinear Adjustment” accepted by Management Track within WiCOM: Engi- neering, Services and Knowledge Management (EMS 2007). Email: heqizhi45@126.com |