Technology and Investment
Vol. 4 No. 3 (2013) , Article ID: 35488 , 11 pages DOI:10.4236/ti.2013.43020
Limits of Biotechnological Innovation*
1Biology and Society Department, Faculty of Earth and Life Sciences, VU University Amsterdam, Amsterdam, The Netherlands
2Virology/Knowledge Valorization Departments, Erasmus Medical Centre, Rotterdam, The Netherlands
Email: #kenneth.fernald@gmail.com
Copyright © 2013 Kenneth Dimitri Satyagraha Fernald et al. This is an open access article distributed under the Creative Commons Attribution License, which permits unrestricted use, distribution, and reproduction in any medium, provided the original work is properly cited.
Received June 15, 2013; revised July 15, 2013; accepted July 22, 2013
Keywords: Biotechnology; Lifecycle; Saturation; Innovation; Biopharmaceuticals
ABSTRACT
During the past two decades the biopharmaceutical industry has been facing an innovation deficit, characterized by increasing research & development costs and stagnant productivity. From its inception, biotechnology has been expected to counter this deficit by its revolutionary science-based approach to drug discovery. For this study we gathered patent and product data related to the technological development of the first two biotechnologies: recombinant DNA technology and monoclonal antibody technology. We studied the technological lifecycles of these technologies in terms of scientific discoveries and inventions as well as product innovations. Results indicate that over the years inventions related to these technologies have simultaneously become less radical and less valuable. Furthermore, our analysis shows that these biotechnologies have reached a stage of technological limit or saturation, which may be followed by an innovation cliff. Now, more than ever, it is crucial to examine new strategies and opportunities for value creation, capturing, and delivery, within the biopharmaceutical industry.
1. Introduction
The revolutionary characteristic of biotechnology is the fact that it is derived from advances in fundamental science, and can be used for discovery and development of new products to fulfil unmet medical needs. The rise of biotechnology transformed drug discovery and development from traditional pharmaceutical target screening to a science-deductive process [1,2]. Consequently, it became possible to target new leads based on the understanding of complex biological systems.
From the first technological breakthroughs in the 1970s, high expectations arose that biotechnology would radically improve drug development and generate new classes of biological products. Moreover, specific biotechnological products were expected to counter declining pharmaceutical productivity [3-5].
Contrary to those initial expectations, several researchers have since suggested that those optimistic expectations of biotechnology are unsupported by empirical evidence [6] and that the “biotech revolution” has been disappointing in terms of new products and financial performance [7,8]. Based on their study of preclinical product development data covering 1992 and 1993, Drews & Ryser (1996) [9] already predicted that the output of biotechnology would be insufficient to counter the pharmaceutical innovation deficit.
Even with a dramatic five fold increase in research & development (R&D) spending there appears to be no effect on New Chemical Entity (NCE i.e. New Molecular Entity) production, resulting in a pharmaceutical “productivity gap” (Figure 1) [10-12]. In addition, patent expirations of blockbuster drugs might cause incumbent pharmaceutical firms to lose billions of US dollars in combined annual sales [13].
Evidently, pharmaceutical firms are in need of innovation to increase productivity. Therefore, it is important to study the innovation patterns and lifecycles of individual biotechnologies. Such specific patterns can be examined using technology forecasting, a useful tool for identifying phases of a given technology’s lifecycle [14,15].
In this paper, we examine the patterns of innovation regarding the first two major medical applications of biotechnology: recombinant DNA (rDNA) technology and monoclonal Antibody (mAb) technology. These biotechnologies have generated a sufficient number of market-
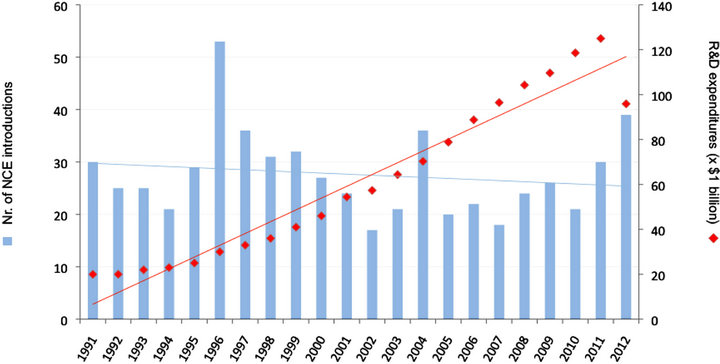
Figure 1. The pharmaceutical “productivity gap”; the considerable rise of R&D expenditures versus a stagnant pattern of New Chemical Entity (NCE) introductions (Data obtained from fda.gov, Medtrack and literature (Drews, 1998; EFPIA)).
able biological products that are currently available as prescription drugs. We propose that identifying and analyzing patterns in biotechnological innovation and product development is an important prerequisite for defining optimal innovation strategies needed to improve new product development and value creation in the biopharmaceutical industry.
2. Literature Review
2.1. Biotechnology
The application of biotechnologies in medical product development has a relatively short history. The first publications on successful intracellular production of rDNA appeared in 1972 and 1973 [16-18]. In 1974, Stephan Cohen and Herbert Boyer from Stanford University applied for the first patent on rDNA [19]. Most practitioners of molecular biology and rDNA technology worked in universities and research institutions rather than within the industry [5].
In the late 1970s/early 1980s, private companies such as Genentech began to focus on rDNA technology [20]. This sparked a biotechnology revolution that led to multiple usages for rDNA technology (e.g. treating hemophilia, hepatitis, cystic fibrosis), as well as paving the way for new biotechnological platforms leading to monoclonal antibodies, the Human Genome Project, genomics, and gene therapy [21]. Recombinant DNA technology was in fact the first revolutionizing biotechnology that was implemented in corporate R&D of biopharmaceutical companies and produced the first biotechnological product called “Humulin” (i.e. recombinant human insulin) introduced by Genentech and Eli Lilly in 1982 [21].
The potential for life-saving cancer treatments due to rDNA technology caused a second wave of innovation in biotechnology involving mAb technology [22]. Advances in genetic engineering in the late 1980s provided the technology to humanize mAbs [23]. These advances spurred further R&D of many mAb applications for treatment of various medical needs (e.g. cancer, autoimmune diseases) [24,25].
The two closely related technologies (rDNA and mAb) quickly became efficient methods of producing comercially important substances. Wright (1986) [5] described this process as a transformation of an area of basic scientific research that occurred in an intense pace of development. However, R&D durations of marketed biopharmaceutical products have increased from approximately 4 years in 1982 (e.g. Humulin) to approximately 12 years in the late 1990s (e.g. interferon-β1b), with an estimated average of 8 years [26].
2.2. Innovation
According to Garcia & Calantone (2001, p.112) [27], the essence of innovation can best be described as: “an iterative process initiated by the perception of a new market opportunity for a technology-based invention which leads to development, manufacturing, and marketing tasks aspiring commercial success of the invention”. As these authors indicate, this definition addresses two important aspects [27]. First, the innovation process comprises the combination of technological development of an invention and the market introduction of that invention to endusers. Application of this combination in the context of the industry as examined in this paper is difficult because invention and market introduction are two activities separated by 10 - 14 years of R&D and hundreds of millions of R&D-spent US dollars [28,29]. In addition, conducting these separate activities requires very different knowledge, expertise, resources and capabilities, typically illustrated by the need for nimble biotech companies and incumbent pharmaceutical firms to work in collaborations and alliances [30-32]. This is one of the reasons why biotechnological inventions that might lead to a product are often described as innovations and patents are often used as a measure for biotechnological innovation [33, 34].
The second important aspect of the above described definition is that innovation is an iterative process and therefore includes the introduction of new innovations on the one hand, and the reintroduction of improved innovations on the other. This brings us to the need to classify innovation according to various degrees of innovativeness, distinguishing, in particular, between radical and incremental innovation [27,35,36].
2.3. Technological Lifecycles
It is generally presumed that a technology follows a certain pattern throughout its lifecycle. The technology saturation-curve (S-curve) method of analysis has been described and employed to retrieve information on the lifecycle phase of a given technology (Figure 2) [37,38]. The technology S-curve can be illustrated by means of a certain technology’s cumulative patent count against time or R&D expenditures.
According to Ernst (1997) [37], the lifecycle of a technology consists of four fundamental phases, namely emerging, growth, maturity, and saturation. Emerging is characterized by low technological growth performance compared to R&D input. Growth is identified by a positive growth progress compared to cumulative R&D input. Maturity is the opposite: negative growth progress occurs compared to R&D input. The final stage, saturation, is characterized by relatively few technological innovations despite a very large cumulative R&D input.
Technologies can further be classified according to two dimensions, namely the integration of the technology in products or processes and the competitive impact of the technology [37]. When a technology emerges, both the integration in products or processes, and the competitive advantage are low. As inventions related to the technology accumulate over time the competitive advantage increases and the technology becomes a pacing technology in the growth phase. When the pacing technology is increasingly integrated in products or processes it be-
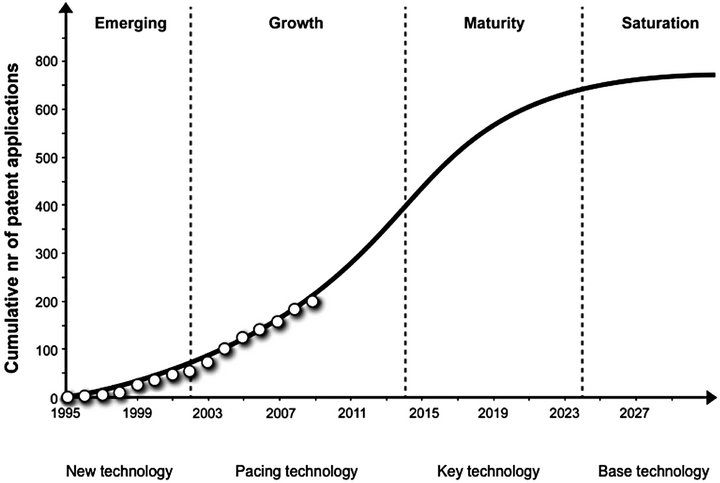
Figure 2. The technology S-curve (adapted from Ernst, 1997) with cumulative patent data related to medical nutrition (adapted from Weenen et al., 2013).
comes a key technology. Subsequently, over time, the technology starts to lose its degree of competitive advantage and it becomes a base technology. At this point saturation or technological limit is reached.
The technology-forecasting tool is useful because it indicates the current life cycle phase of a technology, allowing companies to strategize for the future [14,15]. For example, when Chen et al. (2011) [15] assessed technologies for generating and storing hydrogen, they showed that it had not yet reached the maturity phase. Therefore, they were able to recommend increased R&D funding for the technology to accelerate development (Chen et al., 2011). Similarly, Weenen et al. (2013) [38] examined medical nutrition patent data and showed that the medical nutrition industry is currently in the growth stage (Figure 2), indicating ample future innovation opportunities.
3. Methodology
3.1. Data Collection
Patent applications are perceived as an important indicator, since patent analysis reveals information on historical developments of the technologies investigated in this study. The patent data for this study was gathered from several patent databases using AcclaimIP patent analysis software1. The acquired data was compared with data directly gathered from the World Intellectual Property Organization (WIPO)2, the United States Patent and Trademark Office (USPTO)3, and Thomson Reuters’s Derwent Innovation Index4. Over the period of 1980 until 2011, we gathered a total of 7350 patents regarding mAb innovations and 9111 patents regarding other rDNA innovations. Patent data is readily available and categorized according to a system of international patent classification (IPC). The IPC is a complex hierarchical classification system encompassing all areas of technology and is currently used by industrial property offices in more than 90 countries [39]. Each patent is given an IPC code that lists its section, class, subclass, group, and usually subgroup [39]. We used these codes to identify relevant patents in the databases.
Recombinant proteins can be divided into various subtypes, with monoclonal antibodies being the largest subtype. Therefore, we decided to divide the sub-types of recombinant proteins so that two different biotech trends could be plotted separately. Falciola (2009) [40] states that patents involving antibodies commonly contained at least one of the following IPC codes: C07K16/* (Immunoglobulins, as a class of proteins), A61K39/395 (medicinal preparations containing antibodies), or G01N33/ 53 (assays involving the use of antibodies). Therefore, we decided to only look at patents involving monoclonal antibodies containing at least one of these IPC codes (C07K16/*, A61K39/*, or G01N33/53). For patents regarding rDNA technology we included all sub-types of recombinant protein products other than antibodies. These include recombinant blood factors, insulin, hormones, interferons, growth factors, interleukins, and thrombolytic proteins. For the gathering of this data we included the following IPC codes: C07K14/*, C12N15/* or A61K38/*. In the generative syntax we excluded IPC codes: A01H5/*, C12N5/*, C12N15/29, and C12N15/82, as these codes relate to inventions with no relevance to rDNA technology. Although data from both US and non-US companies are included in the study, only US patents were included in the analysis. This decision is justified by the fact that almost all companies, both US and non-US, choose to file their patents in the US, amongst other countries, in order to take advantage of the vast US market [41].
In addition, data on biopharmaceutical products was gathered by means of literature research and database development using the Food and Drug Administration (FDA) database5, the FDA Orange Book and the Medtrack database6.
3.2. Patent Citation Analysis
When analyzing patent data, citations form an important source of information. There are two types of citations: backward and forward citations. The former refers to patents that have been cited by the patent in consideration [42]. This is an indicator of preceding knowledge and the average number of backward citations has proven to be invertly related to the radicalness of the respective invention; lower numbers of backward citations are associated with more radical inventions [38]. Forward citations refer to the frequency with which a particular patent is cited by newer patent applications. Annual average forward citations of a patent serve as an indicator of technological importance and economic value of that invention [36,38, 43]. In other words, patent citations describe the quality of a patent and the effects that a patent has had on later technological advances (i.e. other patents) [41]. Applicants of patents generally include citations in the patent application but the patent office examiners ultimately determine which citations are included [44]. Therefore, citation analysis is considered to be a valid and unbiased method of studying technological developments. We define the annual Average Backward Citations (ABCk) and the annual Average Relative Forward Citations7 (ARFCk), as follows:
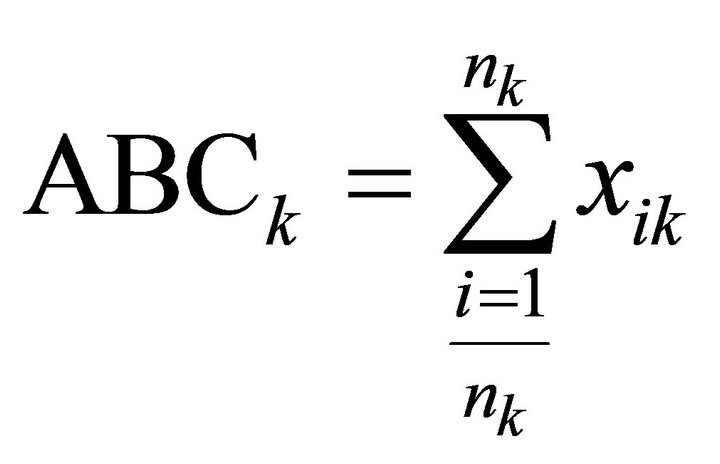
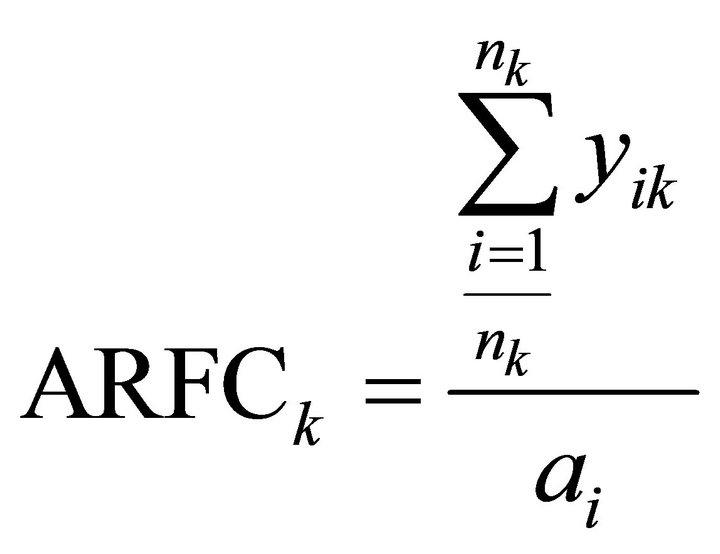
(Results shown in Figures 3(a) and (b)).
Where nk is the number of patents in year k and xik are the number of backward citations for patent i in year k. yik are the number of forward citation for patent i in year k and ai is the age of patent i.
3.3. Lifecycle Analysis
The annual accumulation of patents in a specific area of technological innovation yields valuable information regarding technological lifecycle patterns and develop-
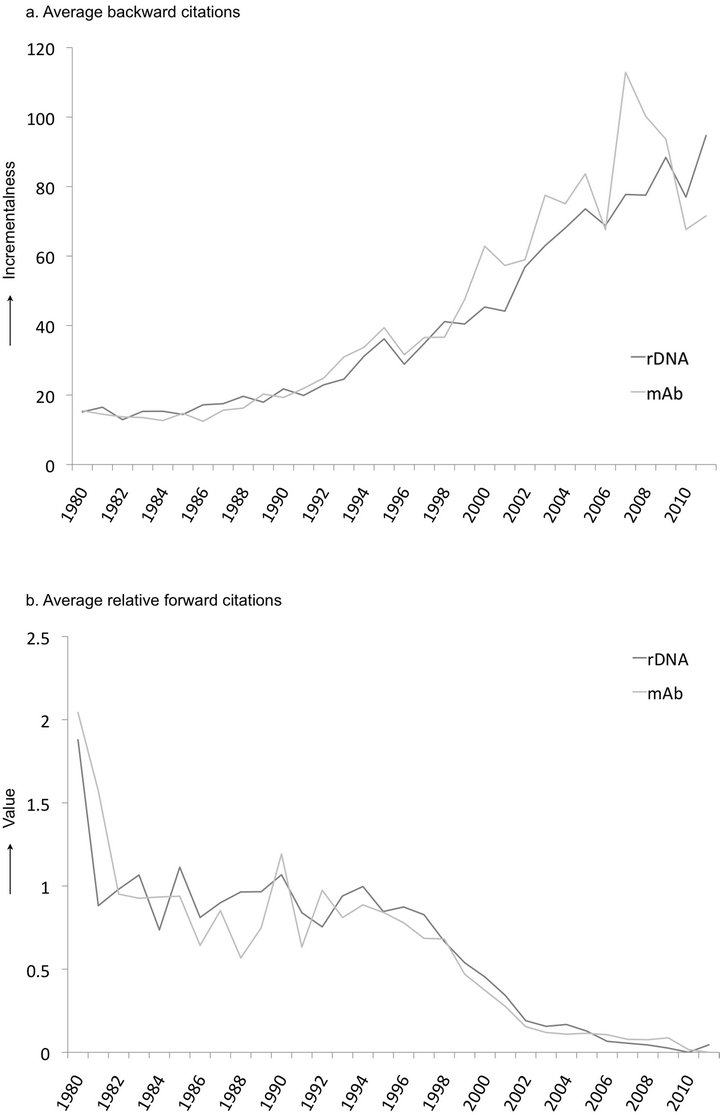
Figure 3. (a) The average backward citations of rDNA and mAb patent applications indicating the degree of incrementalness of patents over time; (b) The average relative forward citations of rDNA and mAb patent applications indicating the economic value of patents over time.
ment phases of the respective technology [15,37]. The technology S-curve was constructed by plotting the cumulative number of patents against time according to the file dates of those patents. Similarly to an S-curve based on patents, product introductions related to a specific technology can be plotted cumulatively against time, following a patent S-curve with a time lag of several years due to R&D. Furthermore, cumulative revenues generated by these products help gain insights into current returns on investments in these technologies as well as the future potential earnings from the respective technology related products. Analysis of these three independent parameters resulted in the curves as shown in Figure 4.
4. Results
4.1. Citation Analysis
Figure 3(a) shows the annual backward citations for recombinant protein and mAb patents. The graph clearly indicates that patents from the early 1980’s had a relatively low number of backward citations compared to more recent patents. This rising trend of backward citations indicates that innovation in these technologies has become less radical and thus more incremental because newer patents appear to be more reliant on prior knowledge and IP.
Conversely, the average annual trend of forward citations is decreasing in Figure 3(b). This indicates that the economic value of patented inventions related to both technologies has been decreasing over time. There appears to be a direct correlation between the radicalness and the value of an innovation8. Figure 3 clearly shows that radical inventions are more valuable than incremental inventions, and over time inventions have become more incremental, and therefore, less valuable.
4.2. Technology Lifecycle
In Figure 4(a) the lifecycles of both technologies clearly match an S-curve. Around 2007, it looks as though the lifecycles have reached the final phase of saturation, indicating that it is not likely that these technologies will instigate many subsequent innovative advances.
By comparing this technology S-curve to the patent citation trends (Figure 3), we show that the patents that are being approved more recently could be considered less innovative since they rely so heavily on previous patents. The fact that the technologies have reached a point of saturation supports the idea that radical innovation is far more apparent at the emergence of a technology and innovation becomes more incremental during the course of technological development. These results fully correspond to the hypotheses of Haupt et al. (2007) [45] who predict patent citation indices during technology life cycle stage transitions.
4.3. Biopharmaceutical Products
Overall, 81 recombinant protein products have reached the US market. 31 of these concerned monoclonal antibody products. Figure 4(b) shows that the majority of the products associated with the studied technologies were approved during the last decade. Considering average R&D timelines for pharmaceutical products of 8 years [26], it can be assumed that most products approved between 2000 and 2010 were products from the technological growth phase that took place between 1993 and 2000 as illustrated in Figure 4(a). Following this rationale, one can expect several more rDNA and mAb products of which the origin lies in patents filed during the subsequent maturity phase. However, these results do indicate that the peak in terms of inventions and products related to these technologies has past.
Similarly, revenues generated by the products included in our analysis have been plotted cumulatively against time (Figure 4(c)). With these biopharmaceutical products the industry realized a combined sales volume of 582 billion USD, up until 2012. Monoclonal antibody products accounted for 217 billion USD of this total sales volume and other recombinant protein products generated the remaining 365 billion USD. In the context of the law of diffusion of innovation [46], it is safe to presume that product revenues peak several years after the introduction of the respective product. Similarly, our results indicate that revenues are still growing and companies can still expect growth in returns through sales of the products currently on the market. However, to put things in perspective, the global pharmaceutical industry has generated approximately 750 billion USD per year on average during the period 2003-20119. This means that products associated with the studied technologies have only accounted for approximately 5% of global pharma sales between 1995 and 2012. Evidently, these figures are insufficient to counter or at least compensate for part of the innovation deficit that pharma has been struggling with for years.
5. Conclusions and Discussion
At a relatively low level of 5% of global pharma sales over the past 17 years, we show that the first biotechnologies have reached a stage of technological limit. New patents related to these technologies are becoming less radical and less valuable and the technology S-curve analysis shows that the technological development currently finds itself in a saturation phase. In addition, the product
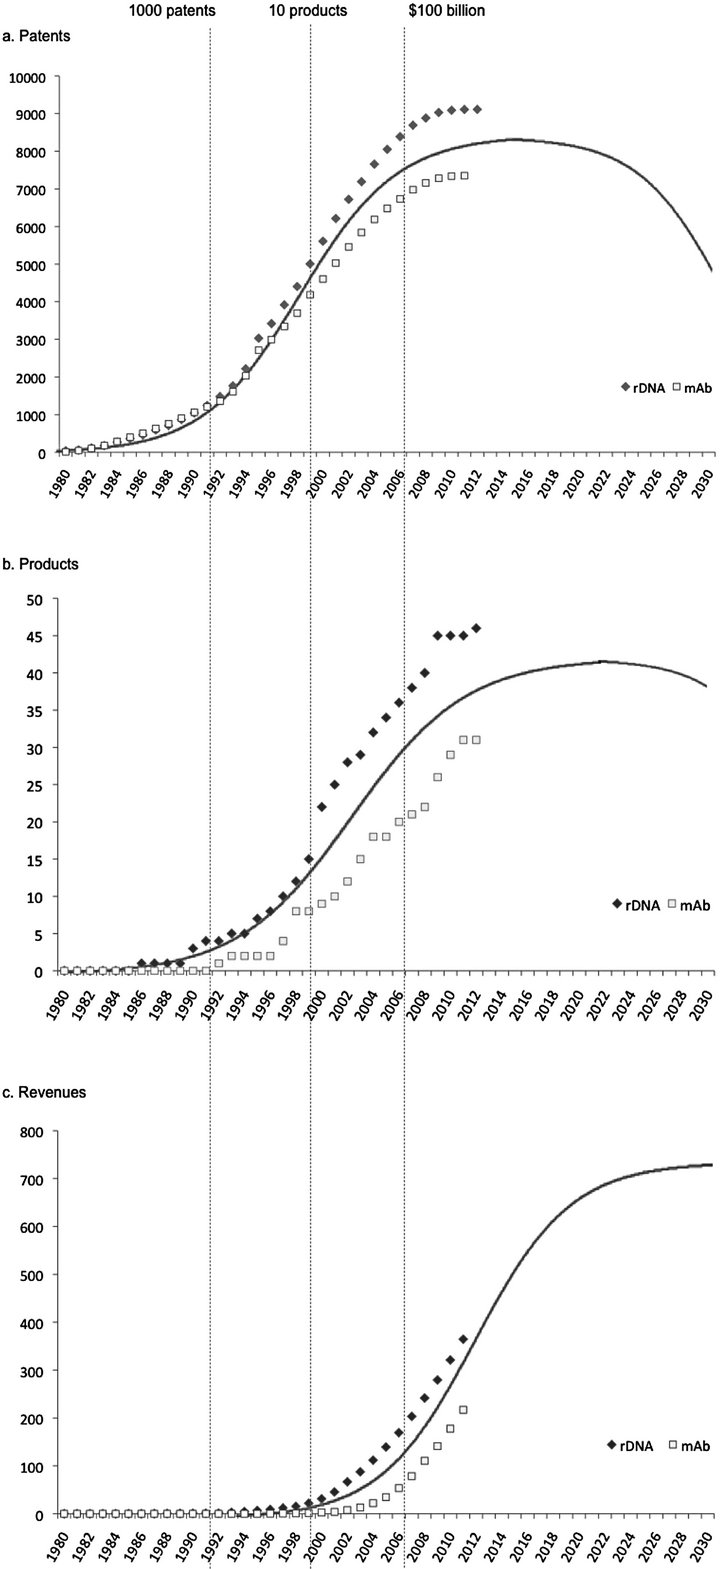
Figure 4. (a) The cumulative number of rDNA and mAb patent applications illustrating the technology S-curves of these biotechnologies; (b) The cumulative number of rDNA and mAb product introductions; (c) Cumulative revenues generated by marketed rDNA and mAb products.
curve appears to be reaching a plateau as well, making it difficult to expect future growth in product introductions generated by these technologies. On a positive note, our results indicate that revenues generated by biopharmaceutical products are still growing. However, given these results we conclude that these individual technologies will not live up to the expectation of biotechnology at its inception.
This conclusion gives a quantitative basis for earlier assumptions, which projected that the biotech output during the first years of the 21st century would not be sufficient to make up for NCE deficits [7,9]. According to our results, even less recombinant proteins and monoclonal antibodies eventually reached the market than was projected in these studies [7,9]. In the late 1990s and early 2000s other authors argue that it was too early to tell whether the structural industry changes triggered by biotechnology, would measurably affect industry productivity [7,47]. In hindsight, we can now conclude that so far, biotechnologies exerted little impact on overall pharmaceutical productivity. Moreover, the first biotechnologies that actually generated marketable products are already reaching their technological limits. Subsequent biotechnologies (i.e. combinatorial chemistry, cell-based assays, bioinformatics, genomics, pharmacogenetics and gene therapy) have not yet led to an increase in industry productivity either. In addition, the costs of developing a single innovative compound have risen from 750 million USD between 1995 and 2000 to 1.3 billion USD between 2005 and 2010 [7,26]. The R&D costs for a single marketable product are expected to grow well beyond 2 billion USD, considering current R&D expenditures [48,49].
It seems that the currently employed traditional pharmaceutical blockbuster business model may not be fully applicable to science-based technology and innovation, and the changes it caused in drug discovery [8,50]. Our results imply several scenarios and developments within the industry that may involve different strategies and new opportunities.
Implications
The main conclusion of this paper implies a rather pessimistic scenario for early biotechnologies as the saturation or the maturity phase might be followed by an “innovation cliff” [32]. Early biotechnologies have reached their technological limit and there is a lack of newer radically innovative technologies that are currently generating product innovations. These outcomes may be determinants for an innovation cliff in biotechnology. This would be disastrous for the pharmaceutical industry at large as incumbent firms relied heavily on biotech to come forth with product innovations that would reverse the decline in productivity. In addition, patent expirations of current cash cow blockbuster drugs pose an even larger threat if a biotechnological innovation cliff would become imminent. Subsequent losses in annual sales affect future R&D investments, which are needed for new product development and attracting new knowledge and innovation.
Another scenario might involve further development and innovation with respect to initial biotechnologies. During the growth/maturity phases of technological development it is useful to suggest a shift in focus regarding innovation towards the development of new technologies. In reference of the theory regarding technological development and innovation S-curves, rDNA and mAb technologies may have functioned as base technologies [37] for subsequent innovative technologies such as genomics and gene therapy that may spur a new S-curve of their own. In literature, this concept is described as “jumping the S-curve” [32,51]. Up to date, these subsequent technologies appear to have little to no impact on pharmaceutical productivity, as there are no examples of approved drugs that directly resulted from these technologies. Nonetheless, newer technologies might still have a significant impact on future biopharmaceutical productivity although counteracting the innovation deficit might require more than implementing these biotechnologies into new product development.
However, in discussion of the S-curve concept, which is broadly embraced in strategic literature, Sood & Gerard (2005) [52] dispute the notion of a single S-curve and state that “technological evolution seems to follow a step function with sharp improvements in performance following long periods of no improvement”. A technological S-curve might simply represent such a sharp step of radical improvement. Within the context of this paper, this would imply that following the S-curve of the rDNA and mAb technologies, we can expect a longer period of incremental innovation which might be followed by a future burst of radical innovation, of which the effects on productivity are unknown. If this process were real, it would imply that the possibility of “jumping the S-curve” entirely depends on subsequent radical technological innovation.
Regardless, it is fairly urgent and important to consider new strategies and opportunities for increased value creation, capturing, and delivery. Extensive exploration of such strategies is beyond the scope of this paper. However, we will briefly discuss the implications of two suggested strategies that might yield significant opportunity for value creation.
According to some, an opportunity resides in reinventing the traditional pharmaceutical business model with respect to diagnostic-drug linked products (i.e. theranostics) and “personalized medicine” [50,53,54]. Newer technologies such as genomics and pharmacogenetics can enrich clinical research by defining patient groups with the most favourable risk-benefit ratio, making it easier to statistically determine efficacy, safety and appropriate dosage of a so-called theranostic in development [53-55]. Thereby, such technologies can function as a “key resource” for a reinvented pharma business model. However, there are two simple but important determinants that form the basis for the current “blockbuster model”; 1) very high and increasing new product development costs, as discussed earlier; and 2) very high attrition rates and thus high risks in new product development. Regardless of the technological possibilities of theranostics and personalized medicine, these determinants remain, and have to be met in any “new” business model.
Perhaps a more realistic opportunity for short-term exploitation comprises industry convergence with the conventional and functional foods sector. Upcoming markets such as the functional food market [56,57] and medical nutrition market [38] may yield opportunities for biopharmaceutical companies. As Kickbusch & Payne (2003) [57] rightfully state, the line between foods, dietary supplements, and pharmaceutical products is becoming more difficult to draw. Weenen et al. (2013b) [32] explain the differences and overlap between these product categories as well as convergence opportunities towards pharmanutrition. Another undeniable trend is the awareness and demand amongst end-users for increased functionality of foods in the context of healthy lifestyles including “healthy-ageing”. In addition, wellness, health, and disease prevention, as opposed to curing, is increasingly stimulated by employers, as healthier employees reduce health insurance costs [56]. Innovation and technological development regarding pharmanutrition create an opportunity for incumbent pharmaceutical firms. According to Weenen et al. (2013) [38], the medical nutrition industry currently finds itself in the growth phase (Figure 2) and pharmanutrition is an area filled with opportunities for enhancing discovery, technological, and development competencies [32,58]. Further in-depth research is required to examine options and methods of capitalizing on these opportunities.
In conclusion, we show that biotechnological innovation with respect to the first two biotechnologies has saturated. By three independent parameters we have identified the growth, maturity and saturation stages, internally validating the S-curve for these biotechnologies (Figure 4). A biotechnological limit might imply several, somewhat pessimistic, scenarios for future biopharmaceutical productivity. However, whether it involves the generation of a new business model to fully capture the value of following biotechnologies, or converging with other markets to serve health-oriented consumers, there seem to be several opportunities for biopharmaceutical companies to explore.
6. Acknowledgements
We are thankful for support from the Athena Institute at the VU University led by Prof. Dr. J. Bunders. We are grateful for the contribution, through discussions, with Linda van der Burgwal, MSc. and Esther Pronker, Ph.D. In addition, we would like to thank Boudewijn Drost for his contribution regarding data collection and ttopstart B.V. for providing access to certain databases. All authors have declared to have read and approved this final manuscript.
REFERENCES
- N. L. Sharma and S. Goswami, “Dispersed Knowledge Centres—A New Paradigm for the Pharmaceutical Industry,” Business Strategy Series, Vol. 10, No. 4, 2009, pp. 209-220. doi:10.1108/17515630910976352
- F. Malerba and L. Orsenigo, “Innovation and Market Structure in the Dynamics of the Pharmaceutical Industry and Biotechnology: Towards a History-Friendly Model,” Industrial and Corporate Change, Vol. 11, No. 4, 2004, pp. 667-703. doi:10.1093/icc/11.4.667
- J. J. MacQuitty, “Impact of Biotechnology on the Chemical Industry,” In: M. Phillips, S. P. Shoemaker, R. D. Middlekauff and R. M. Ottenbrite, Eds., The Impact of Chemistry on Biotechnology, American Chemical Society, Vol. 362, 1988, pp. 11-29. doi:10.1021/bk-1988-0362.ch002
- J. A. Halperin, “Challenge, Opportunity, Promise, and Risk: The Pharmaceutical Industry Moving toward the 21st Century,” Drug Information Journal, Vol. 22, No. 1, 1988, pp. 25-32.
- S. Wright, “Recombinant DNA Technology and Its Social Transformation, 1972-1982,” The University of Chicago Press, Osiris, Vol. 2, No. 2, 1986, pp. 303-360.
- P. Nightingale and P. Martin, “The Myth of the Biotech Revolution,” Trends in Biotechnology, Vol. 22, No. 11, 2004, pp. 564-569. doi:10.1016/j.tibtech.2004.09.010
- J. Drews, “Innovation Deficit Revisited: Reflections on the Productivity of Pharmaceutical R&D,” Drug Discovery Today, Vol. 3, No. 11, 1998, pp. 491-494. doi:10.1016/S1359-6446(98)01252-5
- L. M. McNamee and F. D. Ledley, “Patterns of Technological Innovation in Biotech,” Nature Biotechnology, Vol. 30, No. 10, 2012, pp. 937-943. doi:10.1038/nbt.2389
- J. Drews and S. Ryser, “Innovation Deficit in the Pharmaceutical Industry,” Drug Information Journal, Vol. 30, No. 1, 1996, pp. 97-108.
- T. T. Ashburn and K. B. Thor, “Drug Repositioning: Identifying and Developing New Uses for Existing Drugs,” Nature Reviews Drug Discovery, Vol. 3, No. 8, 2004, pp. 673-683. doi:10.1038/nrd1468
- O. Gassman and G. Reepmeyer, “Organizing Pharmaceutical Innovation: From Science-based Knowledge Creators to Drug-Oriented Knowledge Brokers,” Creativity and Innovation Management, Vol. 14, No. 3, 2005, pp. 233-245. doi:10.1111/j.1467-8691.2005.00344.x
- E. S. Pronker, “Innovation Paradox in Vaccine Target Selection,” Ph.D. Dissertation, Erasmus University, Rotterdam, 2013.
- M. Kessel, “The Problems with Today’s Pharmaceutical Business—An Outsider’s View,” Nature Biotechnology, Vol. 29, No. 1, 2011, pp. 27-33. doi:10.1038/nbt.1748
- A. C. Cheng and C. Y. Chen, “The Technology Forecasting of New Materials: The Example of Nanosized Ceramic Powders,” Romanian Journal of Economic Forecasting, Vol. 5, No. 4, 2008, pp. 88-110.
- Y. H. Chen, C. Y. Chen and S. C. Lee, “Technology Forecasting and Patent Strategy of Hydrogen Energy and Fuel Cell Technologies,” International Journal of Hydrogen Energy, Vol. 36, No. 12, 2011, pp. 6957-6969. doi:10.1016/j.ijhydene.2011.03.063
- D. A. Jackson, R. H. Symons and P. Berg, “Biochemical Method for Inserting New Genetic Information into DNA of Simian Virus 40: Circular SV40 DNA Molecules Containing Lambda Phage Genes and the Galactose Operon of Escherichia coli,” Proceedings of the National Academy of Sciences, Vol. 69, No. 10, 1972, pp. 2904-2909. doi:10.1073/pnas.69.10.2904
- P. Lobban and A. Kaiser, “Enzymatic End-to-End Joining of DNA Molecules,” Journal of Molecular Biology, Vol. 78, No. 3, 1973, pp. 453-471. doi:10.1016/0022-2836(73)90468-3
- S. Cohen, A. Chang, H. Boyer and R. Helling, “Construction of Biologically Functional Bacterial Plasmids in Vitro,” Proceedings of the National Academy of Sciences of the United States of America, Vol. 70, No. 11, 1973, pp. 3240-3244. doi:10.1073/pnas.70.11.3240
- S. Hughes, “Making Dollars Out of DNA. The First Major Patent in Biotechnology and the Commercialization of Molecular Biology, 1974-1980,” Isis, Vol. 92, No. 3, 2001, pp. 541-575. doi:10.1086/385281
- L. J. Gershell and J. H. Atkins, “A Brief History of Novel Drug Discovery Technologies,” Nature Reviews Drug Discovery, Vol. 2, No. 4, 2003, pp. 321-327. doi:10.1038/nrd1064
- C. Rhodes, “The History of the Biotechnology Revolution. International Governance of Biotechnology: Needs, Problems, and Potential,” Bloomsbury Publishing, 2010. doi:10.5040/9781849661812
- J. Reichert and A. Pavlou, “Monoclonal Antibodies Market,” Nature Reviews Drug Discovery, Vol. 3, No. 5, 2004, pp. 383-384. doi:10.1038/nrd1386
- R. Buelow and W. van Schooten, “The Future of Antibody Therapy,” Ernst Schering Foundation Symposium Proceedings, Vol. 4, 2007, pp. 83-106.
- H. P. Rang, M. M. Dale, J. M. Ritter and P. K. Moore, “Pharmacology,” Churchill Livingstone, Edinburgh, 2003.
- G. P. Adams and L. M. Weiner, “Monoclonal Antibody Therapy of Cancer,” Nature Biotechnology, Vol. 23, No. 9, 2005, pp. 1147-1157. doi:10.1038/nbt1137
- J. A. DiMasi and H. G. Grabowski, “The Cost of Biopharmaceutical R&D: Is Biotech Different?” Managerial and Decision Economics, Vol. 28, No. 4-5, 2007, pp. 469-479. doi:10.1002/mde.1360
- R. Garcia and R. Calantone, “A Critical Look at Technological Innovation Typology and Innovativeness Terminology: A Literature Review,” Journal of Product Innovation Management, Vol. 19, No. 2, 2002, pp. 110-132. doi:10.1111/1540-5885.1920110
- J. A. DiMasi, R. W. Hansen and H. G. Grabowski, “The Price of Innovation: New Estimates of Drug Development Costs,” Journal of Health Economics, Vol. 22, No. 2, 2003, pp. 151-186. doi:10.1016/S0167-6296(02)00126-1
- E. S. Pronker, T. C. Weenen, H. R. Commandeur, A. D. M. E. Osterhaus and H. J. H. M. Claassen, “The Gold Industry Standard for Risk and Cost of Drug and Vaccine Development Revisited,” Vaccine, Vol. 29, No. 35, 2011, pp. 5846-5849. doi:10.1016/j.vaccine.2011.06.051
- W. W. McCutchen and P. M. Swamidass, “Motivations for Strategic Alliances in the Pharmaceutical/Biotech Industry: Some New Findings,” The Journal of High Technology Management Research, Vol. 15, No. 2, 2004, pp. 197-214. doi:10.1016/j.hitech.2004.03.003
- P. M. Danzon, S. Nicholson and N. S. Pereira, “Productivity in Pharmaceutical-Biotechnology R&D: The Role of Experience and Alliances,” Journal of Health Economics, Vol. 24, No. 2, 2005, pp. 317-339. doi:10.1016/j.jhealeco.2004.09.006
- T. C. Weenen, E. S. Pronker, K. D. S. Fernald, E. Claassen and H. Commandeur, “Bridging a Pharma-Like Innovation Gap in Medical Nutrition,” 2013.
- L. A. Hall and S. Bagchi-Sen, “A Study of R&D, Innovation, and Business Performance in the Canadian Biotechnology Industry,” Technovation, Vol. 22, No. 4, 2002, pp. 231-244. doi:10.1016/S0166-4972(01)00016-5
- A. Phene, K. Fladmoe-Lindquist and L. Marsh, “Breakthrough Innovations in the US Biotechnology Industry: The Effects of Technological Space and Geographic Origin,” Strategic Management Journal, Vol. 27, No. 4, 2006, pp. 369-388. doi:10.1002/smj.522
- S. G. Green, M. B. Gavin and L. Aiman-Smith, “Assessing a Multidimensional Measure of Radical Technological Innovation,” Engineering Management, IEEE, Vol. 42, No. 3, 1995, pp. 203-214. doi:10.1109/17.403738
- K. B. Dahlin and D. M. Behrens, “When Is an Invention Really Radical? Defining and Measuring Technological Radicalness,” Research Policy, Vol. 34, No. 5, 2005, pp. 717-737. doi:10.1016/j.respol.2005.03.009
- H. Ernst, “The Use of Patent for Technological Forecasting: The Diffusion of CNC-Technology in the Machine Tool Industry,” Small Business Economics, Vol. 9, No. 4, 1997, pp. 361-381. doi:10.1023/A:1007921808138
- T. C. Weenen, E. S. Pronker, H. R. Commandeur and E. Claassen, “Patenting in the European Medical Nutrition Industry: Trends, Opportunities & Strategies,” PharmaNutrition, Vol. 1, No. 1, 2013, pp. 13-21. doi:10.1016/j.phanu.2012.10.003
- C. J. Fall, A. Torcsvari, K. Benzineb and G. Karetka, “Automated Categorization in the International Patent Classification,” ACM SIGIR Forum, Vol. 37, No. 1, 2003, pp. 10-25.
- L. Falciola, “Searching Biotechnology Information: A Case Study,” World Patent Information, Vol. 31, No. 1, 2009, pp. 36-47. doi:10.1016/j.wpi.2008.05.006
- J. Hagedoorn and M. Cloodt, “Measuring Innovative Performance: Is There an Advantage in Using Multiple Indicators?” Research Policy, Vol. 32, No. 8, 2003, pp. 1365-1379. doi:10.1016/S0048-7333(02)00137-3
- M. Fallah, E. Fishman and R. Reilly, “Forward Patent Citations as Predictive Measures for Diffusion of Emerging Technologies,” Portland International Conference on Management of Engineering & Technology, Portland, 2-6 August 2009, pp. 420-427.
- F. M. Tseng, C. H. Hsieh, Y. N. Peng and Y. W. Chu, “Using Patent Data to Analyze Trends and the Technological Strategies of the Amorphous Silicon Thin-Film Solar Cell Industry,” Technological Forecasting and Social Change, Vol. 78, No. 2, 2011, pp. 332-345. doi:10.1016/j.techfore.2010.10.010
- J. Michel and B. Bettels, “Patent Citation Analysis. A Closer Look at the Basic Input Data from Patent Search Reports,” Scientometrics, Vol. 51, No. 1, 2001, pp. 185- 201. doi:10.1023/A:1010577030871
- R. Haupt, M. Kloyer and M. Lange, “Patent Indicators for the Technology Life Cycle Development,” Research Policy, Vol. 36, No. 3, 2007, pp. 387-398. doi:10.1016/j.respol.2006.12.004
- E. M. Rogers, “Diffusion of Innovations,” Free Press, Glencoe, 1962.
- I. M. Cockburn, “The Changing Structure of the Pharmaceutical Industry,” Health Affairs, Vol. 23, No. 1, 2004, pp. 10-22. doi:10.1377/hlthaff.23.1.10
- KPMG, “Future Pharma: Five Strategies to Accelerate the Transformation of the Pharmaceutical Industry by 2020,” 2011. http://www.kpmg.com/Global/en/IssuesAndInsights/ArticlesPublications/Documents/future-pharma.pdf
- European Federation of Pharmaceutical Industries and Associations, “The Pharmaceutical Industry in Figures, Key Data 2012,” 2012. http://www.efpia.eu/uploads/Modules/Documents/efpia_figures_2012_final-20120622-003-en-v1.pdf
- A. Osterwalde and Y. Pigneur, “Business Model Generation,” John Wiley & Sons Inc., Hoboken, 2010.
- P. Asthana, “Jumping the Technology S-Curve,” Spectrum, IEEE, Vol. 32, No. 6, 1995, pp. 49-54.
- A. Sood and G. J. Tellis, “Technological Evolution and Radical Innovation,” Journal of Marketing, Vol. 69, No. 3, 2005, pp. 152-168. doi:10.1509/jmkg.69.3.152.66361
- L. J. Lesko, “Personalized Medicine: Elusive Dream or Imminent Reality?” Clinical Pharmacology & Therapeutics, Vol. 81, No. 6, 2007, pp. 807-816. doi:10.1038/sj.clpt.6100204
- L. P. Garrison and M. F. Austin, “Linking Pharmacogenetics-Based Diagnostics and Drugs for Personalized Medicine,” Health Affairs, Vol. 25, No. 5, 2006, pp. 1281- 1290. doi:10.1377/hlthaff.25.5.1281
- G. S. Ginsburg and H. F. Willard, “Genomic and Personalized Medicine: Foundations and Applications,” Translational Research: The Journal of Laboratory and Clinical Medicine, Vol. 154, No. 6, 2009, p. 277. doi:10.1016/j.trsl.2009.09.005
- P. Z. Pilzer, “The New Wellness Revolution,” 2nd Edition, John Wiley & Sons, Inc., Hoboken, 2007.
- I. Kickbusch and L. Payne, “Twenty-First Century Health Promotion: The Public Health Revolution Meets the Wellness Revolution,” Health Promotion International, Vol. 18, No. 4, 2003, pp. 275-278. doi:10.1093/heapro/dag418
- N. M. Wijnberg, “Classification Systems and Selection Systems: The Risks of Radical Innovation and Category Spanning,” Scandinavian Journal of Management, Vol. 27, No. 3, 2011, pp. 297-306. doi:10.1016/j.scaman.2011.04.001
NOTES
*All authors state having no conflict of interest nor was any funding provided for the conduction of this study.
#Corresponding author.
1www.acclaimip.com
2www.wipo.int
3www.uspto.gov
4www.thomsonreuters.com
5www.fda.gov
6www.medtrack.com
7The forward citations are corrected for age because more recent patents would normally have less forward citations.
8p < 0.01.
9www.imshealth.com