Technology and Investment
Vol.2 No.4(2011), Article ID:8358,17 pages DOI:10.4236/ti.2011.24027
Corporate Reputation and the Commercialization of Innovation: Does Reputation Match Reality, and Does Innovation Matter?
1College of Business, Illinois State University, Normal, USA
2Eller College of Management, University of Arizona, Tucson, USA
3Nance College of Business, Cleveland State University, Cleveland, USA
E-mail: avimanyu.datta@gmail.com, adatta@ilstu.edu
Received July 28, 2011; revised August 28, 2011; accepted September 6, 2011
Keywords: R & D, Patents, Technology, Investment, Product Releases, Commercialization of Innovation, Revenues
Abstract
We seek to understand which firms excel at innovation and commercialization. In doing so, we first ranked companies that performed well on four measures: spending on R & D Spending (2006), Patenting (cumulative 2006 and 2007) and Commercialization of Innovations (cumulative for 2007 and 2008). We then compared our rankings with that of Business Week/Boston Consulting Group’s annual ranking of the most innovative companies, which primarily is based on reputation measured as perceptions among sitting CEO’s. Somewhat surprisingly, there is not complete overlap between our more quantitative ranking and the one done by Business Week/BCG, and we highlight the reasons why. Second, we tested the relationship among R & D, patents, and product releases and the role they play in driving revenue. We found that although innovation and commercialization are different, they need to be considered together, that perceptions and reality in this realm often do not match, and that joint innovation and commercialization activities can influence the bottom line.
1. Introduction
To survive firms must continue to innovate and successfully commercialize these innovations, whether by creating significant improvements to existing products in order to maintain or grow market share, or by creating entirely new products that potentially drive new markets [1-4]. With increasing globalization, environmental complexity, economic uncertainty, intense competition and pressure to perform that ensues, means that the need to bring innovations to market successfully is greater than ever. As a result, research on and rankings of the world’s most innovative companies, and how they achieve this status, is useful and timely in a variety of ways. Despite the recognition of the importance of commercialization of innovations within the general management literature, [1-4], the research activities within the reputation literature have generally ignored innovation and commercialization.
Further, popular rankings of firms based on their innovative capabilities has been done primarily using measures based on the perceptions of CEO’s rather than using measures of definitive activities and hard outcomes within firms. We feel there is need for a better understanding of the role that innovation and commercialization play in firm success.
2. Research on, and Rankings of, Firms That Are Good at Innovation
A number of books in the popular business press have been written in recent years with prescriptions for how firms can be innovative. They tend to be based more on the qualitative, anecdotal experiences that the authors have had with relatively limited sets of companies. Nonetheless, they are helpful insofar they offer useful suggestions for what might work and what might not work in specific types of companies. Beyond that, there is a need for research that systematically looks across many firms and helps us to understand with greater confidence exactly how the good firms innovate. Toward this end, Business Week, together with the Boston Consulting Group, began publishing their annual ranking of the top innovative firms. Their ranking looks across a wide variety of firms and is based on a survey of sitting executives and who they perceive to be the most innovative firms. Their ranking thus tells us who has the best reputation for innovation among active CEOs.
3. What Does It Mean to Be an Innovative Company?
We seek to build on existing research and understand which firms are best at innovating, and why. More to the point, we seek to understand why some firms are better at commercializing innovations than are others, because a firm can be innovative and not necessarily be successful. There exist a set of specific characteristics within firms, together with a set of environmental factors that serve to either enable or inhibit firms in their efforts to commercialize innovation. Below we highlight a shortlist of those factors that we believe are the best indicators of whether or not a firm is successfully commercializing innovation; that is, what are they actually doing that helps them continually to commercialize innovations. Firms that are the best at commercializing innovation over time are very good at maximizing their innovation chain. We define the innovation chain as the sequence of events in a firm that include spending on research and development, protecting intellectual property (e.g., patent protection), launching new products and/or services, and consequently performing well financially.
3.1. The Innovation Chain (Figure 1)
Firms must continue to successfully innovate and commercialize these innovations whether by creating new products and services that drive new markets or by creating innovations that enable them to hold on to niches in existing markets [1-4]. It is often a mistake to assume that innovation is limited to product innovation driven by R & D. Other means of innovation, for example, include firms improving efficiency by continually looking for ways to run themselves better, which has been defined by others as continuous process innovation. Similarly, firms can “acquire” innovation via mergers, acquisitions, and joint ventures with other firms that possess innovative products, services, technologies, and other forms of intellectual property. This can be particularly useful in a situation where a firm needs to be in a specific market quickly and does not have sufficient time to develop its own capabilities and corresponding products for that new market opportunity. All these are examples of ways that a firm can be innovative, but they do not necessarily represent the extent to which a firm is successful at continually commercializing innovations over time.
Similarly, the economic conditions within which a firm operates can influence a firm’s ability to innovate and commercialize. Poor economic conditions, for example, may make it difficult to acquire the capital necessary to develop new products, or may cause customers to choose to hold back on their purchases and not buy the innovative new products that companies are producing. We believe that these macro-level economic factors are important, but they do not tell us about a firm’s core innovation chain and related capabilities. We therefore hold them constant.
3.1.1. Commercialization
The commercialization of innovations involves the act of bringing innovations and to market [2,5-9]. Past research has also posited that successful commercialization of innovation is necessary in order for firms to be competitive [2,10], and is necessary to advance the economy at
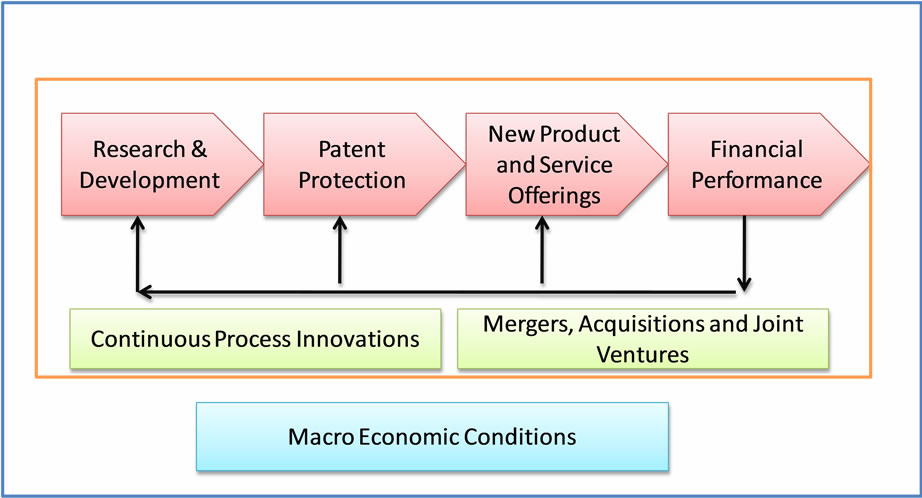
Figure 1. Innovation chain.
large [1,3,4,11]. “New product introduction is an important measure of innovativeness, because it indicates the potential commercial significance of a firm’s innovation activities” [12,13].
Innovation cannot influence firm performance until the ideas have been introduced to the market [12]. In other words, an innovation “ideated” in a firm can only become a successful innovation if it has a marketable use [14]. Past research has shown that innovation ideation does not always automatically lead to innovation commercialization [15,16]. Firms depend on products and services developed three to five years ago for large portions of their current sales and as a result can find themselves aiming at an elusive target that is years in the future as they try to compete in a marketplace today [2,17].
Most single innovations can be duplicated and so just being innovative does not guarantee a sustained competitive advantage. However, innovations are harder to imitate if they are successfully commercialized followed by successive innovations in the area. While the literature links firm innovations with firm performance, we propose that innovation in its solitary state cannot achieve an advantage that is sustainable. Rather, it is commercialization followed by successive evolutionary innovation that leads to sustained competitive advantage for a firm.
3.1.2. R & D Activities
The importance of R & D, for both internally developed and capitalizing on externally acquired innovations, is well established and well understood. Beyond that research on what R & D means to the firm is wide ranging. For example, firms are continuously looking into ways to reduce R & D costs, while not reducing the R & D activities [18], and relatedly, universities impact industrial R & D through several channels [19]. A firm’s geographic location, alliances with other institutions and organizations and R & D expenditures are representative of knowledge flows, while products in the pipeline, firm citations and patents are indicative of knowledge stocks [20]. Dutta & Weiss (1997) linked technological innovativeness with partnership agreements. Their sample of technologically innovative companies were proxied from companies that invested heavily in R & D [21]. R & D spillovers are, potentially, a major source of innovation [22]. During times of austerity firms must tighten their belts, subject nascent product-development programs to rigorous screening, and train R & D staffers to think in business terms so they will be better able to decide whether an idea for a product or service is worth pursuing in the first place [23]. International diversification is also positively related to R & D intensity [24]. Based on a study of 137 Japanese firms, a positive link was found between R & D and a firm’s inventive activities [25]. Firms often conduct international R & D to tap into knowledge bases that reside in foreign countries [26]. Penner-Hahn and Shaver argued that in order to benefit from international R & D investments, firms must already possess research capabilities in underlying or complementary technologies. Also, R & D intensity is a positive moderator between exploration and exploitation and environmental conditions [27]. Finally, stage of the R & D process moderates the relationship between the wealth effects, technology, and market variables [5].
3.1.3. Patenting
Patents are physical, codifiable manifestations of innovative ideas that embody the knowledge of one or several employees [20]. Patents often have been used as a proxy for innovations. It has been measured as: patents as inventions [20,28,29], patents as a solution to a technical problem [12], patents as firm knowledge [20,29], patents as firm technological knowledge [14], patents as firm technological innovation [21], and patents as innovative output [26].
Patents are seen as a reliable indicator of a firm’s intermediate innovation-output [26]. Consequently, they have been extensively used in several empirical studies in strategy and economics as a means to capture a firm’s intermediate innovative output and substantiate a firm’s innovation ideation. Patents have been used as a proxy for invention outcomes, which has been modeled to precede innovation commercialization [2,28]. Patents have been used as an indicator to measure firm’s new knowledge creation efforts and its impact on future innovative outcomes [14]. They have also been used to measure the stock of innovative knowledge held by a firm [18,20]. In addition, patents have been used to reflect production of ideas at a country level [30,31].
Knowledge embodied in patents represents significant and important innovations that can be commercialized into new products or services with potential financial returns. Patents allow us to better capture the outcome, effort and activities of innovative knowledge creation, and they increase the potential returns of commercialization. Thus, patents are widely accepted measures by policy makers and analysts [32] in terms of technology strategy and competitive analysis.
3.1.4. Financial Performance
Briefly, financial performance has been measured as accounting or market based measures. For example some of the firm performance measures used for R & D, patents, and product launches were, return on assets, return on sales, stock return, sales growth or profit margin, revenue, and market value [20,24,28,33]. Market measures also have included, cumulative abnormal-return [34].
4. Methods
4.1. Data Collection
Guided by prior research, as embedded in our visualization of the innovation chain, we gathered data on: 1) corporate spending on research and development, 2) protection of intellectual property, 3) new product and/or service launches, and 4) financial performance, and we chose for this initial analysis simply to look at revenues given that they are more an indicator of consumers’ demand and desire for a particular firm’s products, as opposed to a measure such as profits that would also indicate a firm’s capability to manage itself well. We were interested in determining not only which firms are the best within each category but, more importantly, which of them are the best overall, which we take as a proxy for successful commercialization of innovation. While we believe that there are other factors that influence a firm’s ability to commercialize innovation, such as continuous process innovation, mergers, acquisitions, joint ventures, and macro economic conditions, we focused our analysis on the core processes that we believe comprise the innovation chain. We did not restrict ourselves to only the Fortune 1000-firms, thus our list includes foreign firms operating in US.
For R & D we collected data on overall spending of firms on research and development in U.S. dollars for the year 2007 from Fortune’s annual data on R & D spending. We collected data on revenues for American corporations from the Fortune 1000 lists for the period 2008. For organizations outside the US we created a list of those international firms that do well on our three prior measures and then used other sources (such as their own performance reports) to ascertain their annual sales revenues.
For patents we collected data from the U.S. Patent Office Web site that shows all submissions for patents from companies during the years 2006 and 2007. For product launches (commercialization of innovations) we collected data on product launches directly from corporate Web sites where we found formal announcements such as dated press releases. We agreed on a protocol for capturing these announcements, and then one of our three authors captured the announcements and a second author checked them for accuracy and consistency. We tracked formal press releases announcing the release of new products and/or services (including significant product/ service enhancements) for the year 2007, and 2008. We aggregated the number of new products and services introduced to the market by a firm over two-periods from 2007 (considering a one-year lag to patent applications) to measure commercialized innovation.
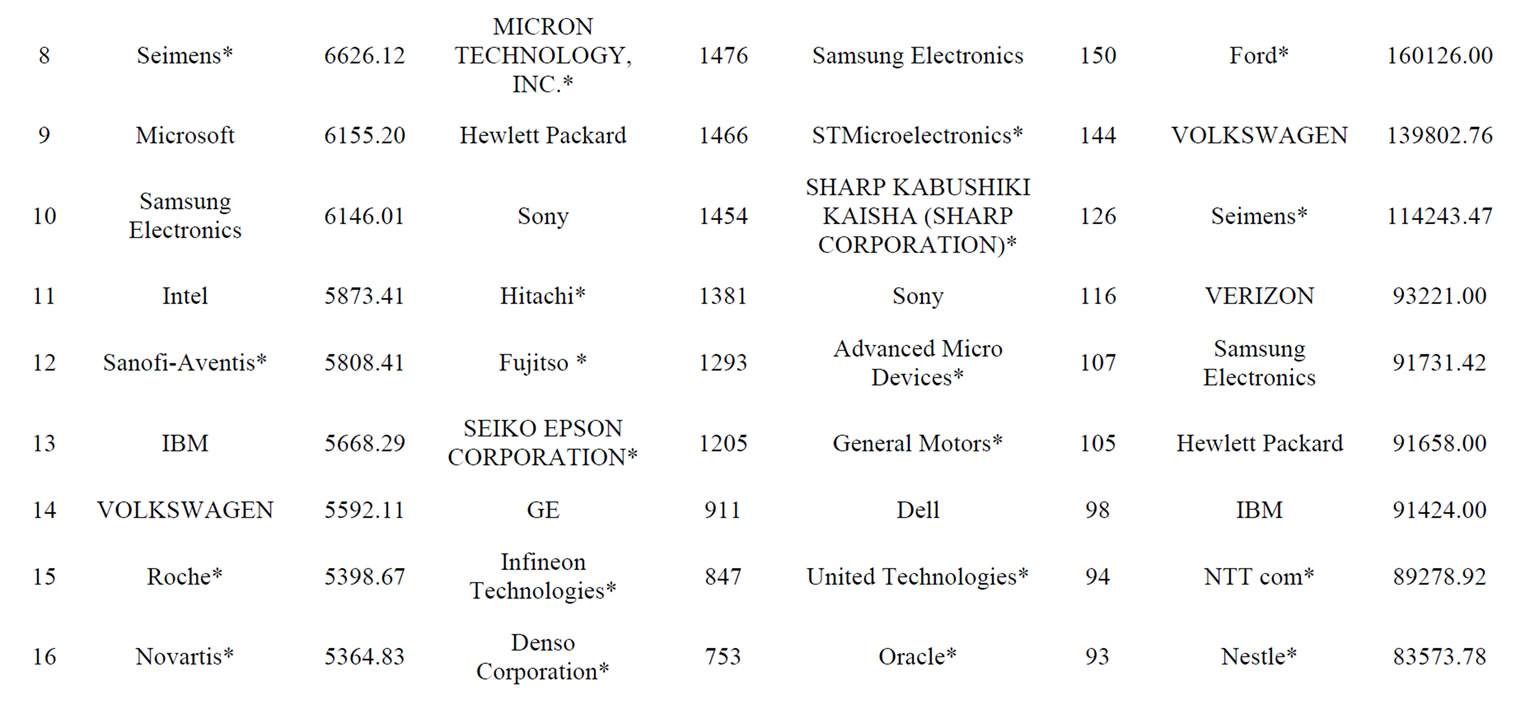
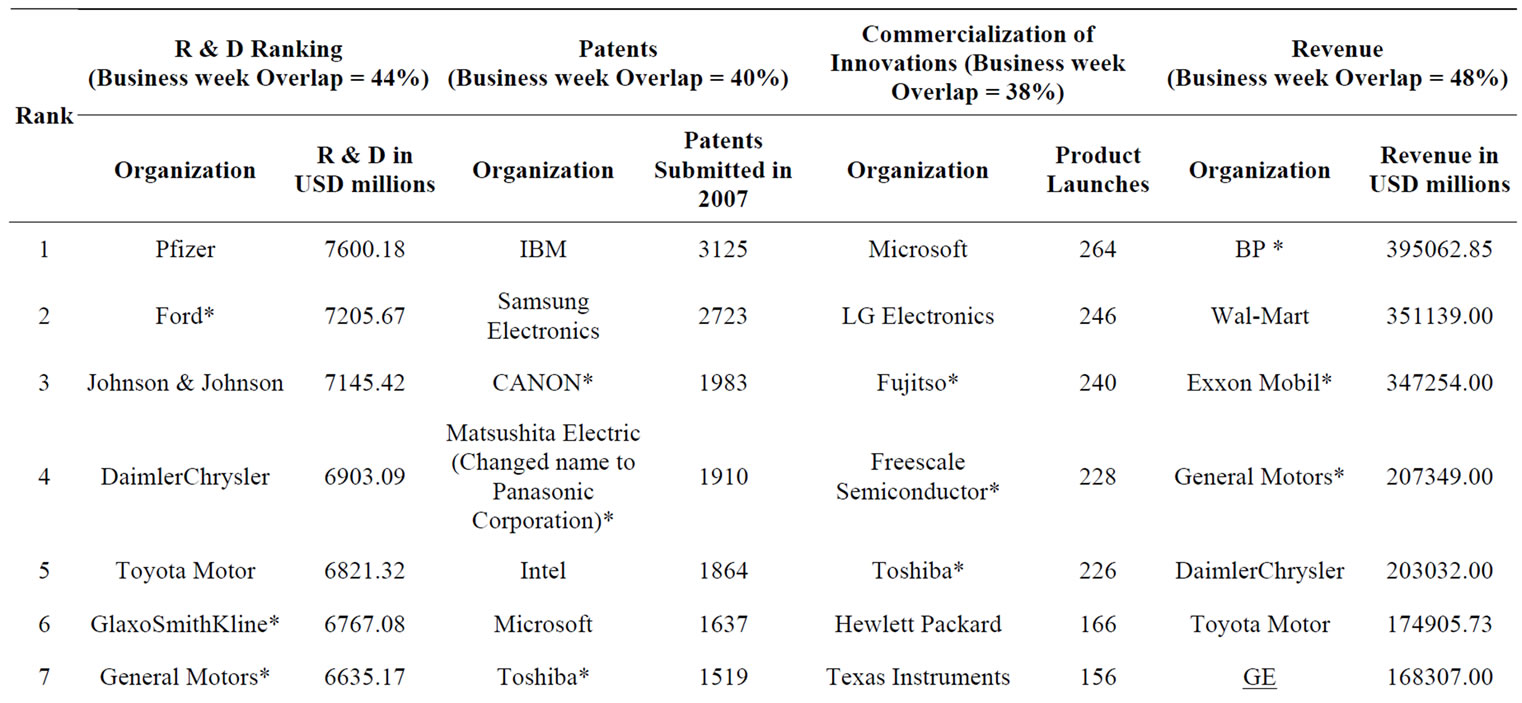
Appendix 1 shows the data we collected within each of the four categories and the overlap with the Business Week/BCG rankings.
4.2. Statistical Tests
For the purpose of this paper we needed to see the compactness among three of the three dimensions of innovativeness: R & D spending (2006), Patenting (cumulative 2006 and 2007) and Commercialization of Innovations (Cumulative for 2007 and 2008). We also needed to see the impact of those three variables on Revenues for year 2008, 2009 and 2010. We thus needed to estimate a system of equations. In such cases, two stage least squares regression (2SLS) and Path Modeling (a variant of Structural Equation model) are both feasible approaches to account for the potential for correlation in the errors across estimated equations [35]. We used Structural Equation Modeling (SEM) with no latent variables to test our research model. Compared to a 2SLS, path modeling provides a better approach to test our model by allowing us to better assess the simultaneous effect of all the variables.
5. Findings
5.1. Statistical Tests
Figure 2 and Table 1 show the results of the statistical analysis. R & D explains variance in number of patents (R2 = 0.085; β = 0.292; p < 0.05) and commercialized innovations (R2 = 0.025; β = 0.183; p < 0.05). Further, as expected the number of patents also explains variance on commercialized innovations (R2 = 0.025; β = 0.183; p < 0.05). Thus, also as expected the three of the four dimensions of innovations were linked.
The relation of these three variables (R & D, Patents, and commercialized innovations (CI) with respect to revenues is more complicated. The collective impact of R & D, Patents, and CI on revenues for the years, 2008, 2009 and 2010 are R2 = 0.350 (p < 0.001), R2 = 0.248 (p < 0.001), and R2 = 0.266 (p < 0.001), respectively. While the three variables collectively explain variance in revenue, the paths from Patents and CI to revenue remained non-significant. An interesting observation is that as we moved revenues from 2008 through 2010, while the collective explanatory power decreased, the explanatory power of CI and Patents on Revenues increased. For instance the path coefficients from patents to revenue, despite remaining non-significant, increased from β = 0.019 in 2008 to β = 0.020 in 2009 to β = 0.132 in 2010. Similarly, the path coefficients from CI to revenue increased from β = 0.075 in 2008 to β = 0.127 in 2009 to β = 0.135 in 2010. An explanation for this is that R & D
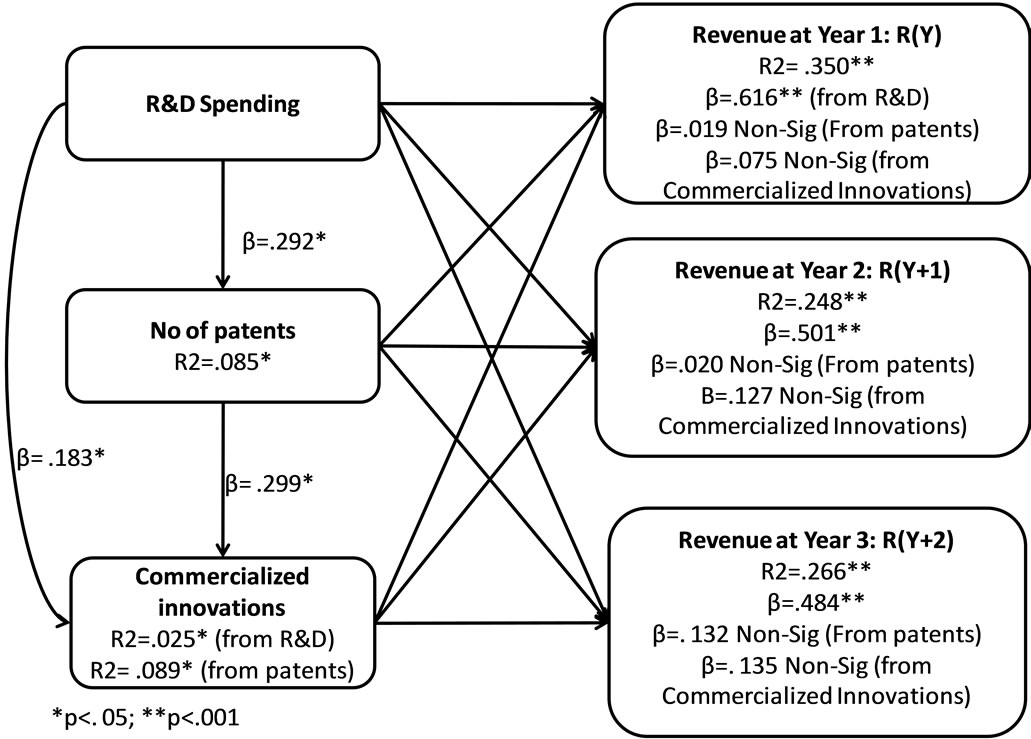
Figure 2. Variance model with statistical results.
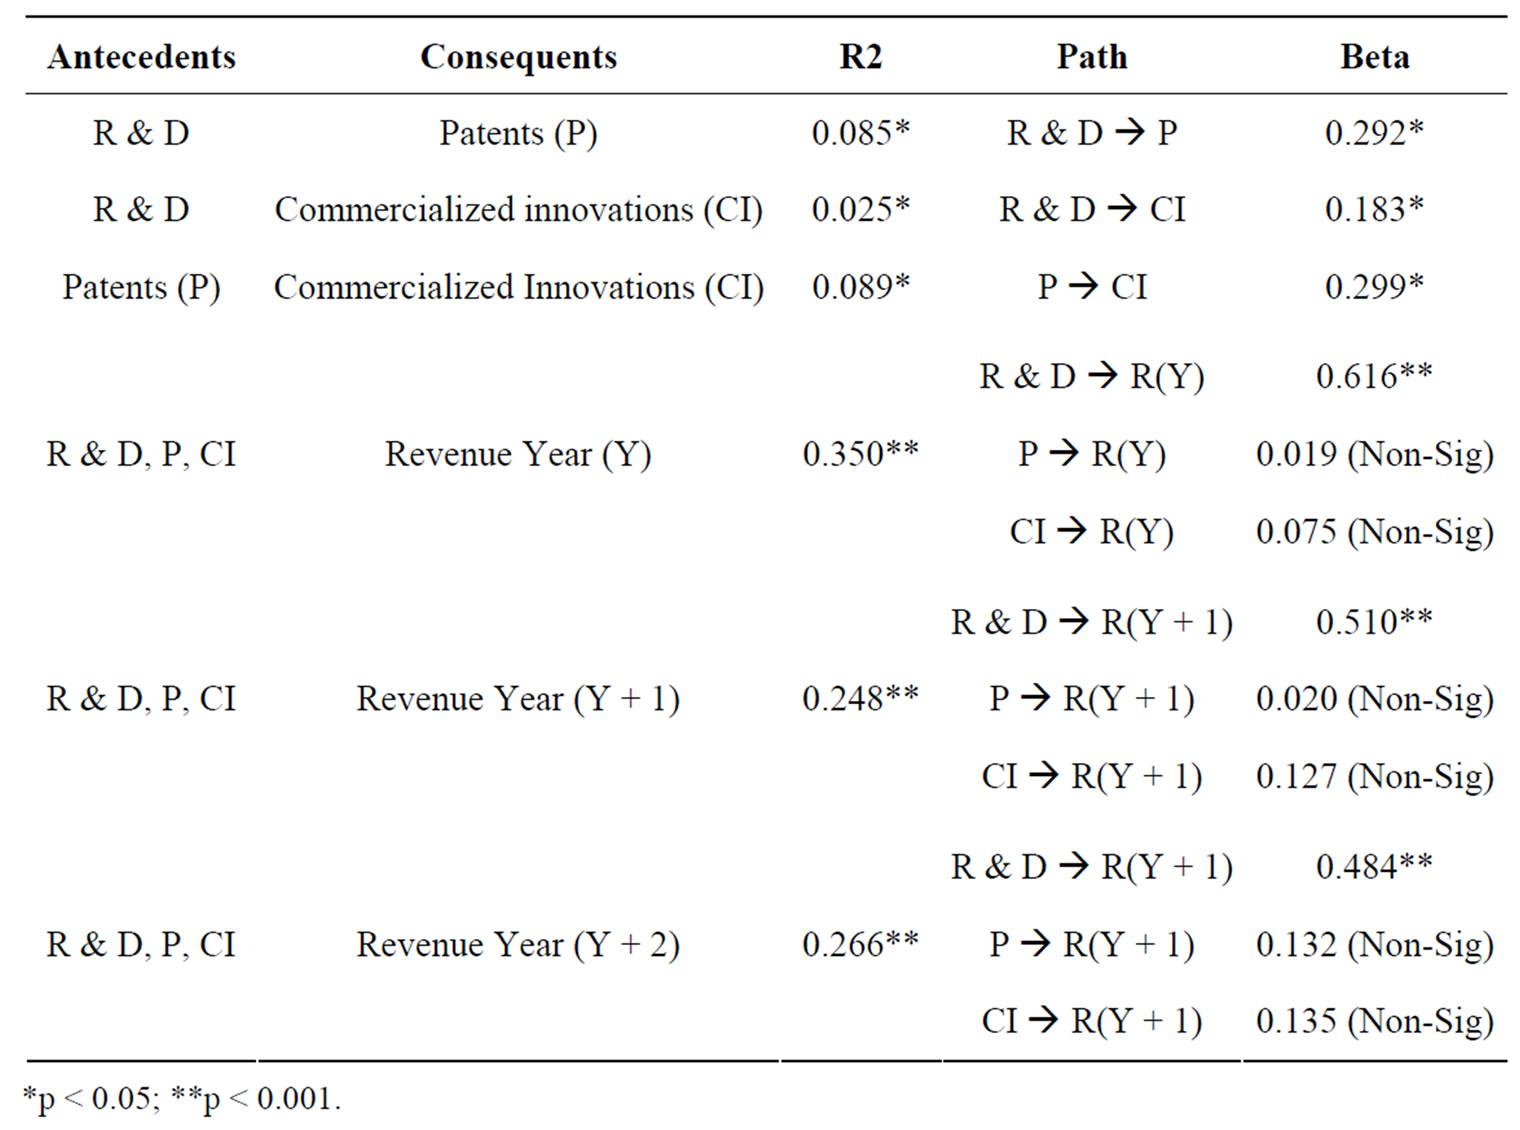
Table 1. Results of the regressions.
and revenues are highly correlated and there is a lag time from R & D spending to patents and from patents to commercialized products. Also, per extant research there is a lag time between product release and diffusion of the product into the market [36]. These lag times impact the effect of patents and subsequently CI on revenues. Although insignificant early on, the impact of patents and CI on revenues increases in subsequent years when products diffuse in the market.
5.2. A Deeper Look at the Most Innovative Firms
5.2.1. Who Are Spending the Most on R & D?
The top ten R & D spenders were, in order: Pfizer, Ford, Johnson & Johnson, DaimlerChrysler, Toyota Motor, GlaxoSmithKline, General Motors, Seimens, Microsoft, and Samsung Electronics. These firms represent a variety of industries, though one industry (automobile manufacturing) has four of the top ten spots. These ten firms also spent in excess of $68 billion on research and development that year. Surprisingly, there is only a 44% overlap between this list of top R & D spenders and the BusinessWeek/BCG list of top innovators. Some of the top R & D spenders not ranked by BusinessWeek were, Ericsson (now Sony Ericsson), Matsushita Electric (now Panasonic Corporation), Texas Instruments, Nissan, Hitachi, Renault, Sun Microsystems, and Toshiba. Apparently, heavy spending on R & D does not necessarily translate perfectly into perceptions among sitting CEOs that a company is a top innovator.
5.2.2. Who Had the Most Patent Submissions?
The top ten firms for patent submissions for that period were IBM, Samsung Electronics, Canon, Matsushita Electric (Panasonic Corporation), Intel, Microsoft, Toshiba, Micron Technology, Hewlett Packard, and Sony, respectively. These top ten firms submitted applications for over 19,000 patents during that time period. IBM alone submitted over 3000 patents. This list clearly is dominated by electronics manufacturers. As with R & D spending, we found a 40% overlap with the Business Week/BCG ranking on the dimension of patent protection. Some of the prominent organizations not present in the ranking by BusinessWeek/BCG were Canon, Matsushita, Micron Technology, Hitachi, and Texas Instruments.
5.2.3. Who Had the Most Product Launches?
The top ten for firms releasing new products and/or services for that time period includes Microsoft, LG Electronics, Fujitso, Freescale Semiconductor, Toshiba, Hewlett Packard, Texas Instruments, Samsung Electronics, STMicroelectronics, and Sharp Kabushiki Kaisha (Sharp Corporation), respectively. These top ten firms formally announced the release of over 1900 new products and/or services during that time perioda high number considering that these came from only ten firms. As with patent submissions this list is dominated by electronics manufacturers.
There is also only a 38% overlap between our list on new product/service launches and that of BusinessWeek/ BCG. Among the more prominent firms on our list that are not ranked by BusinessWeek/BCG are, Fujitso, Toshiba, Sharp, Oracle, Dow Chemical, Sun Microsystems, Seiko Epson Corporation, Matsushita, and GlaxoSmithKline. Given that among the three measures we’ve discussed above this measure of new product/service launches is perhaps the most visible and public of the three, it is surprising that the degree of overlap between this measure and the Business Week/BCG ranking is so low in the absolute sense and has the lowest overlap of our three measures thus far. The CEO’s surveyed by Business Week/BCG as to their perceptions of the top innovators is not influenced by public product and service launches as much as may be expected.
5.2.4. Who Are Generating the Most Revenue?
The top ten firms in revenue generation for this time period include BP, Wal-Mart, Exxon Mobile, General Motors, DaimlerChrysler, Toyota Motor, GE, Ford, Volkswagen, and Seimens. These top ten firms generated over $2260 billion during time period for the study. Interestingly, this list is dominated by five automobile manufacturers. There is a 48% overlap with the BusinessWeek/ BCG ranking, suggesting that financial performance is perhaps weighted higher than are other capabilities in the minds of sitting CEOs as they rank the top innovators. Some of the most prominent firms on our revenue list that are not ranked by BusinessWeek/BCG were, Nissan Motors, British Petroleum, Siemens, Nestle, Matsushita, Toshiba, Unilever, Dow Chemical, and GlaxoSmithKline.
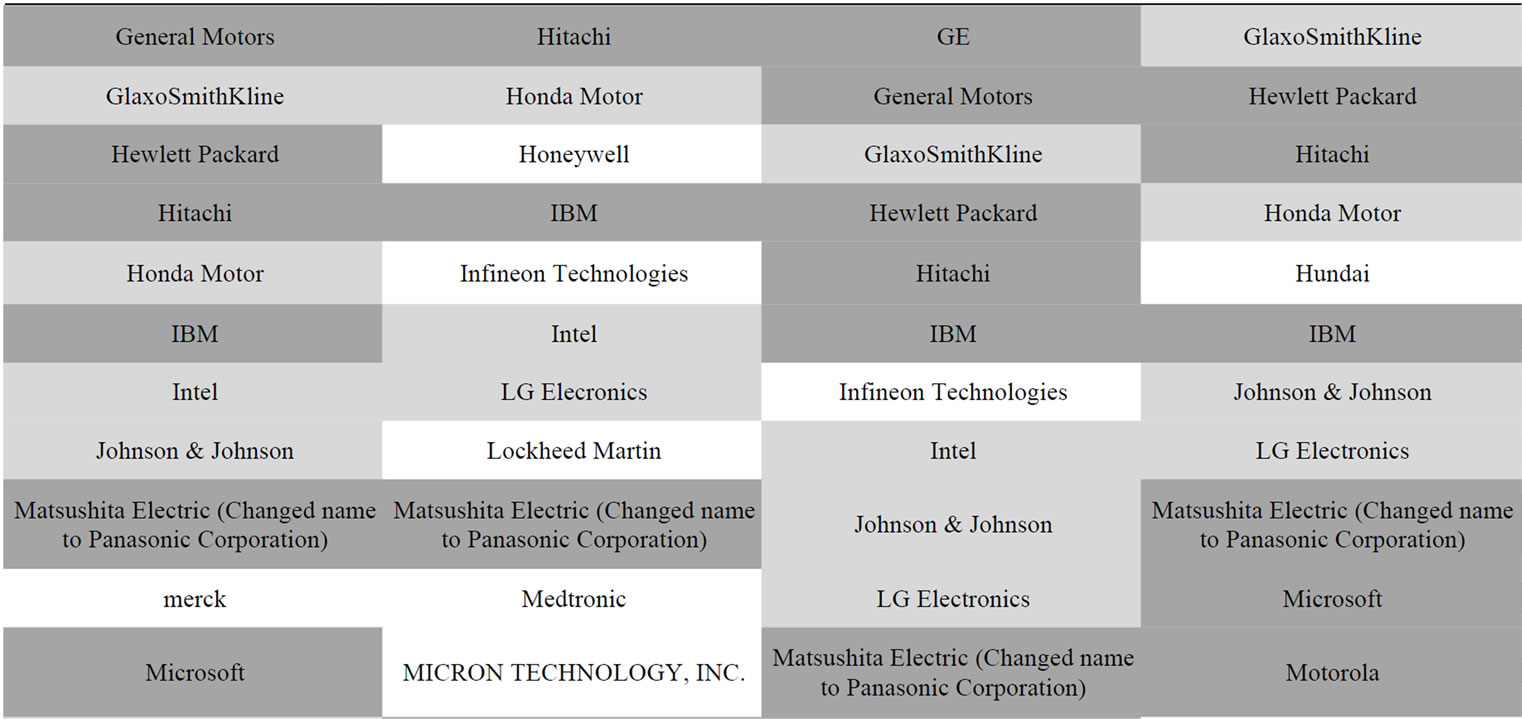
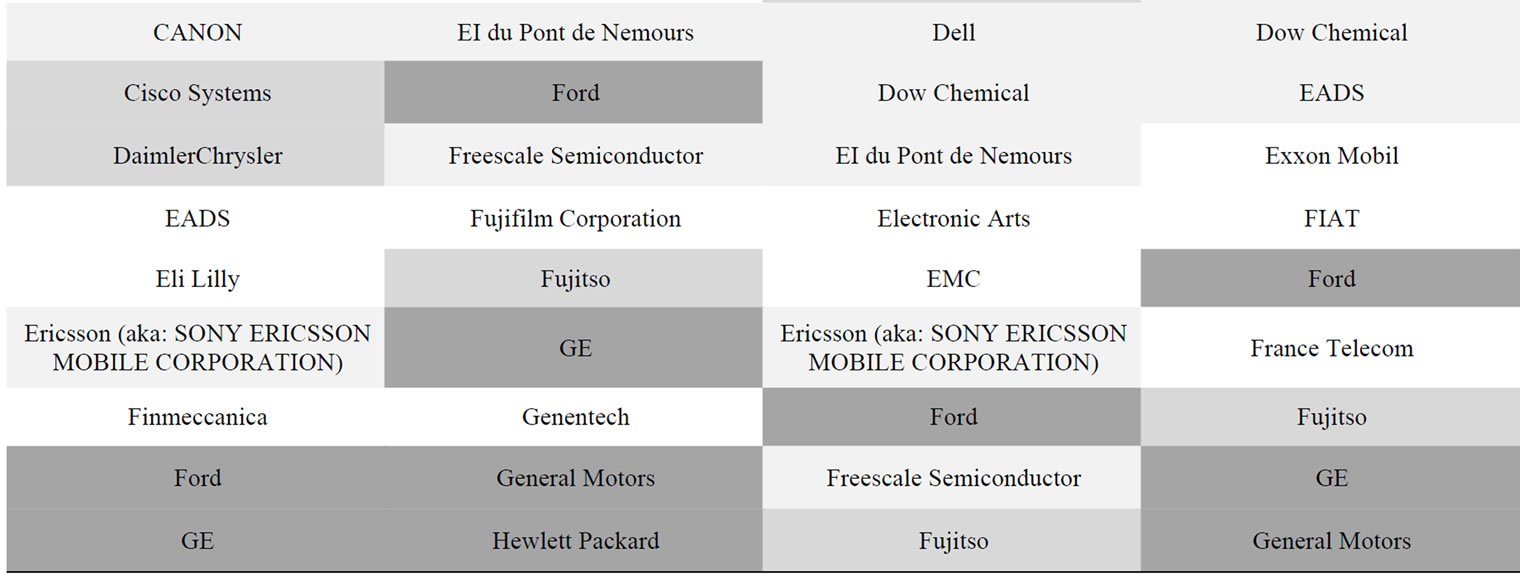
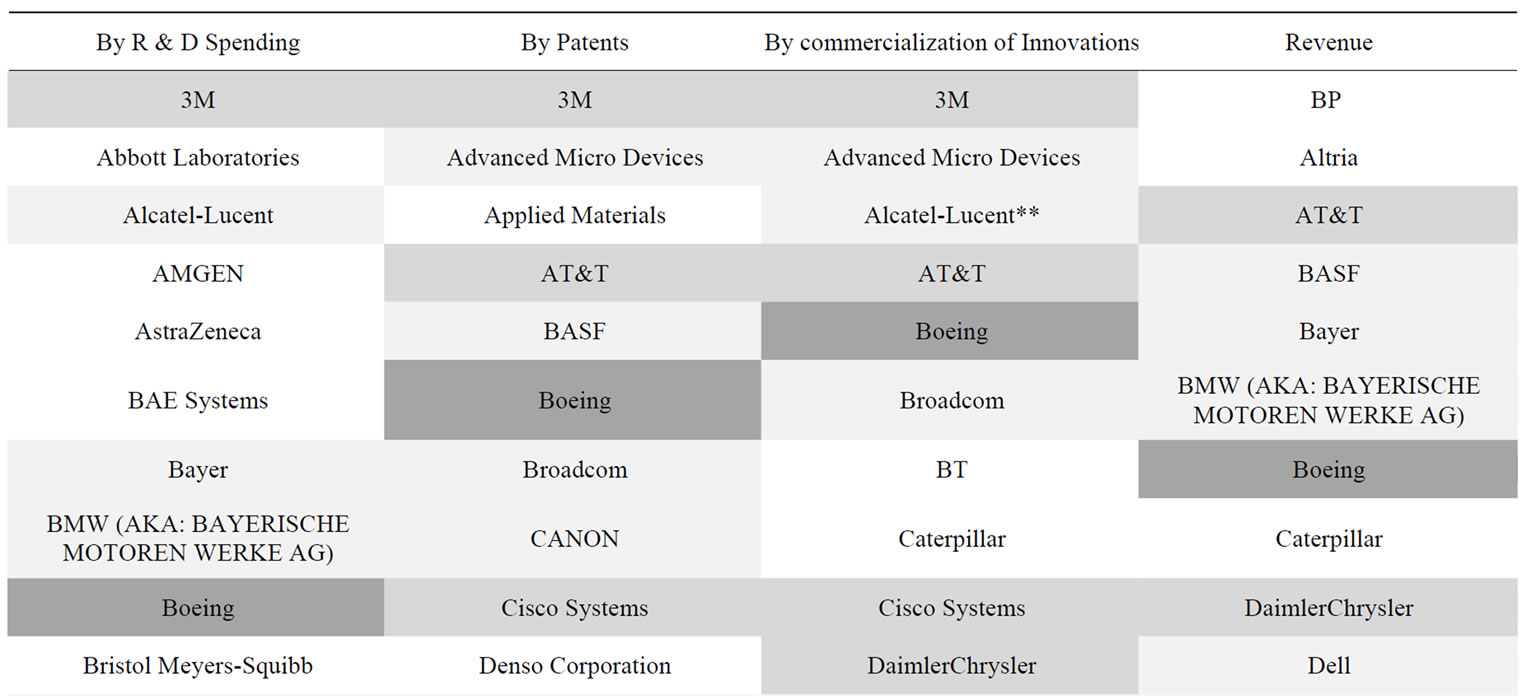
5.2.5. Which Firms Did Well on All Four Attributes?
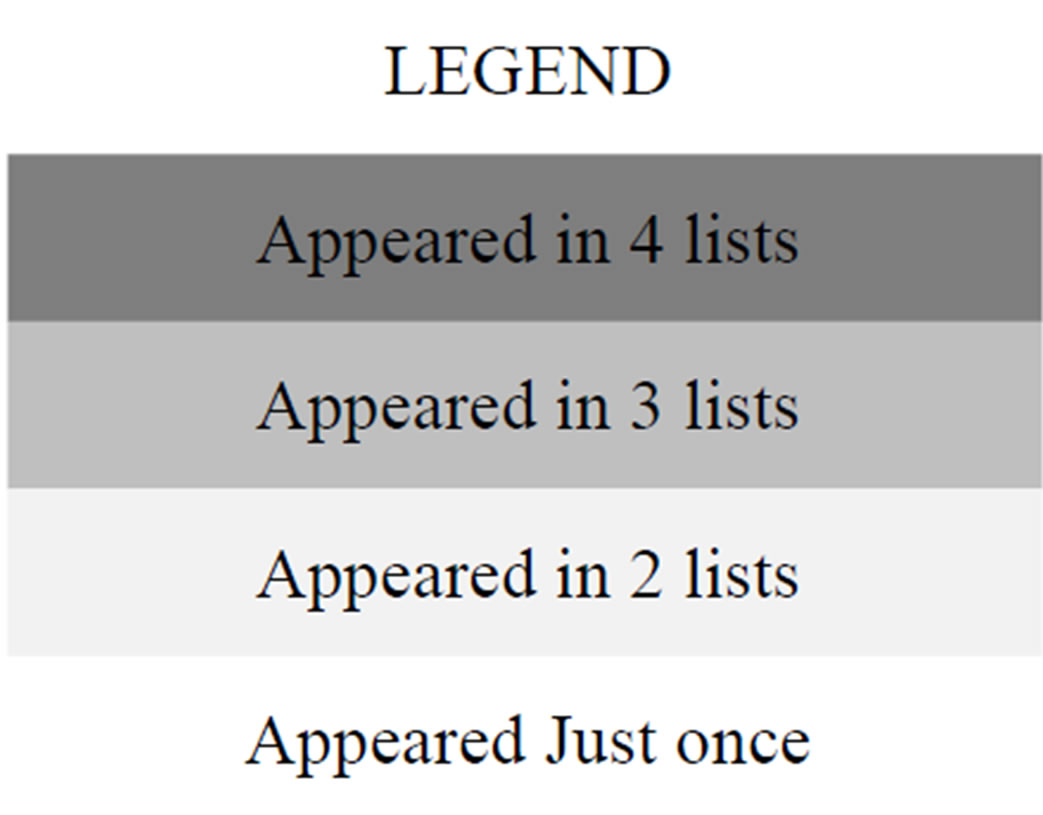
Recall that our belief is that you must look at how well firms are actually commercializing innovations. That means you must look at the actual activities that a firm engages in that enable commercialization, which we describe as the innovation chain and is comprised of R & D spending, patent protection, new product/service launches, and revenues. Appendix 2 shows the positioning of firms on each of these four dimensions. Each of the columns shows the ranking of the top 50 firms on that particular dimension, and the grey-scale coding within that table represents how many of the columns that firm appears. Firms coded in dark grey appeared in the top 50 within all four categories. Firms coded in one shade lighter grey are in the top 50 within three categories. Firms in two shades lighter grey appeared in two categories, and firms in white appeared in one category. Appendix 3 shows which firms appeared in all four categories, a total of 15 firms. It also shows which firms appeared in three of the four categories, a total of 16 firms. The 15 firms that performed well on all four aspects of the innovation chain invested heavily in research and development, worked hard to protect their intellectual property in the form of patent submissions, launched a relatively high number of new products and/or services, or at least released a relatively high number of significant upgrades and enhancements to their offerings, and also generated a large amount of revenues. We list these firms alphabetically and purposefully do not make any judgments about the relative rankings within this list of 15. We believe that all of these 15 can be thought of as great innovators and commercializers of their innovations. Given that they represent diverse industries, and thus have to contend with different economic and environmental factors, it would be difficult to make meaningful comparisons. It is worth noting, however, that these 15 firms are dominated by 10 electronics manufacturers of various types, with an additional 3 automobile manufacturers, 1 aircraft manufacturer, and 1 software firm. Of these 15 firms, 7 came from the USA (2 from Washington State, 2 from Michigan, 1 from Illinois, 1 from New York and 1 from California), 5 from Japan (4 from Tokyo, 1 from Osaka), and 1 each from Finland, Germany and South Korea. The 16 firms that performed well on three dimensions shows a similar trend in terms of industry representation, including 10 electronics firms, 3 automobile manufacturers, 2 consumer products companies, and 1 pharmaceutical firm. Of these 16 firms, 8.5 came from USA, 3 from Japan, 1.5 from Germany, and 1 each from Korea, UK and the Netherlands.
5.3. Comparisons with Business Week/BCG: Perceptions and Reality
Surprisingly, among our top 15 firms that appeared in the top 50 on all four of our innovation chain dimensions, only 8 out of the 15 (53 percent) also appear in the Business Week/BCG rankings of the top innovators. The 16 firms that performed well on at least three of our four dimensions fared slightly better on the Business Week/ BCG rankings (11 out of 16 firms, or 69 percent of them). Among the most noteworthy firms that did well on our quantitative measures but did not appear in Business Week/BCG’s more qualitative ranking were Bosch, Hitachi, Nissan Motors, Sun Microsystems, and Toshiba (see Appendix 4), all of which are foreign..
That anomaly aside, the perceptions of sitting CEO’s as captured in the Business Week/BCG ranking do not match reality as well as one would expect. Our prior analysis of each of the four dimensions suggested that the most overlap between our analysis and the Business Week/BCG ranking occurred on the dimension of revenues. As already suggested, the perceptions of sitting CEO’s as to who are the most innovative firms is perhaps influenced more by financial performance than innovation and commercialization. We find it interesting that there are firms that perform well on each of the dimensions of the innovation chain and, yet, do not appear in the Business Week ranking. One explanation is that these firms are successfully commercializing innovations, but their reputation for being a great innovator does not match their actual success at doing this. Conversely, there are firms that appear on the Business Week ranking and do not appear on our lists. For example Ebay, Amazon.com, or Google, despite not performing well on measures of the innovation chain were listed by CEOs as being top innovators, perhaps because of the ubiquitous presence of these firms or the innovative nature of their business models.
We are not discounting organizations like Amazon’s and Google’s innovative capacity; rather, we believe they are not successful at commercializing innovations in the classic sense as we measure it here. Amazon, Google, and Apple are organizations that are well known among CEOs and everyone else, while a company such as Fujitso has products that rest deep inside a computer and are not as well known. Similarly, the Business Week/ BCG ranking lists Walmart, Costco, and McDonalds as top innovative companies. While one can argue that these firms might have innovative business models, pricing strategies, or other tactics, the same cannot necessarily be said of their ability to take their own new products to market. The point here is not that the Business Week/BCG ranking is flawed or not useful. We believe that their ranking is well done and very useful. On the one hand, while reputation is important, we believe that one should also consider hard measures of innovation and of commercialization. Equally, our more quantitative measures do not tell the entire story. Ideally, a firm would need to perform well on all four dimensions of the innovation chain and have a great reputation for innovation. To do well on all of our four dimensions and the Business Week/BCG ranking, as 9 firms did, could be considered the most comprehensive measure of success. These firms are commercializing innovations successfully and are well known for doing so.
5.4. Are We Missing Any Other Great Innovators?
In our research we also uncovered a number of firms that do not necessarily do well either in our analysis of the innovation chain or on Business Week’s ranking of top innovators, and yet these firms are clearly innovative and creating value. These firms (Appendix 5) are not necessarily spending lots of money on R & D, they are not filing for lots of patents, they are not necessarily launching many new offerings, they do not have the scale in revenues that some of the firms did in our analysis above, but they are clearly very innovative firms that are adding lots of value for consumers and to the economy at large. They likely did not show up in our analysis simply because these firms are not making their own products in the classic sense. These firms deserve a form of “honorable mention” in any treatise on firms that are good at commercializing innovation.
6. Discussions
6.1. Summary
We found that R & D, Patenting and Product and Service releases (CI) are tightly linked. However, the role that the three variables play with respect to Revenue was slightly ambiguous. While the three variables collectively explain variance in revenue, the paths from Patents and CI to revenue remained non significant. An interesting observation is that as we moved forward to look at revenues in subsequent years, the explanatory power of CI and Patents on Revenues increased. The explanation for this is that there is a lag time from R & D spending to patents and from patents to commercialized products. Also there is a lag time between product release and diffusion of the product into the market [36]. These lag times impact the effect of patents and, subsequently, product releases on revenues. Although statistically not significant early on, the impact of patenting and commercialization of innovations on revenues increases in subsequent years. These investments appear to indeed pay off over time.
6.2. Conclusions
Being innovative is one of the key attributes to a firm’s success. Business Week together with the Boston Consulting Group identifies and ranks the top innovative firms, which provides a useful accounting each year of the best of the best. This annual list highlights in particular those top firms that have an excellent reputation for innovation. Through our research we aimed to supplement the Business Week/BCG approach, and so we looked specifically at the commercialization of innovation. We focused on the innovation chain within companies and collected data on spending in R & D, patent submissions, product/service releases, and revenues, and then showed who was the best at each of these criteria, and then across all of the criteria.
Our approach shows that there are 15 firms that excel at all four aspects of the innovation chain as we measured them, and another 16 firms that excel at three aspects. Perhaps not surprising, these top firms were dominated by electronics manufacturers, although among the top firms were an airplane manufacturer, a software firm, some consumer products firms, and a pharmaceutical giant. In any event, each of these firms is doing what it takes to successfully commercialize innovation. Our approach was more quantitative in nature and measured data on several key activities within the firm, and as a result our results differed from those from the more qualitative approach taken by Business Week/BCG in their ranking of innovative firms. There was just over 60 percent overlap among top firms on our measures versus those in the Business Week/BCG ranking. One puzzling element to our data was that there was relatively little overlap between our measure of product and service launches and the Business Week measure of CEO perceptions of innovation. We would have expected more overlap on those two measures given how “public” product launches can be. Perhaps not surprising, there was greater overlap between our measure of revenues and the Business Week measure of CEO perceptions of innovation. That tells us that the perceptions of sitting CEOs as to who are the great innovators are driven by size and financial success. In any event, we believe that both our approach and the Business Week/BCG approach taken together provide a useful look into how to be successful at innovating and to be well known for it. In addition, we provided some empirical evidence that activities toward commercialization of innovation can impact revenues downstream. We believe that collectively this work is not only useful for those studying organizations, but for those working in, managing, directing, and investing in them as well.
6.3. Future Opportunities
Like any other approach to research ours is not without its own limits and weaknesses. Our approach does not, for example, differentiate between product launches and significant product enhancements. It would be useful in future to be able to distinguish between a new product release like Windows Vista as opposed to enhancements like new service packs (i.e., incremental upgrades to the Vista operating system). We could also in future distinguish better between types of products. For instance, a release of a new mouse by Microsoft is not necessarily the same as the release of a new model of airplane by Boeing.
Another future path for this research would be to perform a causal, time-series analysis where one would look at R & D spending, patent protection, and new product/ service launches in one year and see how these variables influence revenues in subsequent years. Further, we could control for macro-economic conditions, process innovations, and a firm’s merger and acquisition activity to see what effect these have on commercialization of innovation versus the effect of our innovation chain variables. One other fruitful line of research may be to determine what effect these real and perceived measures of innovation and commercialization have on stock price, which can be thought of as the market’s collective perception of the value of a firm. We acknowledge that our research approach may be biased more toward firms that design, develop, and produce their own products, try to protect them legally, and take them to market (i.e., classic manufacturing organizations). It is clear that a lot remains to be done in helping us to better understand commercialization of innovations, not only in terms of better understanding the construct, but also in merging the gap between related perceptions and realities. This, we believe, would also lead to a better understanding of corporate reputation and help to understand why it is that we believe some firms to be better than others at core functions such as being innovative. We hope that our work at least offers a good beginning and suggests some fruitful avenues for future research.
7. References
[1] W. M. Cohen and D. A. Levinthal, “Absorptive Capacity: A New Perspective on Learning and Innovation,” Administrative Science Quarterly, Vol. 35, No. 1, 1990, pp. 128-152. doi:10.2307/2393553
[2] A. Nerkar and S. Shane, “Determinants of Invention Commercialization: An Empirical Examination of Academically Sourced Inventions,” Strategic Management Journal, Vol. 28, No. 11, 2007, pp. 1155-1166. doi:10.1002/smj.643
[3] S. A. Zahra and A. P. Nielsen, “Sources of Capabilities, Integration and Technology Commercialization,” Strategic Management Journal, Vol. 23, No. 5, 2002, pp. 377- 398. doi:10.1002/smj.229
[4] K. M. Eisenhardt and J. A. Martin, “Dynamic Capabilities: What Are They?” Strategic Management Journal, Vol. 21, No. 10/11, 2000, pp. 1105-1121.
[5] K. M. Kelm, V. K. Narayanan and G. E. Pinches, “Shareholder Value Creation during R & D Innovation and Commercialization Stages,” Academy of Management Journal, Vol. 38, No. 3, 1995, pp. 770-786. doi:10.2307/256745
[6] V. K. Narayanan, G. E. Pinches, K. M. Kelm and D. M. Lander, “The Influence of Voluntarily Disclosed Qualitative Information,” Strategic Management Journal, Vol. 21, No. 7, 2000, pp. 707-722.
[7] S. Nambisan and M. Sawhney, “A Buyer’s Guide to the Innovation Bazar,” Harvard Business Review, Vol. 85, No. 6, 2007, pp. 109-118.
[8] J. P. Andrew and H. L. Sirkin, “Innovating for Cash,” Harvard Business Review, Vol. 81, No. 9, 2003, pp. 76-83.
[9] M. Kwak, “What’s the Best Commercialization Strategy for Startups?” Sloan Management Review, Vol. 48, No. 3, 2002, pp. 1-10.
[10] T. M. Nevens, G. L. Summe and B. Uttal, “Commercializing Technology: What Do the Best Companies Do?” Harvard Business Review on Entrepreneurship, Vol. 1999, 1990, p. 175.
[11] J. B. Sorensen and T. E. Stuart, “Aging, Obsolescence, and Organizational Innovation,” Administrative Science Quarterly, Vol. 45, No. 1, 2000, pp. 81-112. doi:10.2307/2666980
[12] R. Katila, “New Product Search over Time: Past Ideas in Their Prime?” Academy of Management Journal, Vol. 45, No. 5, 2002, pp. 995-1010. doi:10.2307/3069326
[13] R. Katila and G. Ahuja, “Something Old, Something New: A Longitudinal Study of Search Behavior and New Product Introduction,” Academy of Management Journal, Vol. 45, No. 6, 2002, pp. 1183-1194. doi:10.2307/3069433
[14] A. Nerkar and P.W. Roberts, “Technological and Product-Market Experience and the Success of New Product Introductions in the Pharmaceutical Industry,” Strategic Management Journal, Vol. 25, No. 8-9, 2004, pp. 779-799. doi:10.1002/smj.417
[15] L. Fleming, “Recombinant Uncertainty in Technological Search,” Management Science, Vol. 47, No. 1, 2001, pp. 117-132. doi:10.1287/mnsc.47.1.117.10671
[16] L. Fleming and O. Sorenson, “Technology as a Complex Adaptive System: Evidence from Patent Data,” Research Policy, Vol. 30, No. 7, 2001, pp. 1019-1039. doi:10.1016/S0048-7333(00)00135-9
[17] R. A. Burgelman, C. M. Christensen and S. C. Wheelright, “Strategic Management of Technology and Innovation,” McGraw Hill Irwin, New York, 2006.
[18] W. Chung and S. Yeaple, “International Knowledge Sourcing: Evidence from U.S. Firms Expanding Abroad,” Strategic Management Journal, Vol. 29, No. 11, 2008, pp. 1207-1224. doi:10.1002/smj.706
[19] W. M. Cohen, R. R. Nelson and J. P. Walsh, “Links and Impacts: The Influence of Public Research on Industrial R & D,” Management Science, Vol. 48, No. 1, 2002, pp. 1-23. doi:10.1287/mnsc.48.1.1.14273
[20] D. M. Decarolis and D. L. Deeds, “The Impact of Stocks and Flows of Organizational Knowledge on Firm Performance: An Empirical Investigation of the Biotechnology Industry,” Strategic Management Journal, Vol. 20, No. 10, 1999, pp. 953-968.
[21] S. Dutta and A. M. Weiss, “The Relationship between a Firm’s Level of Technological Innovativeness and Its Pattern of Partnership Agreements,” Management Science, Vol. 43, No. 3, 1997, pp. 343-356. doi:10.1287/mnsc.43.3.343
[22] Z. Griliches, “The Search for R & D Spillovers,” The Scandinavian Journal of Economics, Vol. 94, 1992, pp. 29-47. doi:10.2307/3440244
[23] G. Hamel and G. Getz, “Funding Growth in an Age of Austerity,” Harvard Business Review, Vol. 82, No. 7-8, 2004, pp. 76-84.
[24] M. A. Hitt, R. E. Hoskisson and K. Hicheon, “International Diversification: Effects on Innovation and Firm Performance in Product-Diversified Firms,” The Academy of Management Journal, Vol. 40, No. 4, 1997, pp. 767-798. doi:10.2307/256948
[25] T. Iwasa and H. Odagiri, “Overseas R & D, Knowledge Sourcing, and Patenting: An Empirical Study of Japanese R & D Investment in the US,” Research Policy, Vol. 33, No. 5, 2004, pp. 807-828. doi:10.1016/j.respol.2004.01.002
[26] J. Penner-Hahn and J. M. Shaver, “Does International Research and Development Increase Patent Output? An Analysis of Japanese Pharmaceutical Firms,” Strategic Management Journal, Vol. 26, No. 2, 2005, pp. 121-140. doi:10.1002/smj.436
[27] J. Uotila, M. Maula, T. Keil and S. A. Zahra, “Exploration, Exploitation, and Financial Performance: Analysis of S & P 500 Corporations,” Strategic Management Journal, Vol. 30, No. 2, 2009, pp. 221-231. doi:10.1002/smj.738
[28] M. B. Heeley and R. Jacobson, “The Recency of Technological Inputs and Financial Performance,” Strategic Management Journal, Vol. 29, No. 7, 2008, pp. 723-744. doi:10.1002/smj.682
[29] A. Nerkar, “Old Is Gold? The Value of Temporal Exploration in the Creation of New Knowledge,” Management Science, Vol. 49, No. 2, 2003, pp. 211-229. doi:10.1287/mnsc.49.2.211.12747
[30] M. E. Porter and S. Stern, “Measuring the ‘Ideas’ Production Function: Evidence from International Patent Output,” NBER Working Paper No. 7891, 2000.
[31] J. L. Furman, M. E. Porter and S. Stern, “The Determinants of National Innovative Capacity,” Research Policy, Vol. 31, No. 6, 2002, pp. 899-933. doi:10.1016/S0048-7333(01)00152-4
[32] C. van der Eerden and F. H. Saelens, “The Use of Science and Technology Indicators in Strategic Planning,” Long Range Planning, Vol. 24, No. 3, 1991, pp. 18-25. doi:10.1016/0024-6301(91)90180-V
[33] A. Delios and P. W. Beamish, “Geographic Scope, Product Diversification, and the Corporate Performance of Japanese Firms,” Strategic Management Journal, Vol. 20, No. 8, 1999, pp. 711-727.
[34] R. Sabherwal and S. Sabherwal, “Knowledge Management Using Information Technology: Determinants of ShortTerm Impact on Firm Value,” Decision Sciences, Vol. 36, No. 4, 2005, pp. 531-567. doi:10.1111/j.1540-5414.2005.00102.x
[35] J. M. Shaver, “Testing for Mediating Variables in Management Research: Concerns, Implications, and Alternative Strategies,” Journal of Management, Vol. 31, No. 3, 2005, pp. 330-353. doi:10.1177/0149206304272149
[36] G. A. Moore, “Crossing the Chasm. Marketing and Selling Disruptive Products to Mainstream Customers,” Harper Business, New York, 1991.
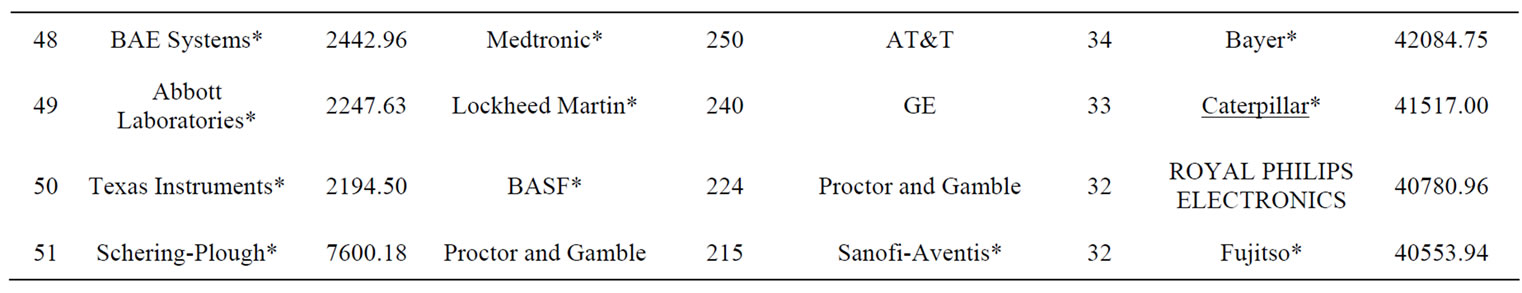
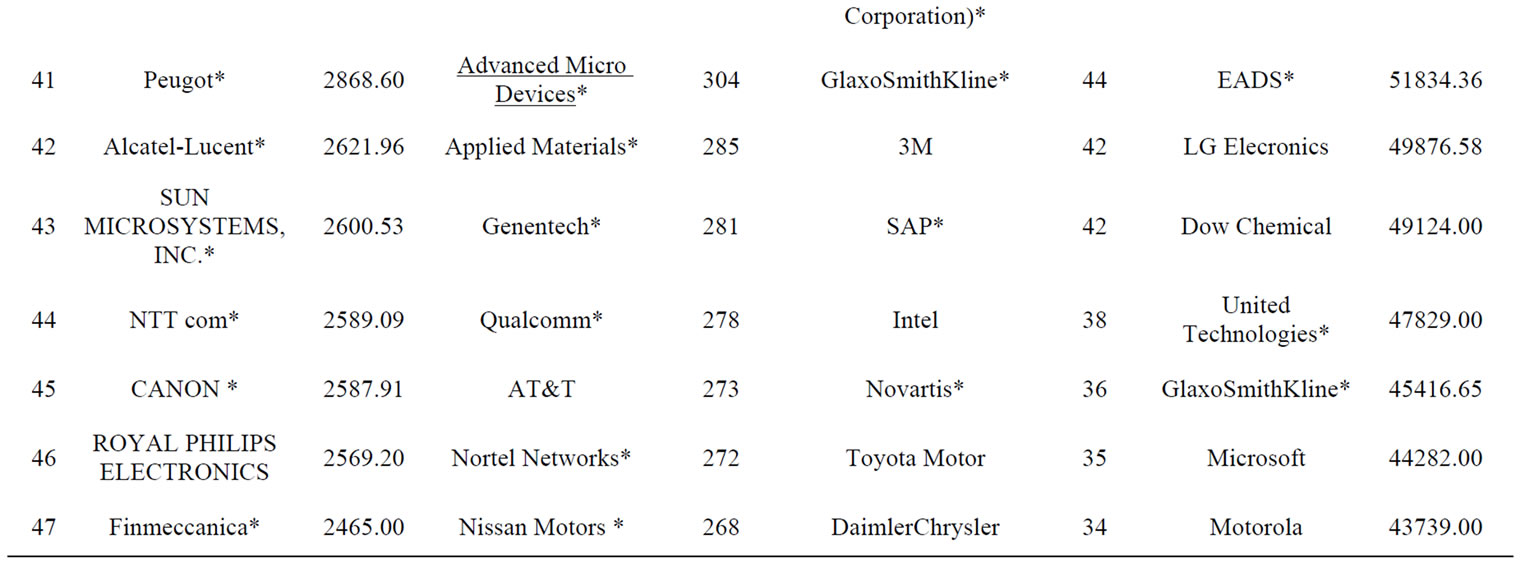
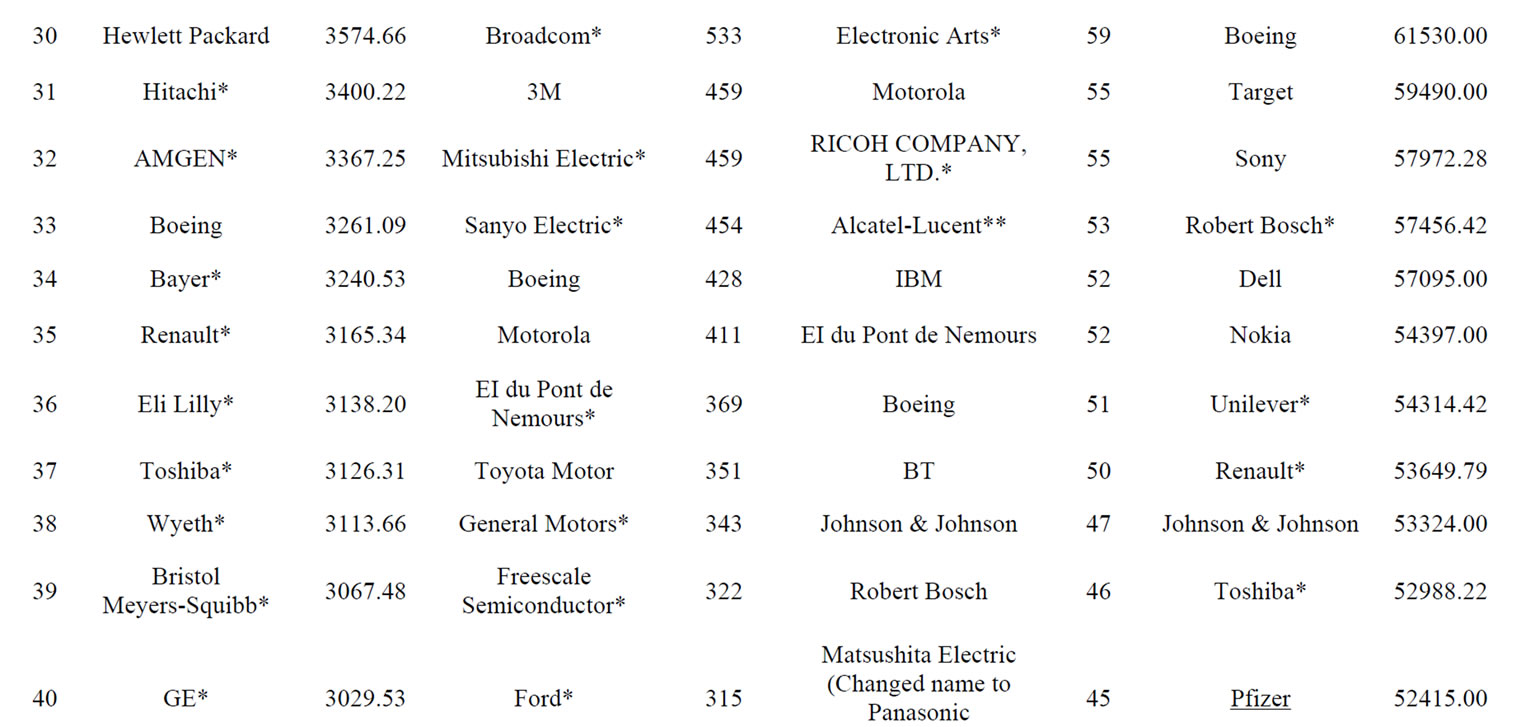
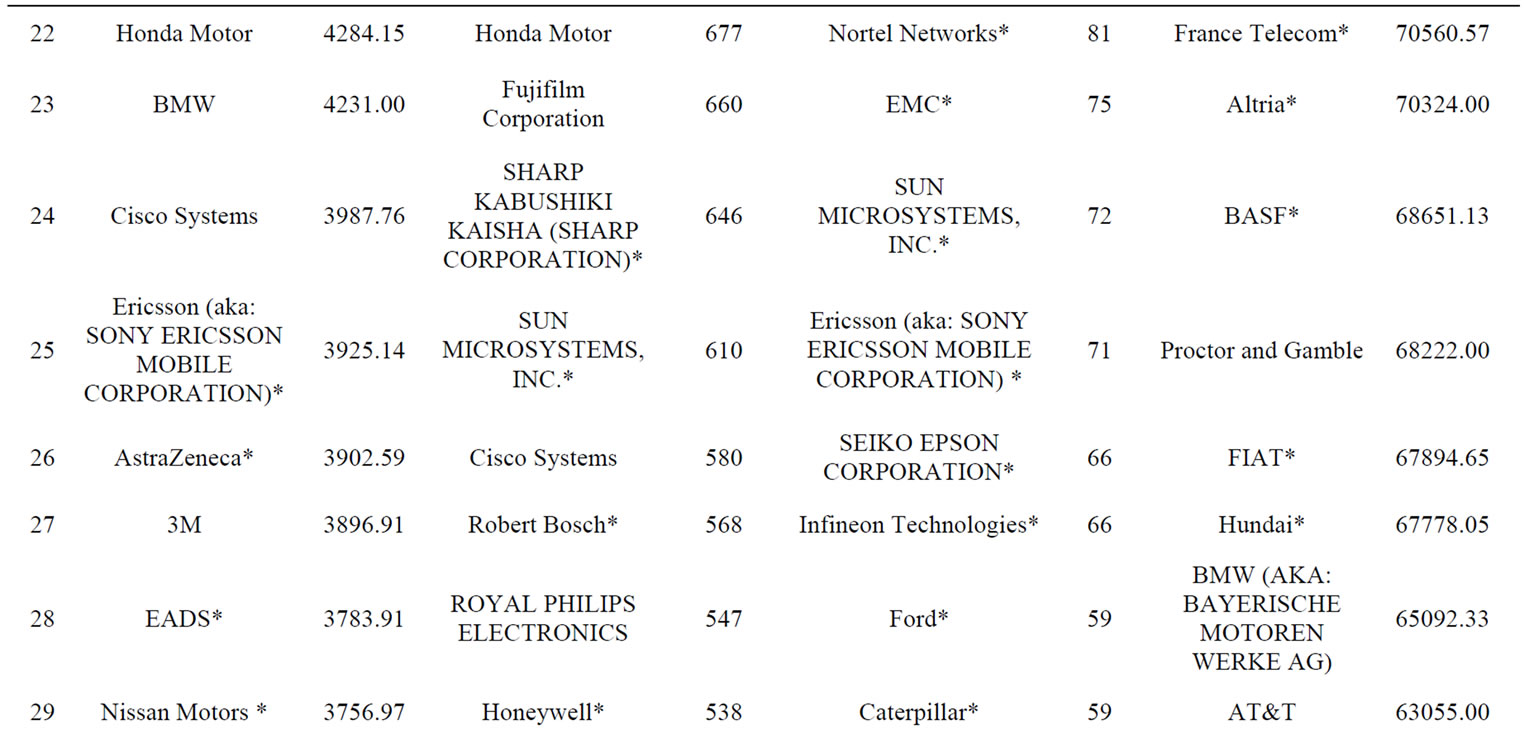
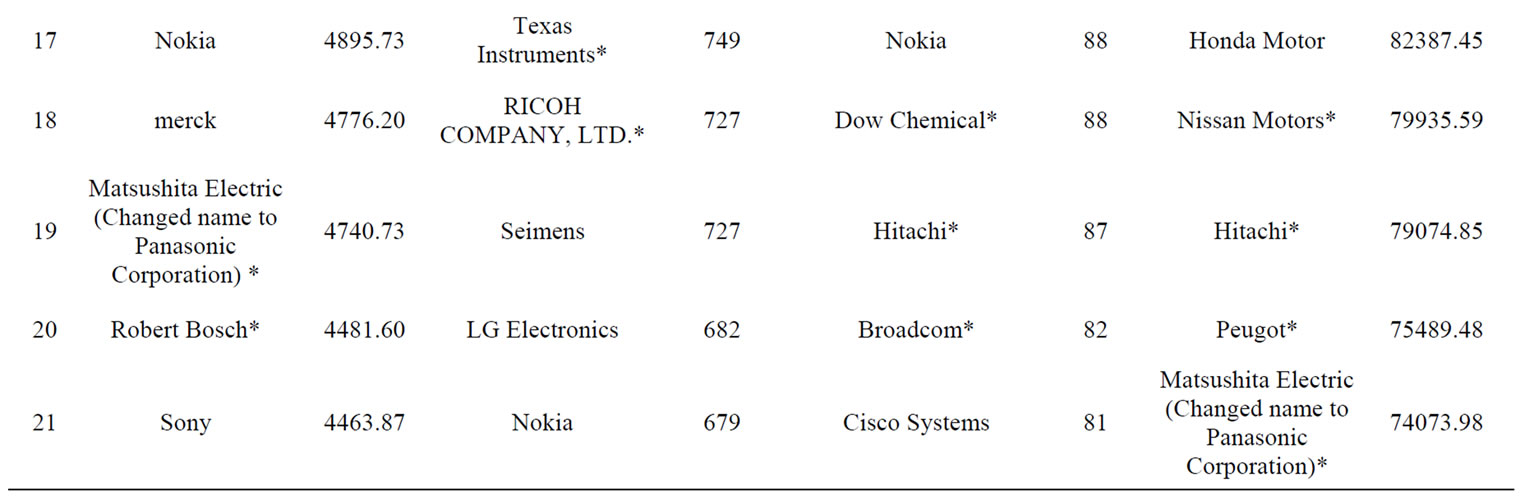
Appendix 1.Top 50 organizations in the innovation chain.
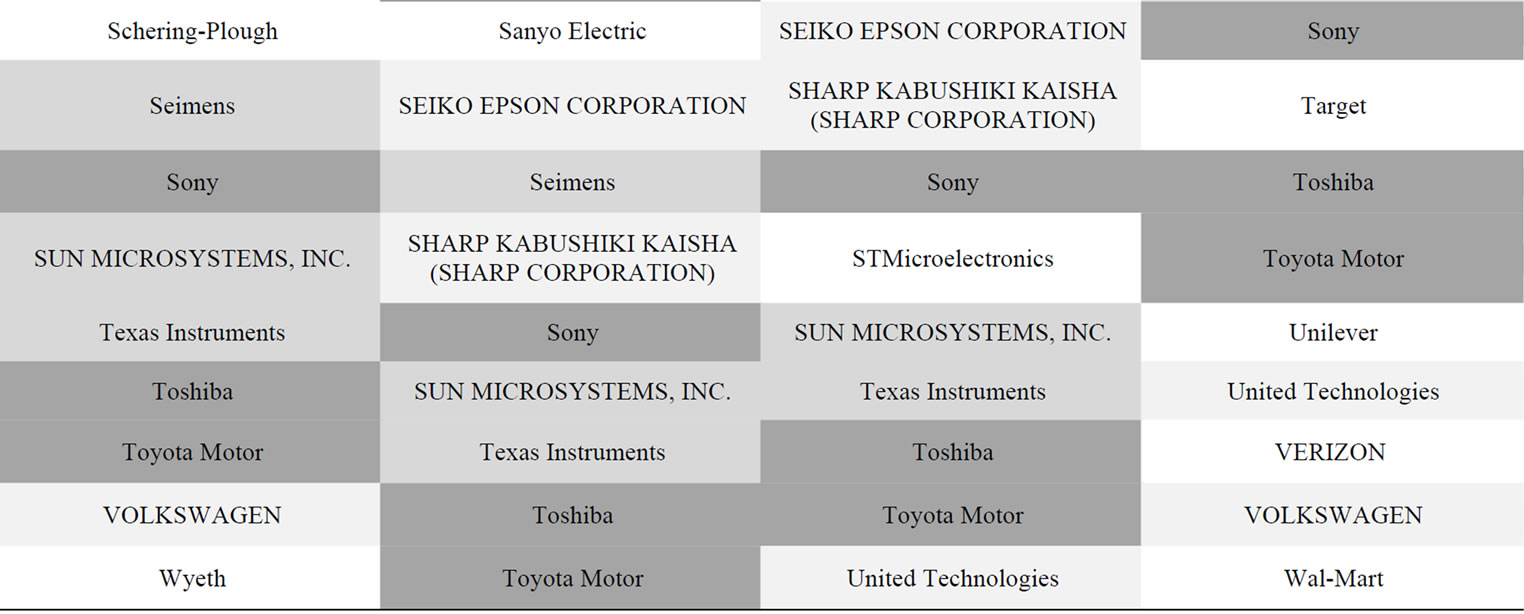
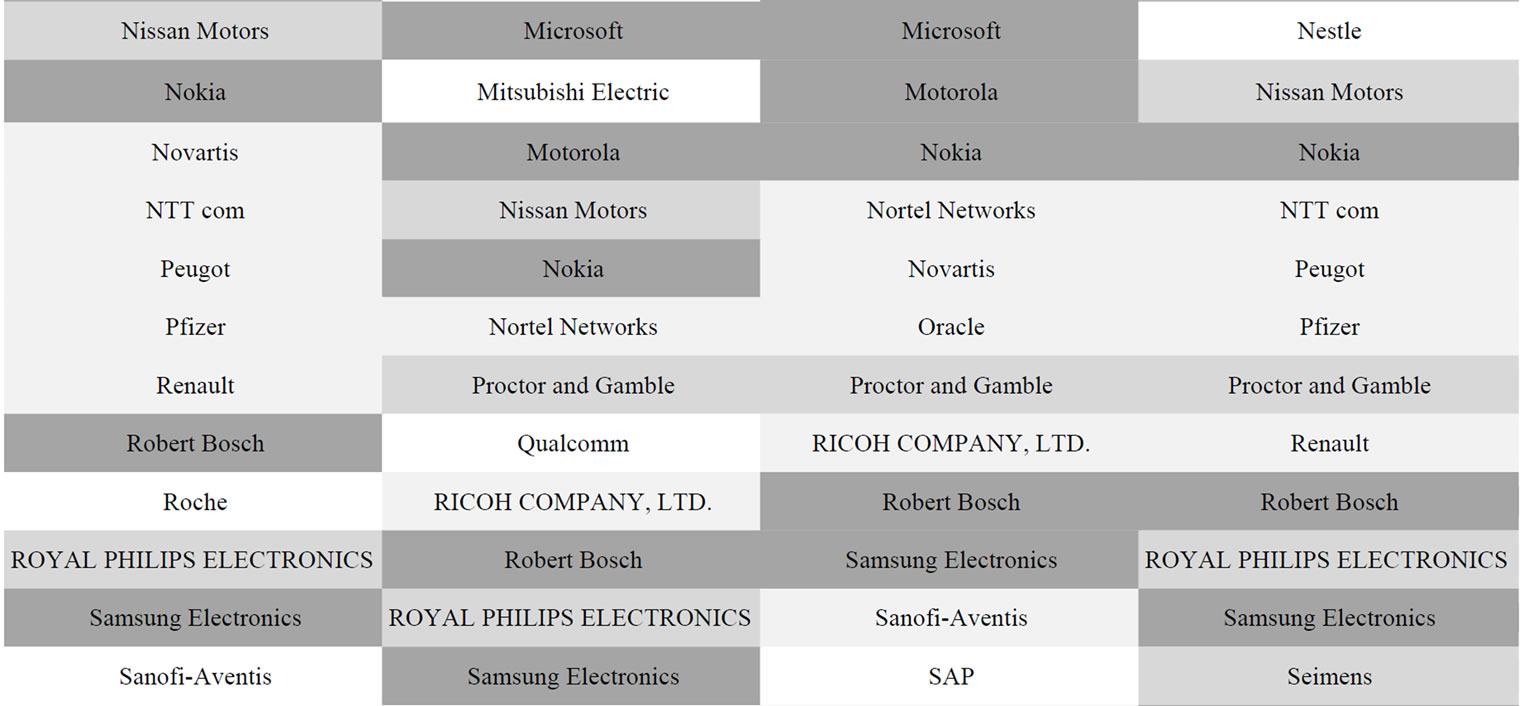
Appendix 2.Positioning of organizations in the innovative chain.

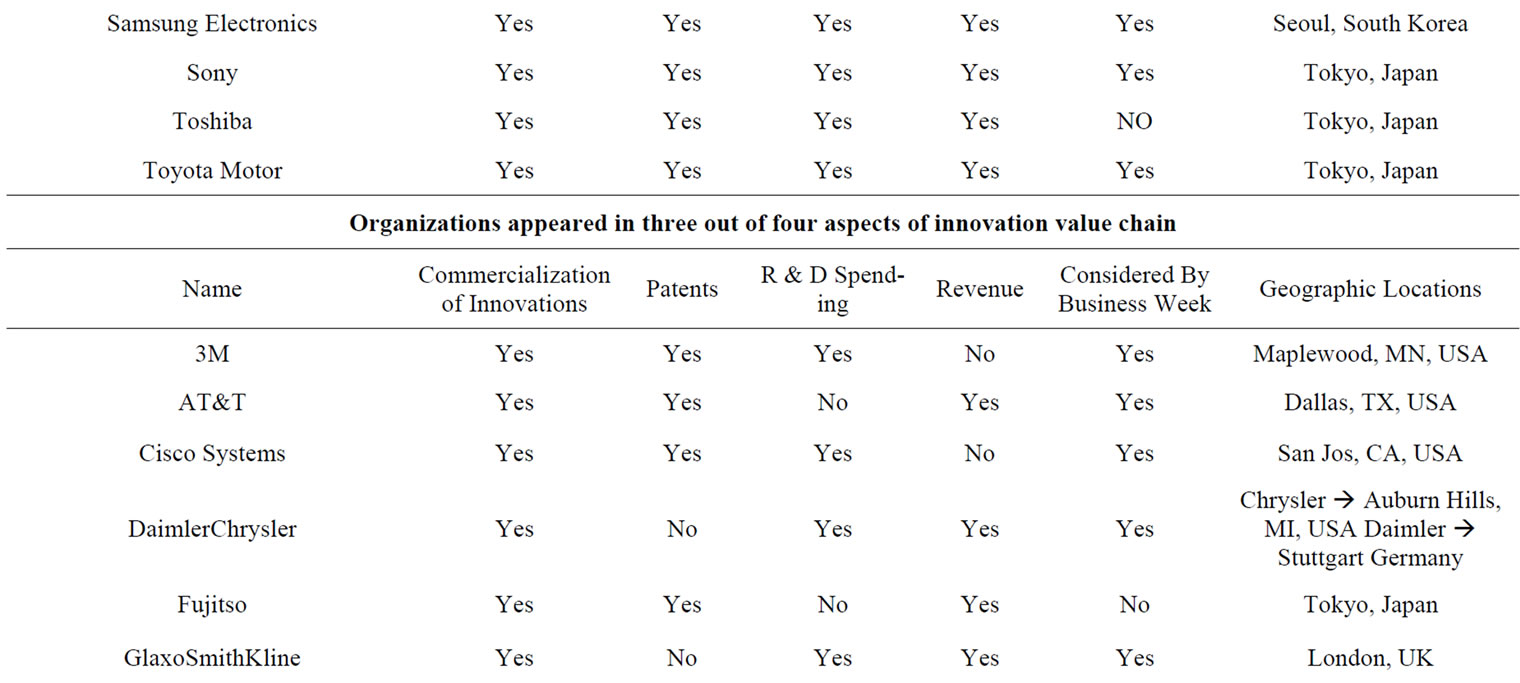
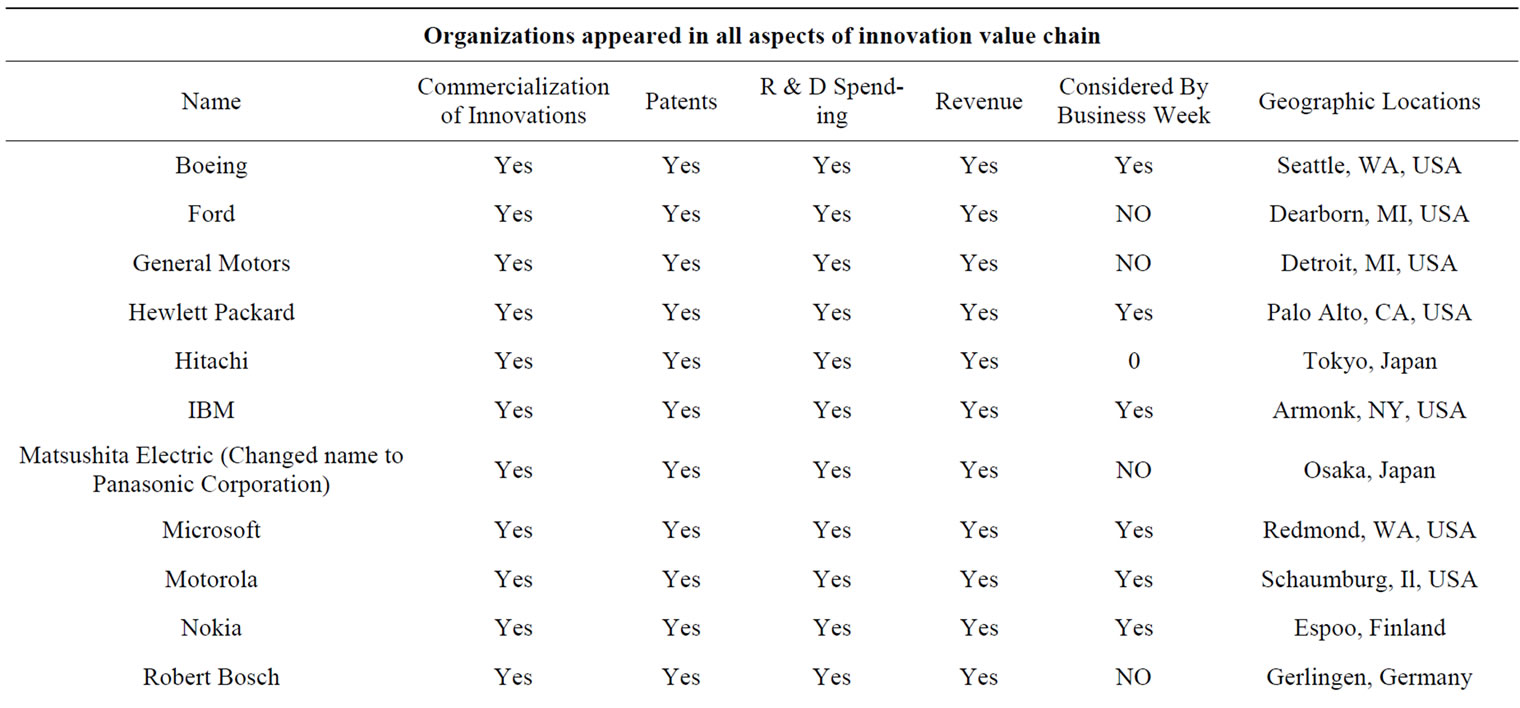
Appendix 3.Organizations consistent with all (or most aspects of) the innovation chain.
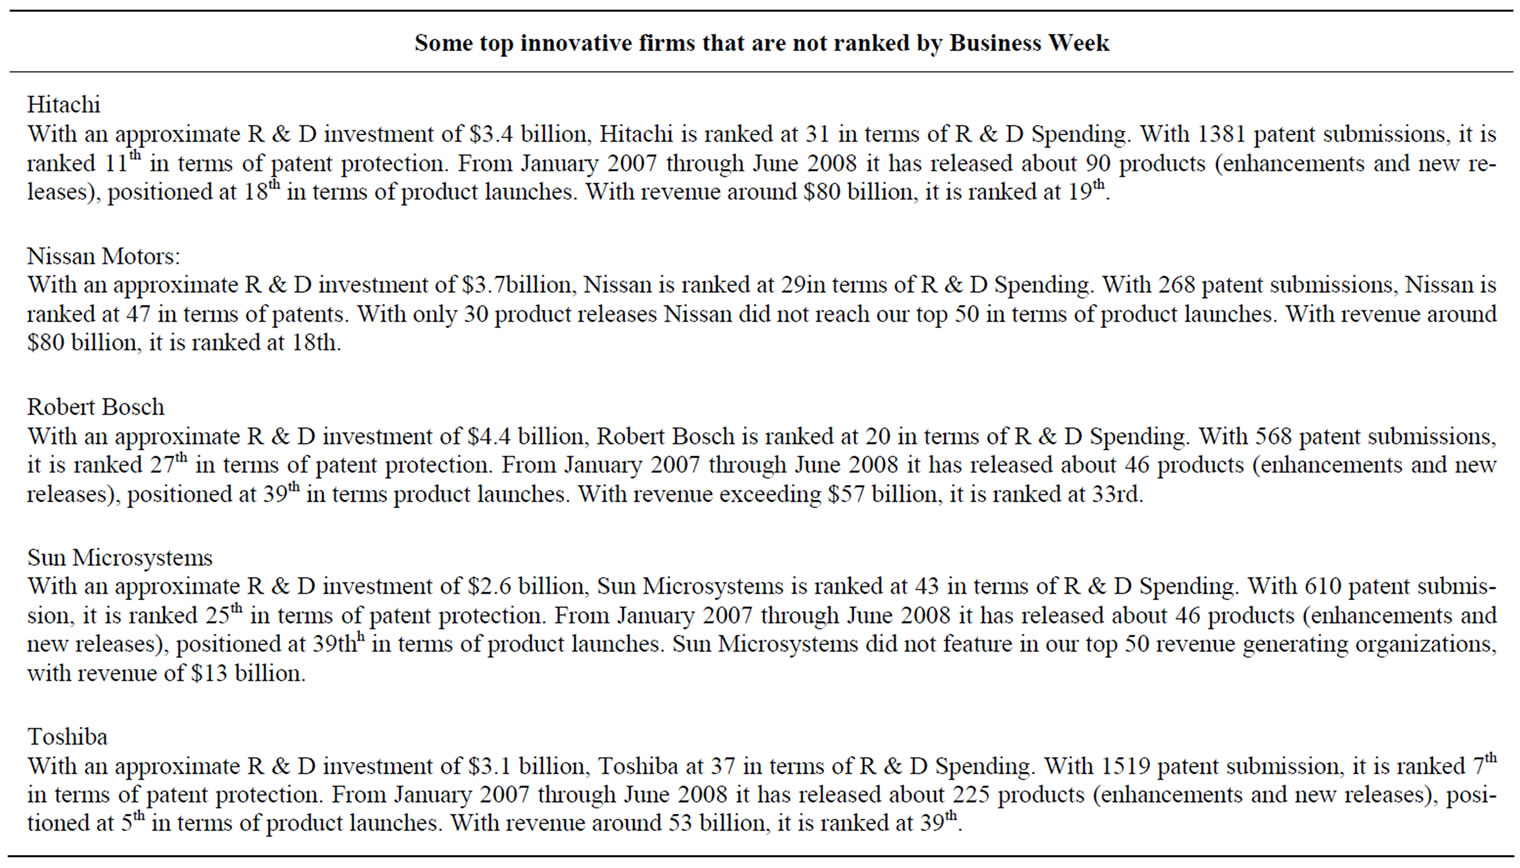
Appendix 4.Innovative firms that are not ranked by Business Week.
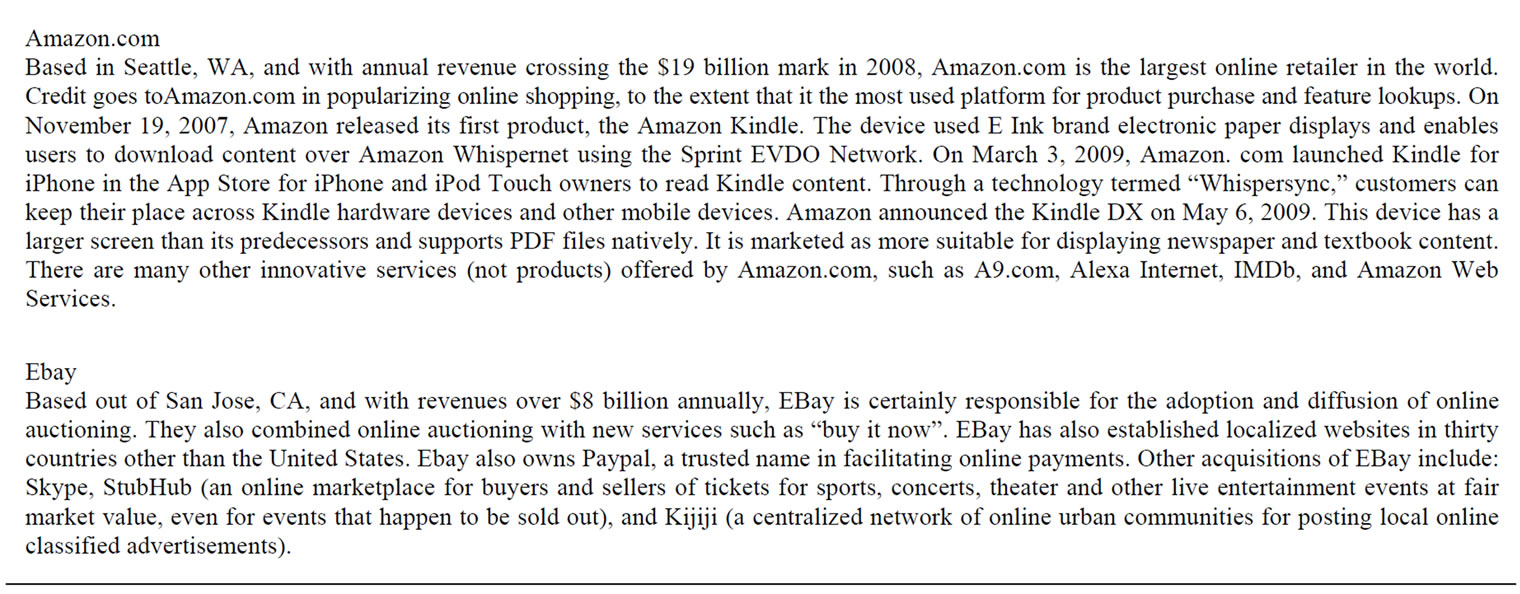
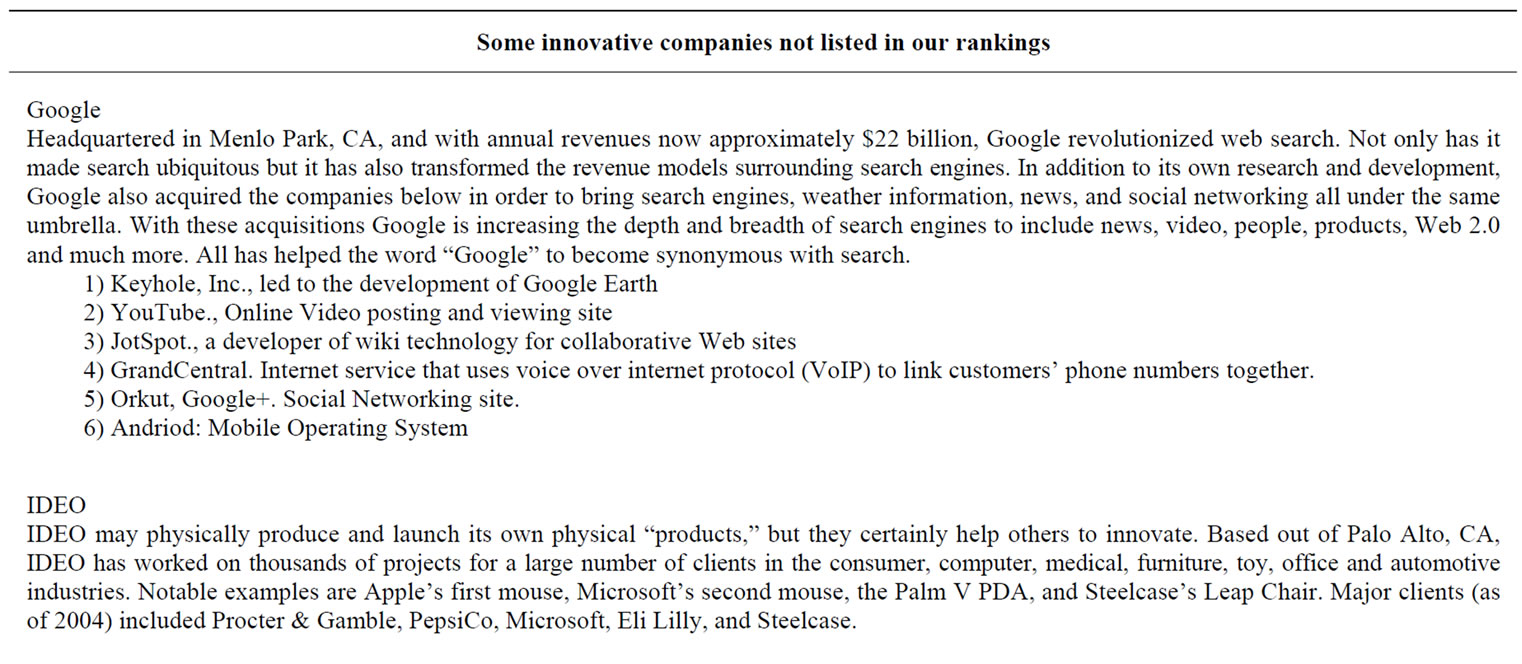
Appendix 5.Innovative firms not captured by our rankings.