Technology and Investment
Vol.1 No.1(2010), Article ID:1324,9 pages DOI:10.4236/ti.2010.11004
Stylistic Differences across Hedge Funds as Revealed by Historical Monthly Returns
1Center for Institutional Investment Management School of Business, University at Albany, Albany, USA
2Virginia Bioinformatics Institute, Virginia Tech, Blacksburg, USA
E-mail: h.shawky@albany.edu, amarathe@vt.edu
Received October 23, 2009; revised November 23, 2009; accepted December 22, 2009
Keywords: Hedge Funds, Clustering, Management Style, Dynamic Trading Strategies
Abstract
This paper utilizes two clustering techniques to provide an objective method for classification of hedge funds. A data driven classification framework that utilizes monthly hedge fund returns as inputs, is shown to provide better comparisons among fund categories and can help investors in identifying common factors that can lead to better diversification strategies. Our clustering results indicate that other than the managed futures category, there are only three unique hedge fund styles. These three categories are the Equity Hedge, Fund of Hedge Funds and the Emerging Markets categories. None of the other hedge fund classifications such as Global macro, Distressed Securities, Merger Arbitrage, Convertible Arbitrage appear as a unique and independent category.
1. Introduction
In a seminal paper, Sharpe [1] proposed an elegant asset class factor model for performance attribution and style analysis of mutual fund managers. The model shows that with only a limited number of asset classes, it is possible to replicate the performance of a large universe of mutual funds. The success of Sharpe’s model in capturing stylistic differences between mutual fund managers is largely attributed to the fact that most mutual fund managers are typically constrained to hold assets from a well-defined number of standard asset classes and are expected to perform according to relative return targets within their asset classes.
In theory, it should be possible to extend Sharpe’s style factor analysis by adding regressors to proxy for the returns of the various hedge fund strategies. However, in practice, implementing such a strategy may not be feasible due to the infinite number of dynamic trading strategies that are used by hedge fund managers. As an alternative to the Sharpe’s approach, which requires identifying factors a priori, we use cluster analysis to identify the dominant styles in hedge funds. We use monthly returns to cluster the data and our goal is to see if there are unique style categories that are consistent with the return data.
Fung and Hsieh [2] were the first to extend the basic intuition of the Sharpe asset class factor model to the hedge fund industry through the use of Factor analysis. They factor analyze 409 hedge funds and CTA pools over the period January 1991 to December 1995, and find that there are five dominant investment styles in hedge funds. They were able to associate the five dominant styles generated quantitatively to the qualitative styles based on the trading strategies described in the disclosure document of hedge funds.
Brown and Goetzmann [3,4] study the monthly returns of 1296 hedge funds over the period 1989 through January 2000 and find that there are indeed a number of distinct styles of management1 They use two different algorithms in their classification process. The first is a Generalized Style Classification methodology in which funds are assigned to categories through finding a local optimum via the minimization of a “within-group” sum of squares criterion over a specified time period2, the second approach is a Style Classification algorithm in which the number of styles is pre-specified. They report the presence of at least eight distinct styles currently employed by hedge fund managers.
Although there are many statistical techniques that can be used to classify data, the technique that appears to be most directly suitable for the present application is cluster analysis3. We use both K-means Clustering and Hierarchical Clustering techniques to cluster the monthly returns for 2397 hedge funds for the period January 1994 through December 2003. Such a data driven classification framework can help in identifying common factors that can lead to better performance evaluation of hedge fund strategies. As pointed out by Liang [5], to understand the differences and similarities across investment classes, it is necessary to classify hedge funds into major investment classes in terms of performance, risk and fee structures.
Our results obtained through both clustering techniques indicate that other than the managed futures category, there are only three unique hedge fund categories. These three categories are the Equity Hedge, Fund of funds (FOF) and the Emerging Markets categories. None of the other hedge fund strategies such as Global Macro, Distressed Securities, Merger Arbitrage or Convertible Arbitrage appears as a unique and independent cluster. Moreover, we find that there are three unique clusters within the Equity Hedge category, two clusters for Fund of funds (FOF) and four independent clusters for the managed futures category.
Hedge funds use a wide variety of dynamic trading strategies. On one hand, macro funds are most directional, employing a top-down macro view to take advantage of the expected returns of various asset classes. On the other hand, there are market-neutral relative value arbitrage funds that aim to exploit temporary price anomalies between related assets, in equities or fixed income markets. In between these two extreme strategies, there are funds that aim to uncover undervalued asset opportunities in debt or equity markets without necessarily being market neutral.
Unlike mutual funds, hedge funds' focus primarily on absolute returns rather than benchmarks or relative performance. Hedge fund managers have the freedom to pursue a wide range of alternative investment strategies such as the use of derivatives, short selling and leverage, without having to adhere to the stringent SEC regulations and disclosure requirements4. As a result, hedge funds often have low or sometimes negative correlations with traditional market indices. Because of these unique characteristics, hedge funds as an asset class is considered to be an attractive complement to traditional investment strategies that can further help in portfolio diversification.
2. Data and Descriptive Statistics Data Sources
The hedge fund data used in this study is obtained from the CISDM at the University of Massachusetts at Amherst. It covers 4,693 hedge funds from March 1972 through December 20035. Of the total hedge funds in the database, 2397 are live funds and 2296 are defunct funds. The sample includes both U.S. domiciled funds and offshore funds. The variables reported in the database are fund name, strategy, management fee, incentive fee, minimum account size, management company, returns, assets, and net asset value per share6.
The database is survivor-bias free in the sense that it includes both live and dead funds. However, it may still be subject to reporting bias as some funds may at times deliberately choose not to disclose their information publicly7. We choose the period 1990-2003 as the sample period for this study for three reasons. First, this period was characterized by rapid growth of the hedge fund industry. Second, the pre-1990 fund data may be back-filled, as no funds covered in the database are reported as defunct before 1990. Thus, there may be a survival bias in the pre-1990 period. Third, this time period is long enough to cover more than one business cycle.
Four primary hedge fund database providers are common among researchers and industry professionals. Each of these data providers offers a different product. Hedge Fund Research (HFR) database has twenty-six categories of hedge funds. The TASS database is produced through the research subsidiary of Credit Suisse First Boston Tremont Advisors, has nine categories classified based on the investment styles of hedge fund mangers. The Van Hedge maintains an extensive database and also provides detailed generic performance information on hedge fund styles. Finally, the CISDM hedge fund database, which presently incorporates both the ZCM/Hedge and the former MAR/Hedge provides a comprehensive coverage of all hedge funds and is the database used in this paper.
It is clear that database providers classify hedge funds in very different ways. All databases have their own indices based on their classifications. Hedge fund categories are all based on self-reported style classifications that are listed in a particular database. None of the databases seem to provide information on the complete hedge fund universe, and they seem to differ in the definition and identification of a hedge fund. The significant variations in the classification methods used across the available databases make it very difficult to conduct careful analysis of the performance of the various hedge fund strategies.
Exhibit 1 provides a complete list of hedge fund strategies and the number of funds within each strategy found in the CISDM database. Exhibit 2 provides summary statistics for the major hedge fund categories over the period January 1990 through December 2003. Mean returns, standard deviations, skewness, kurtosis and the average Sharpe Ratio for each of the strategies are estimated. It is interesting to note that the mean return column provides the most homogeneous results across hedge fund strategies. With the exception of Emerging Markets, most strategies provided a mean annual return between 9 and 14 percent. Standard deviations varied from .018 to .059. Skewness and Kurtosis varied the most and thus, it is likely that these third and fourth moments provided valuable information in our clustering process.
3. Clustering Methodology
Clustering analysis aims at sorting different objects into groups in such a way that the degree of association between two objects is maximal if they belong to the same group and minimal otherwise. This helps organize data into meaningful structures. Cluster analysis consists of a number of different methodologies for grouping objects of a similar kind into groups. Different clustering algorithms define different rules concerning how to cluster the objects into subgroups on the basis of the inter-object similarities. Our goal is to use the clustering methodology to classify funds that display small within cluster variation and large between-cluster variation. It is a data driven technique to objectively classify funds based on the monthly return characteristics of the funds.
The two most common kinds of clustering techniques are Hierarchical and Partitioning techniques. The Hierarchical method performs successive fusions or divisions of the data. Under this method, the allocation of a fund to a cluster is irrevocable. Once a fund joins a cluster it is never removed or fused with other funds belonging to some other cluster. The partitioning method, on the other hand, does not require the allocation of an object to the cluster to be irrevocable. As Dillon and Goldstein [6] show, objects may be reallocated if their initial assignments are found inaccurate and do not optimize the predefined criteria. This method breaks the observations into distinct non-overlapping groups. Different partitioning techniques differ with respect to the following criteria: 1) how clusters are initiated, and 2) how objects are allocated to clusters, 3) how already clustered objects get reallocated to other clusters.
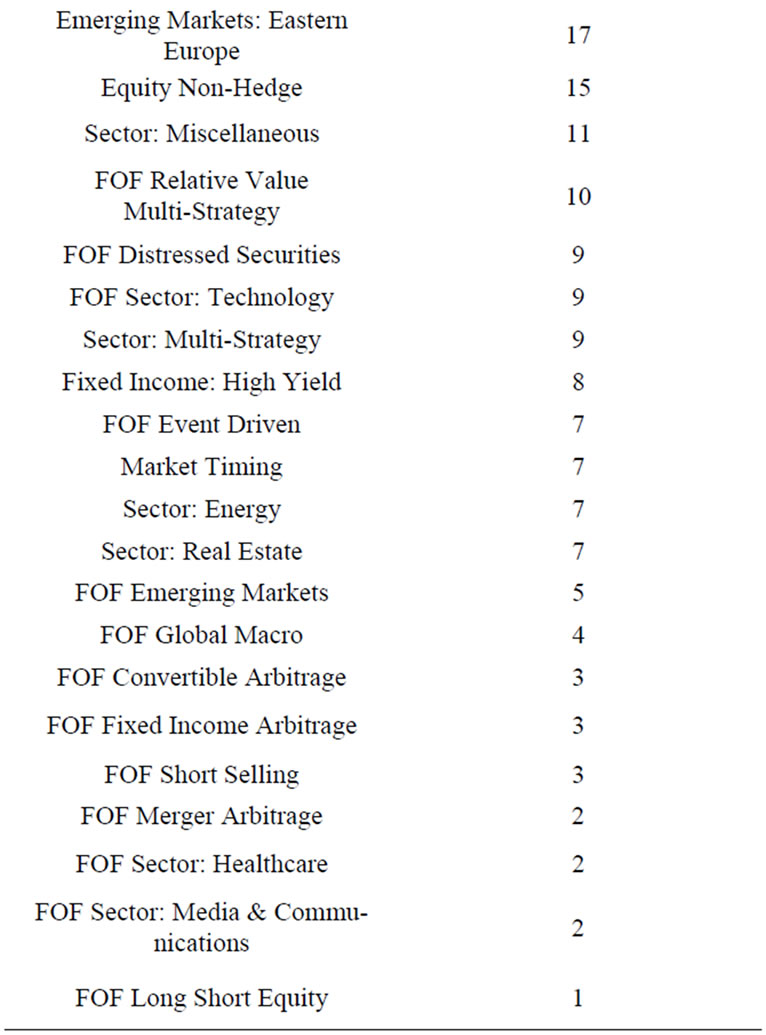
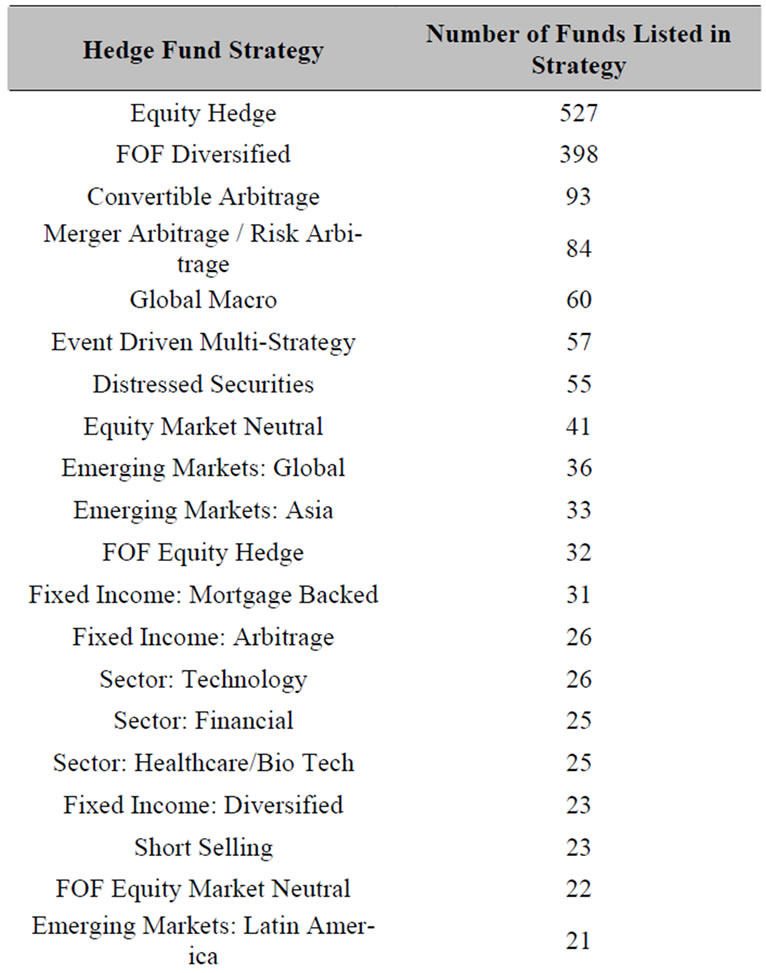
Exhibit 1. Number of funds listed under each hedge fund strategy.
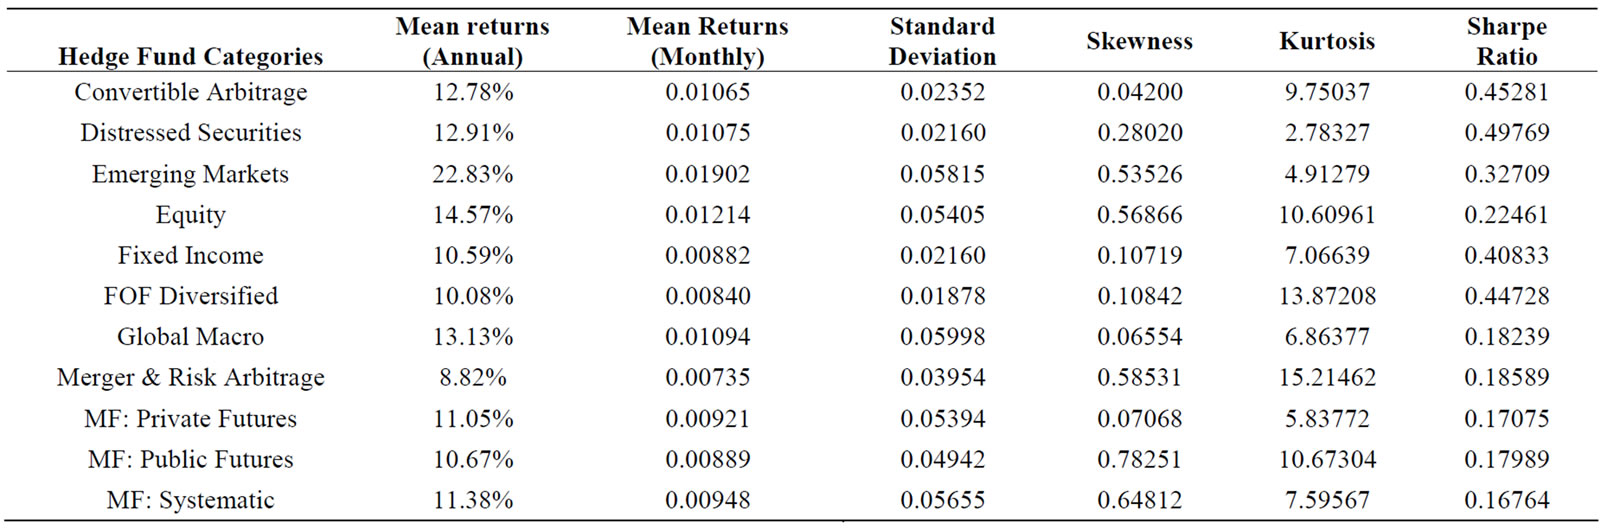
Exhibit 2. Summary statistics and sharpe ratio for major hedge fund strategies.
K-means, K-median, and K-center are a few of the methods that use partitioning techniques to cluster objects. In the following subsection, we describe the Kmeans clustering algorithm. The k-median and k-center techniques are similar in nature. Clustering methodology has been successfully applied to a wide range of research problems, such as in Banfield and Raftery [7], Das [8], Jiang and Zhang [9] and Marathe and Shawky [10].
3.1. K-Means Clustering
K-means is an iterative relocation algorithm in which an initial classification is modified by moving objects from one group to another such that it minimizes the with-in group sum of squares. The k-means algorithm is set up in the following way. Initial reference points, which may or may not be the centroid or mean are chosen and all the data points are assigned to clusters. K-means then uses the cluster centroids as reference points in subsequent partitioning, but the centroids are adjusted both during and after each partitioning. For data point x in cluster i, if centroid ![]() is the nearest reference point, no adjustments are made and the algorithm proceeds to the next data point. However, if centroid
is the nearest reference point, no adjustments are made and the algorithm proceeds to the next data point. However, if centroid  of the cluster j is closer to data point x, then x is reassigned to cluster j. The centroids of the "losing" cluster i, and that of the "gaining" cluster j are recomputed and the reference points
 ![]() and
and  are moved to their new centroids. After each step, every one of the k reference points is a centroid or mean8.
If the data points or objects are tightly clustered around the centroid, the centroid will be representative of all the objects in that cluster. The standard measure of the spread of a group of points about its mean is the variance, or the sum of the squares of the distance between each point and the mean. If the data points are close to the mean, the variance will be small. A generalization of the variance, in which the centroid is replaced by a reference point that may or may not be a centroid, is used to indicate the overall quality of a partitioning. Specifically, the error measure E is the sum of all the variances:
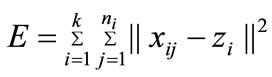
where  the jth point in the ith cluster,
 ![]() is the reference point of the ith cluster, and
is the reference point of the ith cluster, and  is the number of points in that cluster. The notation ||
 -
- ![]() || stands for the distance between
|| stands for the distance between  and
and . Hence, the error measure E indicates the overall spread of data points about their reference points. For best results, E should be as small as possible.
The k-means method requires one to specify the num-ber of clusters in advance. To determine the optimal number of clusters, Hartigan [11] suggested the following rule of thumb. If k is the result of k-means with k clusters and k+1 is the result of k-means with k+1 clusters, then it is justifiable to add the extra cluster when
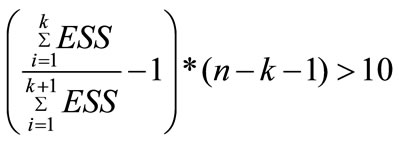
Here ESS represents the error within sum of squares and n is the size of the data set. In our study, we use Hartigan rule of thumb to determine the optimal number of clusters.
3.2. Hierarchical Clustering
The Hierarchical approach is the other most commonly used clustering technique. It performs successive fusions or divisions of the data. One of the distinguishing features of Hierarchical clustering is that once an object is assigned to a cluster, it is never removed from that cluster and fused with other clusters. Agglomerative methods form a series of fusions of the objects into groups whereas divisive methods partition the objects into finer and finer subdivisions. Hence, agglomerative methods eventually result in all objects falling in one cluster and divisive methods finally split the data so that each object forms its own cluster. In either case, the important issue is where to stop. Various agglomerative methods differ to the extent that alternative definitions of distance or similarity are used in the assignment rule. The divisive methods differ in the way initial split is carried out and how the already formed clusters are subdivided9.
In this study we use an agglomerative method proposed by Ward [12] known as the Ward's Error Sum of Squares method. This method attempts to minimize the sum of squares of any two clusters that can be formed at each step. The clustering procedure begins by assigning each object in a separate cluster. Two of the objects are then combined to form a single cluster so that the within cluster sum of squares is minimized. At the next stage, a third object is added to the cluster or two other objects are merged into a new cluster. This process of uniting clusters or objects continues while minimizing the error sum of squares. The cluster center changes each time a new case is added. This might mean that in the end some objects are no longer in the right cluster. The solution given by k-means provides a refinement over this process since the iterative relocation algorithm dynamically minimizes the within cluster sum of squares while maximizing the between cluster variability.
4. Empirical Findings
4.1. K-Means Clustering Results
Exhibit 3 provides the clustering results for the K-means algorithm10. The data was clustered in three different ways: 1) both hedge funds and managed futures are included, 2) only hedge funds are included and 3) only managed futures are included in the analysis. Panel A shows the individual clusters when both hedge funds and managed futures are included. Column 1 gives the number of funds in each cluster. Column 2 shows the number of funds that belong to the dominant strategy, and column 3 gives the percentage of funds in the dominant strategy. Column 4 reports the dominant strategy in each cluster. Columns 5, 6 and 7 provide the mean, standard deviation and skewness of the returns of each cluster11.
The results in Exhibit 3 indicate that of the ten identified clusters, four are classified as Equity Hedge, four are classified as managed futures, one is classified as Emerging Markets and one is classified as FOF. Note that none of the other hedge fund strategies such as Convertible Arbitrage, Fixed Income, Global Macro or Merger Arbitrage appeared as independent clusters12. It is possible that managers in some strategies, such as Global Macro or Merger Arbitrage employ sufficiently different techniques from one another that they do not form an identifiable cluster.
While the large number of funds that belong to the Equity Hedge and the managed futures categories may contribute to the relatively large number of clusters that result for these two strategies, this fact cannot explain why we observe a unique cluster for Emerging Markets and not for Convertible Arbitrage, Merger Arbitrage or Global Macro13. Furthermore, the results in Panel A of Exhibit 3 shows that managed futures are quite different than hedge funds as most CTA clusters are usually dominated by CTA funds.
Panel B of Exhibit 3 presents the identified clusters for the hedge fund industry when managed futures are excluded from the sample. Interestingly, the resulting hedge fund clusters are not very different from the ones obtained before. In this case we obtain seven clusters, four are still Equity Hedge, two are FOF and one Emerging Markets. Further, Panel C provides clustering results separately for the managed futures category. Once again, we obtain four distinct clusters, two clusters classified as Public and two clusters classified as Systematic managed futures.
4.2. Hierarchical Clustering Results
We apply the Hierarchical Clustering approach not only as a viable alternative to the K-means procedure but also as a robustness test on the previously estimated clusters. The results of this approach are presented in Exhibit 4. Panel A of Exhibit 4 shows the resulting clusters when all hedge funds and managed futures are included in the procedure. Similar to the earlier results, we estimate nine clusters; six of them are classified as hedge funds and three are classified as managed futures. Of the six hedge fund clusters, three are classified as Equity Hedge, two are classified as FOF, and one is classified as Emerging Markets.
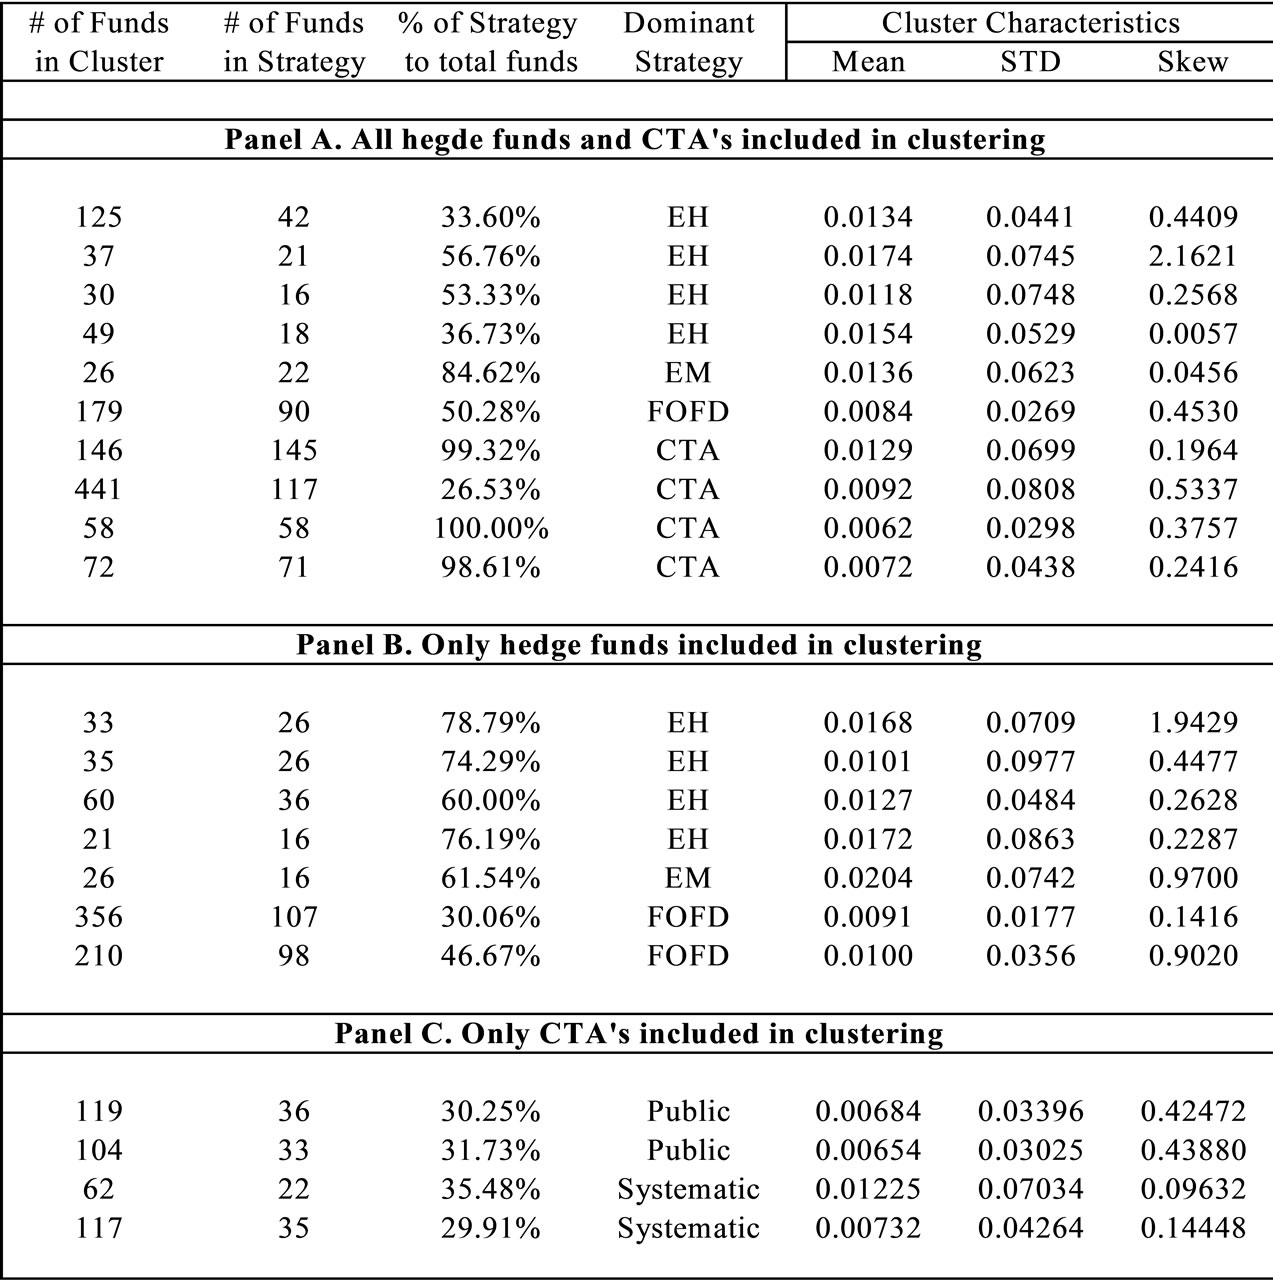
Exhibit 3. Individual cluster characteristics using K-Means Clustering.
Panel B of Exhibit 4 presents the clustering results when we exclude managed futures and only include hedge funds in the analysis. Once again, we obtain six clusters, three are classified as Equity Hedge, two are classified as FOF and one is classified as Emerging Markets. It is important to note the consistency of these results at two different levels. First, within the Hierarchical Clustering procedure, the clusters obtained with and without Managed Futures are essentially identical. Second, across both the clustering procedures, we obtain remarkably similar number of clusters and almost identical classifications when the entire hedge fund database is considered.
Finally, Panel C of Exhibit 4 provides clustering results when managed futures are examined separately. Similar to the K-means results, we obtain four distinct clusters for managed futures. Of these four clusters, two are classified as Public Futures, one is classified as Private Futures, and one is classified as Systematic Futures. Once again, these results are very consistent with earlier results and provide further support for the notion that managed futures funds may be viewed as four distinct categories based on the four major asset classes on which futures contracts are usually traded.
5. Interpretation of Results
5.1. Why Do We Observe Three to Four Equity Hedge Clusters?
It is quite plausible to suspect that the three Equity Hedge Fund clusters represent the range of different strategies, approaches and specialties characteristic of equity hedge fund managers. Some managers add value through knowledge of special asset markets, others through trading skills, and yet others through superior asset pricing models14. Alternatively, the three clusters
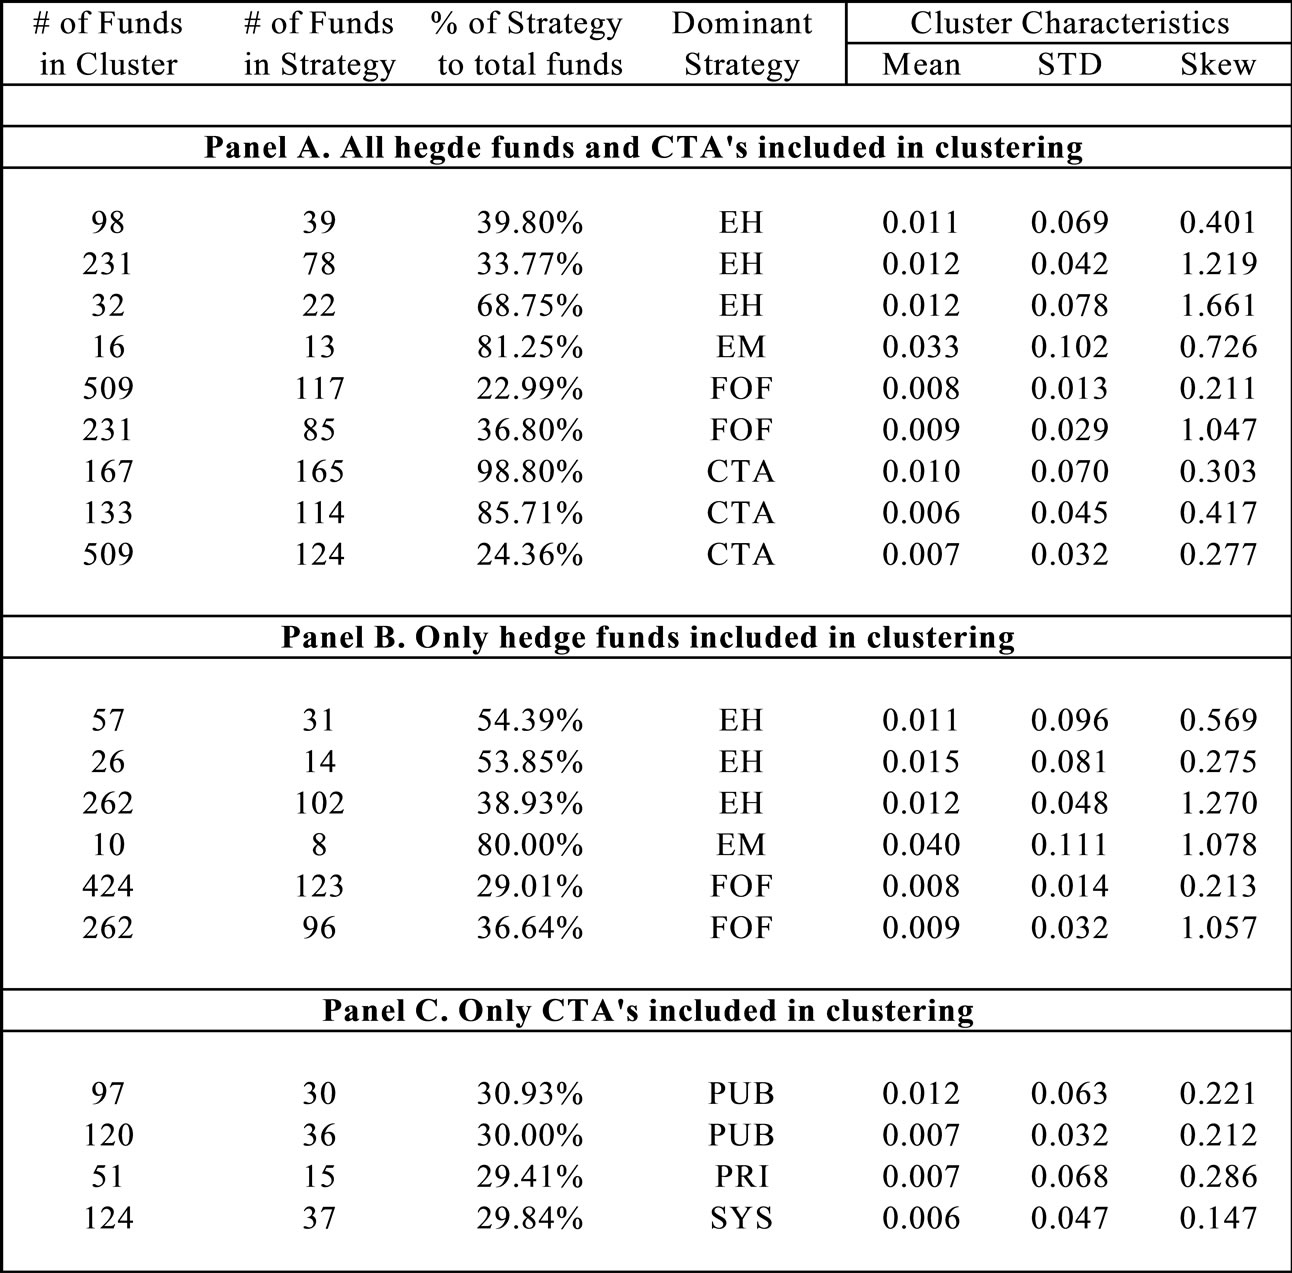
Exhibit 4. Individual cluster characteristics using hierarchal clustering.
may reflect the three broad strategies utilized by equity funds. The three broad strategies are the macro funds, the funds that attempt to uncover undervalued asset opportunities, and the market-neutral relative value arbitrage funds. The macro style funds are the most directional and employ a top-down macro view to take advantage of the expected returns of various asset classes. This class of funds may represent the cluster with the highest level of risk as measured by the high levels of standard deviation and skewness15. The second strategy represents funds that aim to uncover undervalued asset opportunities in debt or equity markets without necessarily being market neutral. This class of funds is characterized by a middle of the range level of risk as measured by the standard deviation and skewness in Exhibits 3 and 4. The third category of funds represents the market-neutral relative value arbitrage funds that aim to exploit temporary price anomalies between related assets, in equities or fixed income markets. This category is likely to be represented by the cluster with the lowest risk among the three Equity Hedge funds clusters.
5.2. Why Do We Observe Two FOF Clusters?
The results in Exhibit 4 with respect to the FOF clusters are very striking. In both Panel A and Panel B, the FOF clusters have comparable mean returns but their stadarddeviation and skewness are vastly different. These results strongly suggest that while FOF is supposed to be diversified across all hedge fund strategies, they seem to organize in two significantly different clusters with respect to risk. Evidently, specialization and philosophy within the FOF category appears to prevail, with one cluster perhaps representing the more risky directional strategies and the other cluster representing market-neutral, and more diversified strategies.
5.3. Why Do We Observe Four Managed Futures Clusters?
The observed four distinct clusters for managed futures are consistent with trading volume data for futures contracts16. Of the approximately total of $8 billion worth of futures and options contracts traded in 2005, $3 billion were on Equity Indices, $2 billion were Interest Rate futures, $1.8 billion in Individual Equities (mostly options), $300 million in Agricultural Commodities, $200 million in Energy, $120 million in currencies and about $100 million in Precious and Non-Precious metals. It is thus quite reasonable to expect that the four clusters we identified correspond to Equity index futures, Fixed Income futures, Options on Individual Equities and Commodity futures. Futures contracts on these four categories are likely to behave quite differently based on the characteristics of their respective underlying assets.
6. Summaries and Conclusions
This paper uses an objective clustering method for style identification of hedge funds. Monthly return data on individual hedge is used to provide a consistent classification of hedge funds. The data driven framework employed in this paper can provide better comparisons among fund categories and may help service providers, fund administrators and investors in identifying common factors that can lead to better diversification strategies. The CISDM database of the University of Massachusetts is used for this application. Our sample included 2397 live funds and covered the period January 1990 through December 2003.
We first estimated hedge fund clusters using the K-means approach. In a three stage procedure, we estimated clusters with and without managed futures, and then separately for managed futures. Of the ten independent clusters estimated with managed futures included, four are classified as Equity Hedge, four are classified as managed futures, and one is classified as Emerging Markets and one as FOF. None of the other hedge fund classifications such as Convertible Arbitrage, Fixed Income, Global Macro or Merger Arbitrage appeared as independent clusters. It is possible that managers in some strategies, such as Global Macro or Merger Arbitrage employ sufficiently different techniques from one another that they do not form an identifiable cluster.
When managed futures were removed from the clustering process, the resulting hedge fund clusters were not very different than before. We identify seven clusters, four are still Equity Hedge, and two are FOF and one Emerging Markets. Furthermore, the results obtained by separately clustering the managed futures category, indicate the presence of four distinct clusters, two of the clusters are classified as Public and the other two clusters are classified as Systematic Managed Futures.
We apply the Hierarchical Clustering procedure to check the sensitivity of the classification provided by the k-means technique. The results of this approach are very similar to the results of the k-means method, which suggests that the classification of funds is robust across different clustering methods. We estimate nine clusters; six of these clusters are classified as hedge funds and three are classified as managed futures. Of the six hedge fund clusters, three are classified as Equity Hedge, two as Fund of Hedge Funds, and one is classified as Emerging Markets. When we exclude managed futures, we obtain six clusters, three are classified as Equity Hedge, and two as Fund of Hedge Funds and one is classified as Emerging Markets. Similar to the K-means results, we obtain four distinct clusters for managed futures. These results provide support for the notion that the futures market may be viewed as four distinct categories based on the four major asset classes on which futures contracts are commonly traded.
The resulting clusters provide important insight as to the characteristics and structure of the hedge fund industry. We surmise that in spite of the very large number of hedge fund classifications within any given database, the strategies may be characteristically described by a rather few broad strategies. Our results indicate that hedge funds can be uniquely categorized into Equity, Managed Futures, Emerging Markets and FOF. Within Equity Hedge, there are three strategies, Macro, Opportunistic and Market-neutral. Managed Futures can also be categorized into four unique classes; Equity index futures, Fixed Income futures, Options on Individual Equities and Commodity futures.
7. References
[1] W. F. Sharpe, “Asset allocation: Management style and performance measurement,” Journal of Portfolio Management, Vol. 18, pp. 7–19, 1992.
[2] W. Fung and D. A. Hsieh, “Empirical characteristics of dynamic trading strategies: the case of hedge funds,” Review of Financial Studies, Vol. 10, No. 2, 1997.
[3] S. J. Brown and W. N. Goetzmann, “Mutual fund styles,” Journal of Financial Economics, Vol. 43, pp. 373–399, 1997.
[4] S. J. Brown and W. N. Goetzmann, “Hedge funds with style,” Journal of Portfolio Management, Vol. 29 (2, winter), pp. 101–112, 2003.
[5] B. Liang, “On the performance of alternative investments: CTAs, hedge funds and funds-of-funds,” Journal of Alternative Investment Management, 2004.
[6] W. R. Dillon and M. Goldstein, “Multivariate analysis methods and applications,” John Wiley and Sons Inc., 1984.
[7] J. D. Banfield and A. E. Raftery, “Ice floe identification in satellite images using mathematical morphology and clustering about principal curves,” Journal of American Statistical Association, Vol. 87, pp. 7–16, 1992.
[8] N. Das, “Hedge fund classification using K-means Clustering method,” International Conference in Computing in Economics and Finance, depts.washington.edu/sce2003/Papers/284.pdf, 2003
[9] D. Jiang, C. Tang, and A. Zhang, “Cluster analysis for gene expression data: A survey,” IEEE Transactions on Knowledge and Data Engineering, Vol. 16, No. 11, pp. 1370–1386, 2004.
[10] A. Marathe and H. Shawky, “Categorizing mutual funds using clusters,” Advances in Quantitative Analysis of Finance and Accounting, Vol. 7, pp. 199–211, 1999.
[11] J. A. Hartigan, “Clustering algorithms,” New York: John Wiley and Sons Inc., 1975.
[12] J. Ward, “Hierarchical grouping to optimize an objective function,” Journal of American Statistical Association, Vol. 58, pp. 236–244, 1963.
[13] V. Faber, “Clustering and the continuous k-means algorithm,” Los Alamos Science, Los Alamos National Laboratory, 1984.
[14] J. A. Hartigan, “Clustering algorithms,” New York: John Wiley & Sons, Inc, 1975.
[15] G.Martin, “Making sense of hedge fund returns: What matters and what doesn’t,” Derivative Strategy, 2000.
NOTES
1Brown and Goetzmann [4] use the TASS data where funds are classified into 17 different types.
2The details of the Generalized Style Classification algorithm are described in Brown and Goetzmann [3]. This procedure resembles switching regression and is also analogues to cluster analysis.
3Martin [15] also argues that cluster analysis is the most applicable technique to use in style classification. His results indicate that eight distinct clusters generate the most useful results.
4Starting in February 2006 however, certain hedge fund advisors have to register with the SEC.
5We use hedge funds to refer to all funds reported in the CISDM, although the CISDM does not classify CTA/futures funds as hedge funds.
6Fund manager name, instead of the management company name, is reported for CTA/Futures funds.
7Unlike mutual funds that are heavily regulated under the Investment Company Act of 1940, hedge funds are not required to file fund information with the SEC.
8For a detailed description of the K-means algorithm and other clustering techniques, see Faber [13], Hartigan [14], and Dillon and Goldstein [6].
9For more detailed discussion on clustering techniques, see Dillon and Goldstein [6].
10We should note that in all our analysis, we eliminated clusters with less than 10 funds as being not statistically reliable or economically meaningful. Eliminating very small clusters did not have any material impact on the results.
11A cluster is classified based on its dominant strategy. For example, a cluster will be classified as Equity Hedge if the largest percentage of its funds is from the Equity Hedge category.
12While Brown and Goetzmann [4] report a striking similarity between the styles they identify and those that are being reported by hedge funds, our results do not show such similarity.
13The number of funds in the Emerging Markets strategy is less than the number of funds in Convertible Arbitrage, Merger Arbitrage or Global Macro.
14Fung and Hsieh [2] characterize hedge fund returns as being determined by three key factors; the returns from the assets held, their trading strategies, and their use of leverage.
15Brown and Goetzmann [3] suggest that an appropriate criterion for evaluating style classifications is the extent to which these classifications can explain cross sectional differences in future year returns.
16Data on Futures Trading Volume is obtained from the Futures Industry Association Website.