International Journal of Communications, Network and System Sciences
Vol.08 No.07(2015), Article ID:58428,12 pages
10.4236/ijcns.2015.87028
EFRED: Enhancement of Fair Random Early Detection Algorithm
Muntadher Abdulkareem1, Kassem Akil2, Ali Kalakech2, Seifedine Kadry3
1Arts, Sciences and Technology University, Beirut, Lebanon
2MIS Department, Lebanese University, Beirut, Lebanon
3Math and Statistics Department, American University of the Middle East, Egaila, Kuwait
Email: skadry@gmail.com
Copyright © 2015 by authors and Scientific Research Publishing Inc.
This work is licensed under the Creative Commons Attribution International License (CC BY).
http://creativecommons.org/licenses/by/4.0/


Received 17 June 2015; accepted 26 July 2015; published 29 July 2015
ABSTRACT
Quality of Service (QoS) generally refers to measurable like latency and throughput, things that directly affect the user experience. Queuing (the most popular QoS tool) involves choosing the packets to be sent based on something other than arrival time. The Active queue management is important subject to manage this queue to increase the effectiveness of Transmission Control Protocol networks. Active queue management (AQM) is an effective means to enhance congestion control, and to achieve trade-off between link utilization and delay. The de facto standard, Random Early Detection (RED), and many of its variants employ queue length as a congestion indicator to trigger packet dropping. One of these enhancements of RED is FRED or Fair Random Early Detection attempts to deal with a fundamental aspect of RED in that it imposes the same loss rate on all flows, regardless of their bandwidths. FRED also uses per-flow active accounting, and tracks the state of active flows. FRED protects fragile flows by deterministically accepting flows from low bandwidth connections and fixes several shortcomings of RED by computing queue length during both arrival and departure of the packet. Unlike FRED, we propose a new scheme that used hazard rate estimated packet dropping function in FRED. We call this new scheme Enhancement Fair Random Early Detection. The key idea is that, with EFRED Scheme change packet dropping function, to get packet dropping less than RED and other AQM algorithms like ARED, REM, RED, etc. Simulations demonstrate that EFRED achieves a more stable throughput and performs better than current active queue management algorithms due to decrease the packets loss percentage and lowest in queuing delay, end to end delay and delay variation (JITTER).
Keywords:
QoS, Quality of Service, Active Queue Management, EFRED Algorithm, Fair Random Early Detection, Congestion Control

1. Introduction
Congestion control is one of the most important problems in the Internet. Most of the existing Internet routers play a passive role in congestion control because the ever fast development of network technology and new network applications augment the Quality of Service (QoS) requests from network users. Although the majority of the traffic over the Internet is still TCP-based, the increasing growth and deployment of UDP based real time applications such as voice over IP and video-conferencing bring in solemn congestion problem at the intermediate nodes. In an attempt to foil congestion and control the queue length, Active Queue Management (AQM) techniques make use of sending congestion signals in a proactive manner. The essence is that an AQM router may intelligently drop packets before the queue overflows.
The main objective of this thesis is to realize a study about the existing AQM [1] like RED [2] , FRED [3] etc… The results of this study will be of use later in order to develop a new algorithm based on the studied algorithms. In order to attain our main objective, we start this thesis by studying and exploring the QoS metrics that can be used in order to compare the different AQM algorithms existing on the market. In second place, we have studied in depth these AQM algorithms in order to deduce the weaknesses and the advantages of each of them. This study has shown that each algorithm has its own advantages with respect to others. For example, FRED protects fragile flows by deterministically accepting flows from low bandwidth connections and fixes several shortcomings of RED by computing queue length during both arrival and departure of the packet. FRED algorithm focuses on the management of per-flow queue length.
In our work, we have modified the drop function adopted by FRED and replaced it by the hazard function. This new algorithm, which we have called EFRED (Modified FRED) is implemented and tested using the NS2 simulator.
The results obtained by simulation show that our EFRED algorithm achieves higher throughput and minimum loss compared with other existing mechanisms such as RED and REM.
2. Active Queue Management
The ever fast development of network technology and new network application augment the Quality of Service (QoS) requests from network users. Although the majority of the traffic over the Internet is still TCP-based, the increasing growth and deployment of UDP based real time applications such as voice over IP and video-conferencing bring in solemn congestion problem at the intermediate nodes. In an attempt to foil congestion and control the queue length, Active Queue Management (AQM) techniques make use of sending congestion signals in a proactive manner. Even though there are several mechanisms to improve the fairness of the Internet and to suppress the unresponsive flows from monopolizing the available network resources, the respective problems of unresponsive flows detection and their impact on the performance of AQM still leave space for further developing in this research direction. Active Queue Management (AQM) mechanisms are link algorithms and are deployed inside the network, i.e. in the routers, to regulate the flows. By sending congestion signals in a proactive manner, an AQM technique makes attempt to prevent congestion and control the queue length. This would finally cause the senders to reduce the sending rates. An AQM scheme may mark or drop the packets depending upon the policy at the router [4] .
An AQM scheme can detect congestion based on
・ The queue length at the link
・ The arrival rate of the packets at the link
・ Combination of both
In addition to this, most of the AQM schemes include adapting the marking probability in some other way.
Active queue management (AQM) is advocated to improve the quality of services (QoS) for Internet. Active queue management (AQM) refers to a family of packet dropping mechanisms for router queues that has been proposed to support end-to-end congestion control mechanisms in the Internet.
AQM has been designed to support end-to-end congestion control in packet networks. The principle of AQM is to pro-actively drop packets in a router in anticipation of congestion. Such packet losses are further interpreted (through acknowledgements or timeouts) by TCP sources as a request to reduce their sending rates TCP and UDP loss rate. Loss rate is defined as the number of dropped packets divided by the total number of packets arrived at the router’s input ports. While TCP good put and loss rate are somewhat redundant metrics, loss rate covers a very important role for applications using UDP. We choose to differentiate between TCP and UDP loss rates to verify AQM mechanisms’ behavior against different kind of traffic sources.
The Internet depends on the cooperation between TCP senders and subnet routers to adjust the source data rates in the presence of network congestion along the path of the TCP flow. Currently, buffer management schemes are used in the Internet routers to indicate congestion to edge hosts, while the buffer management algorithms can be classified into two categories: Passive Queue Management (PQM) and Active Queue Management (AQM).
Active queue management is the pro-active approach of informing you about congestion before a buffer overflow occurs. AQM is done using Dynamic buffer limiting (DBL). DBL tracks the queue length for each traffic flow in the switch. When the queue length of a flow exceeds its limit, DBL will drop packets or set the Explicit Congestion Notification (ECN) bits in the packet headers.
DBL classifies flows in two categories:
・ Adaptive: flows reduce the rate of packet transmission once it receives congestion notification.
・ Aggressive: flows do not take any corrective action in response to congestion notification.
Queue length is measured by the number of packets. The number of packets in the queue determines the amount of buffer space that a flow is given. When a flow has a high queue length the computed value is lowered. This allows new incoming flows to receive buffer space in the queue. This allows all flows to get a proportional share of packets through the queue.
3. EFRED: Enhancement Scheme for Active Queue Management
Different algorithms are developed for Active Queue Management like Drop Tail [5] , REM [6] , Blue [7] , SFQ [8] , and RED, and FRED to achieve these Goals: 1) reduce the packets loss rate; 2) reduce the end to end delay; 3) increase the actual rate sending over the bandwidth called throughput; 4) reduce the time interval between two sequence packets called (delay Variation). We introduce a new idea to reduce the packets loss rate and achieve the other goals of AQM. The idea depends on the enhancement of the FRED algorithm by replace the hazard rate estimated packets dropping function in FRED, we call this new algorithm EFRED algorithm.
3.1. The Hazard Function
The hazard function [9] is the conditional density function of failure at time t, given that the unit has survived until time t. Therefore, letting X denote the random variable and x denote the realization,
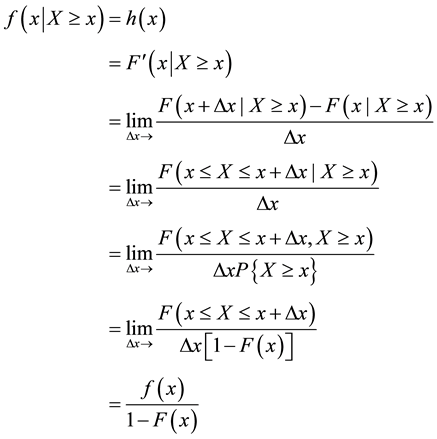
It turns out that specifying a hazard function completely determines the cumulative distribution function (and vice-versa).
3.2. The Failure Rate for the Weibull Distribution
For the Weibull distribution [10] , the hazard function is
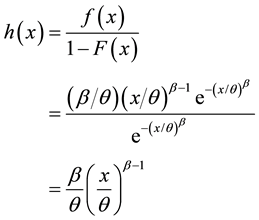
Note that if β = 1 the Weibull hazard function is constant. This should be no surprise, since for β = 1 the Weibull distribution reduces to the exponential. When β > 1, the Weibull hazard function increases, approaching ∞ as β → ∞. Consequently, the Weibull is a fairly common choice as a model for components or systems that experience deterioration due to wear-out or fatigue. For the case where β < 1, the Weibull hazard function decreases, approaching 0 as β → 0. For comparison purposes, note that the hazard function for the gamma distribution with parameters r and λ is also constant for the case r = 1 (the gamma also reduces to the exponential when r = 1). Also, when r > 1 the hazard function increases, and when r < 1 the hazard function decreases. However, when r > 1 the hazard function approaches λ from below, while if r < 1 the hazard function approaches λ from above. Therefore and before plunging into details of the study, we need to clarify and briefly explain about some important concepts that would make a clear background and introductory presentation for this topic. Even though the graph of the gamma and Weibull distributions look very similar, and they can both produce reasonable fits to the same sample of data, they clearly have very different characteristics in terms of describing survival or reliability data. Finally we can simplify hazard function for Weibull distributions as h(x) = cxc−1.
4. EFRED Algorithm
Fair Random Early Detection (FRED) keeps state based on instantaneous queue occupancy of a given flow. FRED protects fragile flows by deterministically accepting flows from low bandwidth connections and fixes several shortcomings of RED by computing queue length during both arrival and departure of the packet. FRED algorithm focuses on the management of per-flow queue length. The FRED algorithm has an O (N) space requirement (N = buffer size), which was one of the major advantages compared with per-flow queuing mechanisms (e.g. Fair Queuing). But with today’s memory price, it turned out space requirement is not an important factor. The computational resources required for each packet is more significant. For each arriving packet, FRED need to classify the packet into a flow, update flow information, and calculate average queue length (also done when a packet is departing), and deciding whether to accept or drop the packet. Although optimizations can be employed to simplify the per-flow operation, it’s not clear whether it can be cost-effectively implemented in backbone routers. The implementation issue is not unique to per-flow algorithms, but also applies to algorithms like RED. We choose the FRED algorithm because FRED achieves the fairness and high link utilization by share the buffer size among active flows. It is also easy to configure, and adapt itself to preserve performance under different network environments (different bandwidth, buffer size, flow number) and traffic patterns (non-adaptive flows, robust adaptive flows, and fragile flows). From the study of the FRED character, we see the dropping probability of a flow depends on the number of buffered packets from that flow, so in some case the drop probability began high thus cause increasing in packets loss. So we propose to simply replace the hazard rate estimated packet dropping function in FRED. The rest of the original FRED remains unchanged. We call this new scheme EFRED. Simulations demonstrate that EFRED achieves a higher and more stable throughput than RED and other efficient variants of AQM algorithms and low in delay between packets (that called JITTER [12] ). Since EFRED is fully compatible with FRED, we can easily upgrade/replace the existing FRED implementations by EFRED in network simulator NS2 [11] . EFRED idea came from the combination of the hazard function and the FRED algorithm see Figure 1, Figure 2
We make some major changes to the FRED algorithm and call the new algorithm EFRED. An important advantage of our algorithm EFRED is that one can change the probability value p via the use of the hazard function h(x) = cxc−1. Let T and qlen denote the target value and the queue length, respectively. In order to stabilize the queue length against high congestion levels, we use c = 3, c = 2 and again c = 3 in the hazard function for the cases where minth < qlen < T, T < qlen < maxth and maxth < qlen < 2* maxth, respectively. The pseudo code for EFRED algorithm is illustrated in Figure 2.

Figure 1. EFRED scheme.
5. EFRED: Simulation and Results
In this section, we discussed about network configuration used over the network simulator NS-2 to simulate the algorithms RED, SFQ, REM, DropTail, BLUE, ARED, RIO, FRED, and EFRED and after that we analyzed about the results obtained from our simulations. The algorithms compared here are first deployed into the ns2 architecture then following simulation scenario has been generated to compare their performance on the simulation setting.
There are five nodes at each side of the bottleneck link. Here five nodes are acting as a TCP source and five nodes are acting as a TCP sink so that both routers are applying the congestion control algorithm. There is two- way traffic in the system. We consider the network scenario as shown in Figure 3. We simulate this network on ns2 for different AQM algorithms RED, SFQ, REM, DropTail, BLUE, ARED, RIO, FRED, and EFRED for same network parameters as given in Table 1 except to the bottleneck link. We simulated these algorithms RED, SFQ, REM, DropTail, BLUE, ARED, RIO, FRED, and EFRED on the same bottleneck link R1-R2. Firstly we consider the bottleneck link to 5 Mbps for each considered AQM algorithm. We considered a fixed packet size of 1 KB and buffer capacity of 30 KB throughout the simulation. Round trip delay for each link has been displayed in Table 1. To metric the EFRED algorithm performance with RED, SFQ, REM, DropTail, BLUE, ARED, RIO and FRED and prove our algorithm (EFRED) is better than other AQM algorithms. The performance parameters are used:
1) Packets loss rate.
2) Throughput.
3) End to end delay.
4) JITTER.
5) Average Queuing Delay.
6) Link Utilization.
Our algorithm is consisting of two parts, the first part is the header file of EFRED algorithm and the second part is the body of the EFRED algorithm. After we write a code and added it to NS2 Architecture and compiled this code and make the new algorithm is valid under Ns2 Architecture.
6. Analysis of the Result
Our algorithm is consisting of two parts, the first part is the header file of EFRED algorithm and the second part is the body of the EFRED algorithm. After we write a code and added it to NS2 Architecture and compiled this code and make the new algorithm is valid under Ns2 Architecture…
6.1. Packet Loss Rate
When we use these algorithms DT, RED, ARED, BLUE, REM, RIO, FRED, SFQ and EFRED and run the LossRatemyfirst_sen_3tcpco.tcl, then the result we get from this test will be as in Table 2 and Figure 4 and Figure 5.
The majority of this parameter is take the rate of dropping packet by divide the number of drop packet over

Figure 2. EFRED flowchart.

Figure 3. Topology used.

Figure 4. Diagram when use packet loss―part 1.
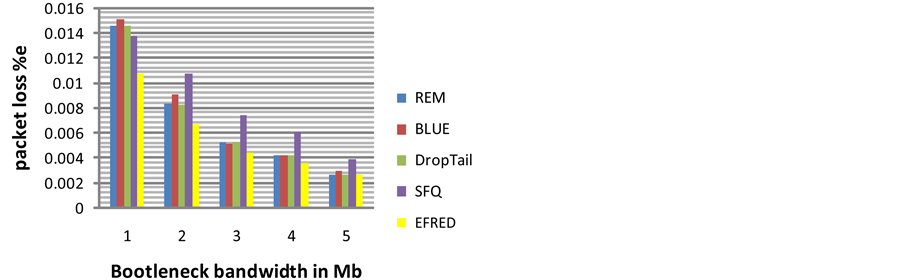
Figure 5. Diagram when use packet loss―part 2.

Table 1. parameters are used in dumpbell topology.
Table 2. Results when use packets loss parameter―part 1.
the total send packets. It is very important parameter to evaluate the AQM. In Figure 4 we can notes our algorithm (EFRED) is the best algorithm with compare to RED, ARED, FRED and RIO because it have the minimum value of drop packet rate, and we can notes the second best algorithm after the EFRED is RIO.
The majority of this parameter is take the rate of dropping packet by divide the number of drop packet over the total send packets. It is very important parameter to evaluate the AQM.
In Figure 5 we can notes our algorithm (EFRED) is the best algorithm with compare to REM, Blue, DropTail and SFQ because it have the minimum value of drop packet rate, and we can notes the second best algorithm after the EFRED is DropTail.
6.2. Throughput
When we use these algorithms DT, RED, ARED, BLUE, REM, RIO, FRED, SFQ and EFRED and run the through put 2 ensultimatie.tcl, then the result we get from this test will be as in Table 3 and Figure 6 and Figure 7.
The majority of this parameter is take the total size of arriving packets in received node over the time period from the first sending packets to the last packet received on the received node. This parameter show the actual rate is send from the source to destination. In Figure 6 we can notes our algorithm (EFRED) is in some time better and in other time is not good, but we can notes the better one to achieve the higher throughput is RED.
The majority of this parameter is take the total size of arriving packets in received node over the time period from the first sending packets to the last packet received on the received node. This parameter show the actual rate is send from the source to destination. In Figure 7 we can notes our algorithm (EFRED) is in some time

Figure 6. Result diagram when use throughput parameter―part 1.

Figure 7. Result diagram when use the throughput parameter― part 2.
Table 3. Results when use Throughput parameter―part 1.
better and in other time is not good, but we can notes the better one to achieve the higher throughput is SFQ.
6.3. End to End Delay
When we use these algorithms DT, RED, ARED, BLUE, REM, RIO, FRED, SFQ and EFRED and run the delay- e2ensultimatie.tcl, then the result we get from this test will be as in Table 4 and Figure 8 and Figure 9.
The majority of this parameter is taken the average total time from source to destination, it is an important parameter. In Figure 8 we can note our algorithm (EFRED) is the better then RED, ARED, FRED and RIO, because it have the minimum value of end to end delay in time and we can note also the second one best after our algorithm is RED in sometime and ARED in other sometime.
The majority of this parameter is taken the average total time from source to destination, it is an important parameter. In Figure 9 we can note our algorithm (EFRED) is the better then REM, Blue, DropTail and SFQ, because it have the minimum value of end to end delay in time and we can note also the second one best after our algorithm is SFQ.
6.4. Jitter
When we use these algorithms DT, RED, ARED, BLUE, REM, RIO, FRED, SFQ and EFRED and run the jitermyfirst_sen_3tcpco.tcl, then the result we get from this test will be as in Table 5 and Figure 10 and Figure 11.
The majority of this parameter is taken the average total JITTER from source to destination, its means the delay variation between sequence packets, also it is important parameter. In Figure 10 we can note our algorithm (EFRED) is the better then RED, ARED, FRED and RIO, because it have the minimum value of delay variation between sequence packet (JITTER) and we can note also the second one best after our algorithm is RIO.
The majority of this parameter is taken the average total JITTER from source to destination, its means the delay variation between sequence packets, also it is important parameter. In Figure 11 we can note our algorithm (EFRED) is the better then REM, Blue, DropTail and SFQ, because it have the minimum value of delay variation between sequence packet (JITTER) and we can note also the worst algorithm in JITTER is SFQ.
6.5. Average Queuing Delay
When we use these algorithms DT, RED, ARED, BLUE, REM, RIO, FRED, SFQ and EFRED and run the delay-linknsultimatie.tcl, then the result we get from this test will be as in Table 6 and Figure 12 and Figure 13.
Queue Delay is very important characteristic to determine that how well the active queue management of the congestion control algorithm has been working, the majority of this parameter is measure the time from instant enter the packet to the queue to the instant of leave the packet queue. In Figure 12 we can note our algorithm (EFRED) is the better then RED, ARED, FRED and RIO, because it have the minimum value of Queuing delay and we can note also the worst algorithm in Queuing delay is RIO.
The majority of this parameter is measure the time from instant enter the packet to the queue to the instant of leave the packet queue. In Figure 13 we can note our algorithm (EFRED) is the better then REM, Blue, DropTail and SFQ, because it have the minimum value of Queuing delay and we can note also the worst algorithm in Queuing delay is Blue.

Figure 8. Result diagram when use the throughput parameter―part 2.

Figure 9. Result diagram when uses end to end delay parameter―part 2.

Figure 10. Result diagram when uses average JITTER parameter―part 1.

Figure 11. Result diagram when uses Average JITTER parameter―part 2.

Figure 12. Result diagram when uses average queuing delay― part 1.

Figure 13. Result diagram when uses Average queuing delay― part 2.
Table 4. Results when uses end to end delay parameter―part 1.
Table 5. Results when uses average JITTER parameter―part 1.

Figure 14. Result diagram when uses link utilization parameter ― part 1.

Figure 15. Result diagram when uses link utilization parameter ―part 2.
Table 6. Results when uses Average Queuing delay―part 1.
Table 7. Results when uses Link utilization parameter―part 1.
6.6. Link Utilization
When we use these algorithms DT, RED, ARED, BLUE, REM, RIO, FRED, SFQ and EFRED and run the linkutilizationnsultimatie.tcl, then the result we get from this test will be as in Table 7 and Figure 14 and Figure 15.
The majority of this parameter is how the algorithm can achieve higher link throughput over the time these called link utilization. In Figure 14 we can note our algorithm (EFRED) is the worst then RED, ARED, FRED and RIO, because it have the minimum value of link utilization % and we can note also the best algorithm is RIO.
The majority of this parameter is how the algorithm can achieve higher link throughput over the time these called link utilization. In Figure 15 we can note our algorithm (EFRED) is the worst then REM, Blue, DropTail and SFQ, because it have the minimum value of link utilization and we can note also the best algorithm is SFQ.
7. Conclusion
In this paper we present the proposal EFRED algorithm on the TCP protocol under Linux platform and we compare the result with the other algorithms like RED, ARED, FRED, DropTail, REM, Blue, RIO and SFQ with different quality of service parameter like throughput, packet loss rate, end to end delay, JITTER, average queuing delay and etc. we conclude our algorithm is better from side of packet loss, end to end delay, queuing delay, JITTER, and worst from side throughput and link utilization.
Cite this paper
MuntadherAbdulkareem,KassemAkil,AliKalakech,SeifedineKadry, (2015) EFRED: Enhancement of Fair Random Early Detection Algorithm. International Journal of Communications, Network and System Sciences,08,282-294. doi: 10.4236/ijcns.2015.87028
References
- 1. Abbasov, B. and Korukoglu., S. (2009) An Active Queue Management Algorithm for Reducing Packet Loss Rate. Mathematical and Computational Applications, 14, 65-72.
- 2. Athuraliya, S., Li, V.H., Low, S.H. and Yin, Q. (2001) REM: Active Queue Management. IEEE Network, 15, 48-53. http://dx.doi.org/10.1109/65.923940
- 3. Balchunas, A. (2010) Introduction to QoS. Aaron Balchunas. http://www.routeralley.com/
- 4. Braden, B.A. (1998) Recommendations on Queue Management and Congestion Avoidance in the Internet. RFC 2309, April.
- 5. Chan, M.-K. and Hamdi, M. (2003) An Active Queue Management Scheme Based on a Capture-Recapture Model. IEEE Journal on Selected Areas in Communications, 21, 572-583.
http://dx.doi.org/10.1109/JSAC.2003.810499 - 6. Cisco Systems Inc. (2010) Catalyst 4500 Series Switch Cisco IOS Software Configuration Guide. Cisco Press, San Jose.
- 7. Feipeng, L. (2011). Drop Tail and RED—Two AQM Mechanisms. www.roman10.net
http://www.roman10.net/drop-tail-and-redtwo-aqm-mechanisms/ - 8. Feng, W.-C., Kandlur, D.D., Saha, D. and Shin, K. G. (1999) BLUE: A New Class of Active Queue Management Algorithms. Technical Report CSE-TR-387-99, Dept. of EECS, University of Michigan, April.
- 9. Floyd, S. and Jacobson, V. (1993) Random Early Detection Gateways for Congestion Avoidance. IEEE/ACM Transactions on Networking, 1, 397-413. http://dx.doi.org/10.1109/90.251892
- 10. Thiruchelvi, G. and Raja, J. (2012) Active Queue Management Based Adaptive Flow Control Mechanism for Unresponsive Flows. European Journal of Scientific Research, 70, 67-80.
- 11. Thiruchelvi, G. and Raja, J. (2008) A Survey on Active Queue Management Mechanisms. IJCSNS International Journal of Computer Science and Network Security, 8, 130-145.
- 12. Kadry, S. (2011) A New Proposed Technique to Improve Software Regression Testing Cost. arXiv preprint arXiv:1111.5640.