Int'l J. of Communications, Network and System Sciences
Vol.6 No.1(2013), Article ID:27454,8 pages DOI:10.4236/ijcns.2013.61004
Optimizing Operating Cost of an Intrusion Detection System
1Department of Computer Science, College of Engineering Roorkee, Roorkee, India
2Department of Information and Communication Technologies, Atal Bihari Vajpayee-Indian Institute of Information Technology & Management, Gwalior, India
Email: *ushaban@gmail.com, kvarya@iiitm.ac.in
Received November 5, 2012; revised December 3, 2012; accepted December 15, 2012
Keywords: Decision Tree; Intrusion Detection; Metrics; Measurements; Receiver Operating Characteristics
ABSTRACT
Very often it so happens that the cost of operating an Intrusion Detection System (IDS) exceeds the cost of purchasing the IDS itself. In such cases, regular operation and maintenance of the system becomes expensive. Thus, it becomes essential to reduce the operating cost of the IDS without compromising on the performance and reliability of the IDS. Apart from the initial cost of procuring the IDS, other costs include cost of accessories required and cost of administration etc. In this paper we calculate the cost benefit tradeoffs of an IDS. We propose a method to determine the optimum operating point of the IDS. In an effort to solve the problems of the previously proposed metrics, we propose a decision tree based approach to calculate the cost of operating an IDS in a mobile ad hoc network. Mathematically and programmatically we deduce the minimum operating point of operation of an IDS and generate the receiver operating characteristic curve of the IDS. To further ascertain this, we use available network packet capture data and calculate the minimum operating cost of an IDS. The main motive behind this paper is to show that the cost of operating an IDS in a MANET can be minimized and hence the effectiveness and performance of the IDS can be maximized.
1. Introduction
As the complexity and volume of computer networks are increasing, it is becoming increasingly difficult to detect and thwart intrusions in networks. The number of such threats and intrusions are increasing and are posing a problem to both corporations and nations [1]. Intruders continue to use more sophisticated techniques to illegally gain access to systems [2] and cause loss of data. Thus, it is essential to be able to guard our networks against such malicious intrusions using Intrusion Detection Systems (IDS). An Intrusion Detection System (IDS) detects an unwanted or malicious element in any network and is able to generate alarms and alerts to the network administrator. The primary task of an IDS is be able to judge an intrusion as normal or malicious. This is usually done with the help of an attack vector. An attack vector can be defined as the path or method by which the malicious element intrudes into the network. The evaluation of Intrusion Detection Systems began in the year 1998 when Lincoln Laboratory in Massachusetts Institute of Technology conducted an evaluation and analysis of IDS sponsored by DARPA [3]. This evaluation is known as DARPA’s 1998 off-line intrusion detection evaluation. Different versions of this evaluation have been published by Durst et al. [4], McHugh [5] and Stolfo et al. [6]. In Mobile ad hoc network (MANET) security attacks on routing information [7], exhausting nodes resources, maliciously manipulating data traffic is primarily caused by lack of network infrastructure. Intrusion detection systems for MANETs are usually designed in two layers, primary IDS and secondary IDS. These components communicate across the network. The primary IDS are centralized while the secondary IDS are distributed and are responsible for data gathering, data reduction, detection, and response. The secondary IDS also forwards successful detections to the primary IDS. The primary IDS consists of only an analysis component. Sensors collect audit information and convert it to a common event format. The packager component performs data reduction by grouping the events into sessions. The analysis component uses these sessions to create detectors. The detector component matches current sessions to its detectors. Finally, the response component automatically responds to attacks. The purpose of having two layers of defense is that in case of failure to catch a malicious event by one layer is handled by the second layer.
There are several available metrics available for evaluating the performance of IDS. Each of the available metrics have their own contribution towards the analysis of IDS. Yet they are rarely applied in the literature when proposing a new metric for an IDS. There are two main reasons for this discrepancy: firstly, each metric is proposed in a different framework for example in information theory, decision theory, cryptography etc. and in a seemingly ad hoc manner. Therefore, an objective comparison between the metrics is very difficult. The second reason is that the proposed metrics usually demand the knowledge of some uncertain parameters like the likelihood of an attack, or the costs of false alarms and missed detections. However, these uncertain parameters can also change during the operation of an IDS. Therefore the evaluation of an IDS under some (possibly wrongly) estimated parameters might not be of much value.
For an IDS to be cost effective it should cost less than the expected number of intrusions it will handle. This requires a correct balance between the operating costs, damage costs, cost of response and also their effects on computing resources and constraints. Usually while dealing with IDS we tend to ignore the cost component and focus more on its ability to deal with intrusions.
The rest of the paper is organized as follows. In Section 2, we discuss prior work done in the area of metrics to evaluate IDSs. Section 3 deals with ROC for evaluating IDS followed by Section 4 which analyzes the decision tree approach to evaluate IDS. Section 5 calculates the operating cost of the IDS using decision tree approach and shows that the operating cost is a minimum for optimum performance. In Section 6 we discuss data sets available to evaluate IDS followed by results and discussions in Section 7.
2. Prior Work
The performance of an IDS is the capability of its detecting a malicious element successfully. The performance is directly related to the reliability of the IDS. In order to compare the performance characteristics of different IDS’s, we need metrics or measuring units which could quantitatively measure the capabilities of intrusion detection of such systems. Till date several metrics have been proposed to evaluate IDS. However, before being able to measure the performance of these IDS’s, it is important to study and analyze the behavior o the IDS itself. The basic metric or assessing the performance of IDS is its accuracy. Resilience is another commonly used metric to measure the capabilities of an IDS. Resilience is a measure of how the IDS reacts to attacks and malicious elements and how it is able to thwart attacks towards the IDS itself.
The most commonly used metrics used to define the performance of an IDS are its ability to distinguish between a malicious element and a normal event. False Positive Rate (FP) is define d as the probability that the IDS generates an alarm although the behavior of the network is completely normal. False Positive Rate is also called Type I error. False Negative Rate (FN or Type II Error) is the probability that the IDS does not generate an alarm in the presence of malicious behavior [8].
When developing metrics for an IDS, there is always a trade-off between false positive rate and false negative rate. By increasing the number of false positives the IDS becomes more sensitive and conversely the IDS becomes more risky if more false negatives are ignored. Thus, it is important to strike a balance between false negatives and false positives while choosing a configuration for an IDS. Another useful metric for an IDS is Sensitivity. Sensitivity is defined as the ratio or proportion of normal behavior. A sensitivity value of 1 indicates that all malicious elements are detected. However, this is not desired as this is essentially achieved by terming all behavior as malicious. In such cases another metric called specificity is needed. Specificity is defined as the ratio or proportion of true negatives. Specificity alone as a metric is not useful by itself. Unit specificity can be achieved by classifying all events are normal and putting the system into high risk. Thus, another metric called F measure is used and is defined as the harmonic mean of sensitivity and specificity.
3. ROC
Receiver Operating Characteristic (ROC) curve describes the relationship between the two parameters of an IDS, its probability of detection, (1 − β), and its false alarm probability, α. The ROC curve displays the (1 − β) provided by the IDS at a given α. It also displays the α provided by the IDS at a given (1 − β). The ROC curve summarizes the performance of the IDS. Graf et al. [9] had drawn ROC curves from actual data in the 1998 DARPA off-line intrusion detection evaluation. While comparing ROC curves of two different IDS’s, [10] with different operating points, it becomes very important and critical to choose the correct operating point. Gaffney and Ulvila [11] have shown that one would never choose to operate an IDS at an interior point on the line segment connecting two operating points.
There are only two possible options for reports coming from the IDS. First if when the IDS will respond as though there were an intrusion (R) or second if the IDS do not respond (NR). Any combination of the above two parameters result in increased cost of errors. Let us assume that the cost of responding as though there were an intrusion when there is none is denoted Cα and let Cβ be the cost of failing to respond. Thus, we can define a Cost Ratio as .
.
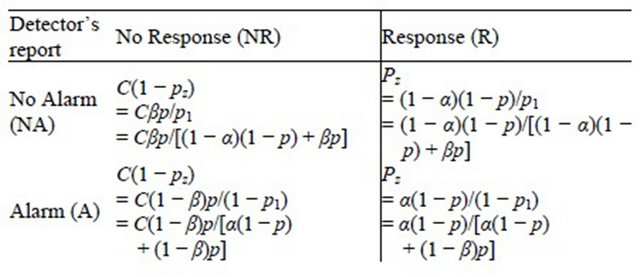
In reality, however, these costs are complex as the possible number of combinations of the above mentioned two causes are huge. The expected cost of an IDS can be depicted using a decision tree. The convention of reading the tree is from left to right. This decision tree shows the sequence of actions (squares) and uncertain events (circles) that describe the operation of the IDS and of the actions or responses that can be taken, based on reports. It also shows the consequences of the combinations of actions and events. The costs shown correspond to the consequences.
A probability distribution represents the uncertainty about which branch of the tree will happen following an event node. Each uncertain event is associated with the probability of its occurrence. There are three probabilities specified in the tree:
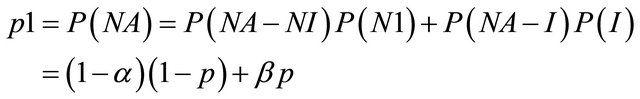
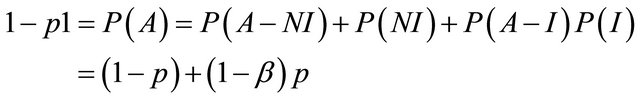
p1 = the probability that the IDS reports an alarm;
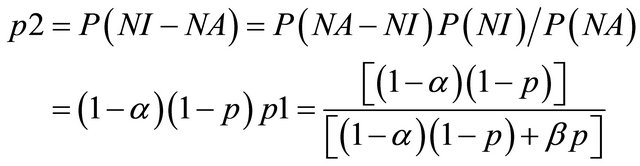
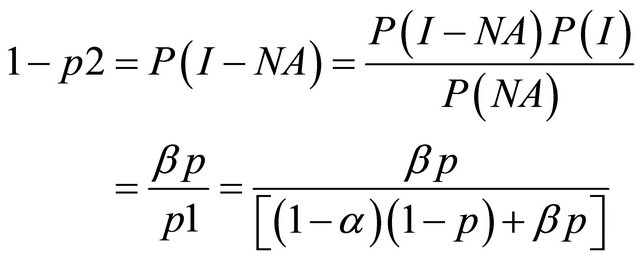
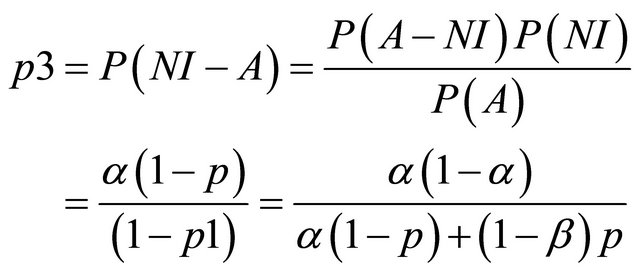
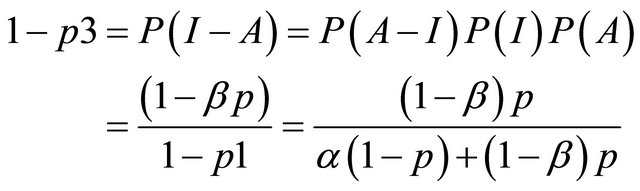
p2 = the conditional probability of intrusion given that the IDS generates an alarm; and p3 = the conditional probability of intrusion given that the IDS generates no alarm.
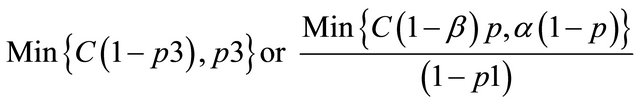
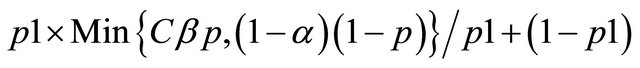
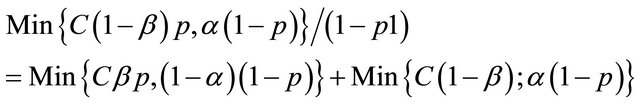
[11] have shown that these probabilities can be derived from the values of α, β and p. Moving across from right to left, the expected value at an event node is calculated as the sum of products of probabilities and costs for each branch. The expected cost at an action node is the minimum of expected costs on its branches. An operating point for an IDS is defined as the values of the parameters α and β. [11] show that the expected cost of operating at a point on an IDSs ROC curve is:

where 
and p is the probability of intrusion. The choice of operating point is an important criterion in the performance of an IDS. The performance of an IDS could be tuned if the operating point is correctly chosen. Usually the operating point is so chosen that the expected cost is the minimum i.e. the values of α and β are so chosen so as to minimize expected cost. A similar approach is followed to evaluate multiple IDS’s. The decision tree is similar to that of a single IDS only that for the case of multiple IDS, the tree becomes a wee bit more complex.
4. Decision Tree Approach to Valuate an IDS
A decision tree is a predictive modeling technique that builds a tree like structure of the data pattern for determining the optimal operating point for an IDS and expected cost metrics is used to evaluate IDS. Decision tree is an example for classification algorithms. These algorithms help solving credit card theft detection as well as to diagnose heart problems by recognizing pattern in data set and classifying activity based on classification made by decision tree. Decision trees alone do not take any action against the threat like firewalls and Intrusion Prevention System (IPS).They are used in conjunction with other tools to take action against the threats.
Nomenclature Used in This Paper
The nomenclature used throughout this paper and some important facts regarding the decision tree structure is as follows:
- The system can be in one of the two states: either with an intrusion present (I) or with no intrusion present (NI);
- The prior probability of an intrusion is called p;
- The IDS reports either an intrusion alarm (A) or no alarm (NA);
- The parameters of the IDS’s ROC curve are: the probability of an alarm given an intrusion, the detection probability, P(A—I) = 1 – β (or the probability of no alarm given an intrusion, P(NA—I) = β), and the probability of an alarm given no intrusion, the false alarm probability, P(A—NI) = α. Thus, α and β are the probabilities of the two types of reporting errors;
- Either report from the IDS will trigger one of two actions: either respond as though there were an intrusion (R) or do not respond (NR). Consequences of the combinations of possible actions and states of the system are specified by the costs of errors;
- The cost of responding as though there were an intrusion when there is none is denoted C. The cost of failing to respond to an intrusion is denoted C. Without loss of generality, we can rescale costs by defining a cost ratio,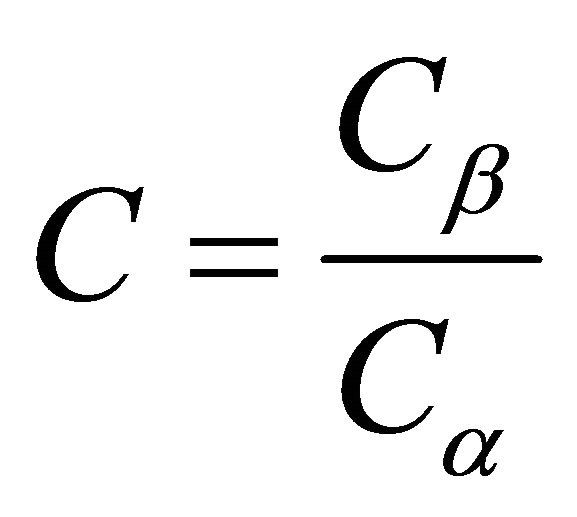 .
.
5. Use of Decision Tree to Calculate the Operating Cost of an IDS
We can classify costs of running an IDS as Damage Cost which is the cost of the damage caused by an unwanted intrusion when the IDS is unresponsive or incapable of thwarting that intrusion; Response Cost is the cost of acting upon the intrusion and preventing it; and Operating Cost which is the cost of running the IDS under regular situations and analyzing flowing traffic [12]. A decision tree can be used to compute the expected cost of the operating point of the IDS. The concept of using pointers and structures to create nodes of the tree has been used to implement the decision tree and the concept of multiple indirection has been used to calculate the final expected cost.
5.1. Algorithm to Implement Decision Tree
1. Expcost(a,b,c,p)
2. Declare d[], prt, expcost 3. Initialize prt=0 4. Initalize d[0] = p 5. Repeat i ->1 to 7 6. If i is even 7. d[i] = 1 - d[i-1]
8. Else 9. d[1] = (a*(1-p))+(p*(1-b))
10. d[3] = (a*(1-p))/d[1]
11. d[5] = ((1-a)*(1-p))/(1-d[1])
12. d[4] = c*d[4]
13. d[6] = c*d[6]
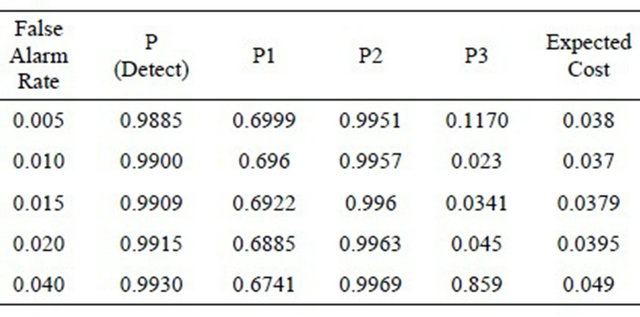
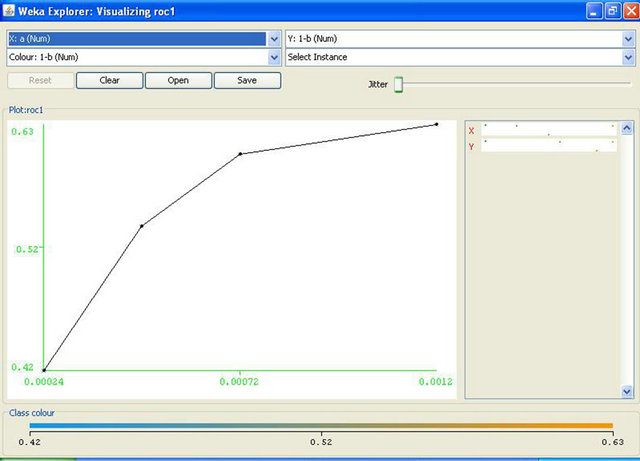
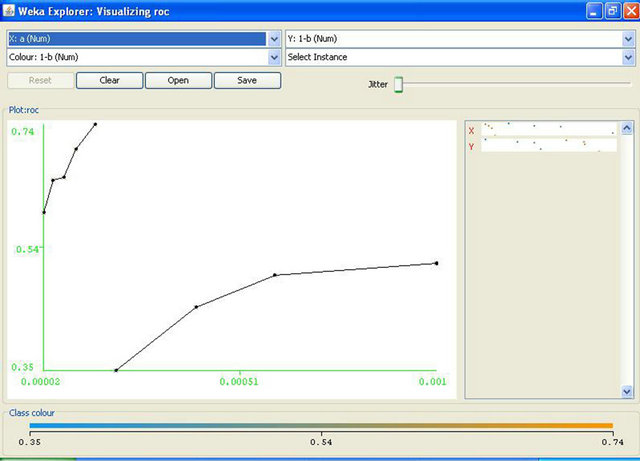
14. Prt = (6-1)/2 15. Repeat while ptr>0 16. If d[[2*prt+1] 17. expcost=expcost+(d[prt]*d[2*prt+1]) 18. Else 19. expcost=expcost+(d[prt]*d[2*prt+2]) 20. Decrement in prt 21. Return expcost Decision tree is constructed by discarding the nodes leading to correct responses as mentioned above that we consider the cost of correct responses to be zero. We calculate values of probabilities by taking values of α, β, p and C as input and assign these value to the nodes of tree. In the algorithm given above, we construct the decision tree and then we calculate expected cost of operating point given by (α, β). In the given algorithm, steps 2 to 14 create the tree and steps 15 to 21 evaluate the cost. The step-wise algorithm can be explained as: 1) The structure named node declares the data as a float variable and pointers pointing to left and right child of the node. s is a pointer to this structure used to access and modify the values at the tree nodes; 2) Variable i used as a counter to traverse the nodes; 3) Initialize the root with null values; 4) We then assign the required data to the nodes while the height of the tree remains <= 3. Here i = 0, 1, 2, 3 represent the level or height of the tree. Values of pr1, pI1, pr2, pI2 etc. as shown in the decision tree diagram and calculated under heading evaluation of expected cost have been assigned to their respective nodes; 5) The expected cost is assigned the value of the minimum of (s-> left -> data) and (s-> right -> data) where s = left child of root of the tree; 6) The final expected cost is assigned the value equal to the above expected cost + the minimum of (s-> left -> data) and (s-> right -> data) where s = right child of root of the tree; 7) The value of the calculated final expected cost is thus calculated. The expected cost for any operating point of the IDS is determined by analyzing the decision tree shown in the Figure 1. This decision tree shows the sequence of actions, shown as triangles and uncertain events, shown as rounded squares in Figure 1 that describe the operation of the IDS and of the actions or responses that can be taken, based on reports. It also shows the consequences of the actions and events. The costs shown correspond to the consequences. The decision tree is to be read from left to right. The path leading to any point is determined by left and to the right all the possibilities are shown which are to be determined. Action nodes shown in the tree as squares are under the control of decision maker. The decision maker decides which branch to follow. Event nodes in the tree shown by the circles are subjected to uncertainty. Each uncertain event is associated with its probability of occurrence. The three probabilities specified in the figure are: p1 = the probability that the IDS reports an alarm; p2 = the conditional probability of intrusion given that the IDS reports an alarm; p3 = the conditional probability of intrusion given that the IDS reports no alarm. The path to be followed in decision tree is characterized by its cost. Cost is the cost of wrong decision and there is no cost to be paid for correct responses. The higher the cost, less attractive is the path. Therefore, our motive is to find the operating point resulting in the minimum expected cost. Figure 1. Decision tree of the IDS’s expected cost. The expected cost for an operating point is calculated by rolling back the decision tree. The expected cost at event node is calculated as the sum of products of probabilities and costs for each branch. Cost for a decision or action node is determined by selecting minimum of costs on its branches. This corresponds to choosing the alternative with lowest expected cost. This process is repeated until expected values are determined for all the nodes. Gaffney and Ulvila [11] show how these probabilities can be derived from the values of α, β, and p. The decision of choosing the values of α and β on the ROC curve is taken in order to minimize the expected cost. The problem is to choose α and β on the ROC curve so as to minimize (for given values of C and p): 5.2. Expected Operating Cost of the IDS The expected cost of an operating point is calculated by rolling back the decision tree shown in Figure 1. An operating point is defined as the values of the parameters a and p. The costs C, and Ce must be assessed. Without loss of generality, we can re-scale costs by defining the cost ratio, This substitution results in costs of 1 and C, as shown in Figure 1. The prior probability of an intrusion, p, must also be assessed. The probabilities of the detector’s reports are calculated by applying the formulas for total probability: Therefore, Thus, and The probabilities of the state of the system conditional on the detector’s report are calculated by applying Bayes’ Theorem. Applying Bayes’ Theorem the prior probability that there is an intrusion, p, based on the out-put of the detector, which can be erroneous, as indicated above. Figure 2 shows the expected costs of responses based on detector’s report. The expected cost for each conditional response based on the detector’s report is calculated by taking the sum of the products of the probabilities and costs for the node following the response. The results of the calculations are shown in Table 1. The expected cost given the detector’s report is the expected cost of the least costly response given the report. Thus, the expected cost given no alarm is: Similarly, the expected cost given an alarm is: The expected cost of operating at a given point on the ROC curve, the operating point, is the sum of the products of the probabilities of the detector’s reports and the expected costs conditional on the reports. The expected cost of operating at an operating point is: Optimal operating point is the most suitable operating point for the intrusion detector which minimizes the expected cost. We have to choose the optimal operating point on the detector’s ROC curve. The ROC curve describes the relationship between Expected costs of responses conditions on detector’s report Figure 2. Expected costs of responses. 5.3. Uniqueness and Benefits of Decision Tree Decision tree simply provide us with set of rules that categorize new data. Decision tree can be built by introducing rules for characterizing information to identify and classify data of our interest and incorporating this logic into existing defenses like IDS, firewalls. The goal of tree is to identify malicious activity which is same as of IDS but decision trees are not limited to just IDS. Decision tree add values to many real time systems like machines diagnosing heart problems. They can very well supplement the system and that is how decision trees are different from other tools. Decision trees do not have artificial intelligence to think for the experts but this technique can identify patterns and trends that may warrant further investigation, signature development and actions. IDS’s take action against threats but tree provide them with the right direction. Data analysis becomes important as complexity of attacks increases. As the number of variables involved in attacks and volume of data expands, automated techniques of decision tree are better to identify patterns and techniques becomes more beneficial. In converse, as the analysis of data becomes easier for machines, it can become more time-intensive for people. This makes decision trees a potential time saver for an effective IT Security team. An organization can try implementing decision trees with existing network data. When performing this analysis, the decision tree algorithm learns the idiosyncrasies of the network and provides tailored feedback to support intrusion detection. 6. Data Sets for Evaluating IDS The foundation of evaluating IDS’s was done in the work of Puketza and others at the University of California at Davis [13,14] is the only reported work that clearly precedes the Lincoln Lab effort that began in 1998. These papers describe techniques and methodologies for testing IDS’s. More comprehensive and complete evaluations of IDS’s were done in the years 1998 and later in 1999 by the Lincoln laboratory which was later known to be the DARPA evaluations [14,15]. In these evaluations, researchers had used data in the form of sniffed network traffic, Solaris BSM audit data, Windows NT audit data and file-system snapshots and had identified the intrusions that had been carried out against a test network during the data-collection period. The test network consisted of a mixture of real and simulated machines, and the background traffic (noise) was artificially generated by the real and simulated machines, while the attacks were carried out against the real machines. Training data was supplied that contained a variety of attacks that were identified in the corresponding documentation. The data used for evaluation contained a mix of attacks that had been present in the training data and previously unseen attacks. The data sets used by the DARPA evaluation researchers form the basis of most IDS’s evaluations even today. The best IDS was available to detect about 90 out of a total of 120 attack types. The best systems generated two false alarms per day. The DARPA evaluation done in 1999 produced better results but over a wider variety of attacks. Despite its criticisms the DARPA evaluations of 1998 and 1999 formed a benchmark in the evaluation of IDS’s. In this paper we have used data in the form of packet capture files that were downloaded from www.openpacket.org. The files were obtained in packet capture format (files of extension pcap). Data from these files were extracted using WireShark [16]. WireShark is a network analyzer which is capable of analyzing network data. The data was then converted to comma separated format (files of extension csv) and was analyzed using Weka [17]. 7. Results and Discussions Weka allows one to use classification algorithms, enables data filtering, feature selection and generates graphs. The classifier model [18] is the most critical part of the Weka output. Weka generates a decision tree with data fed as input and calculates the minimum operating cost of the IDS. The expected cost has been calculated based on detector reports as shown in Figure 2. Using available packet capture data it has been shown that the operating cost of the IDS is a minimum has been shown in Table 1. Figure 3 shows the ROC drawn for a single IDS with data analyzed by Weka. Figure 4 shows similar ROC curves of intrusion detection systems. From the ROC curves and the decision tree of the system we have calculated the minimum operating cost of the IDS. In this paper we have analyzed available metrics for measuring the performance of Intrusion Detection Systems. This analysis of metrics was useful to evaluate the resistance of networks against attacks. The analysis highlighted the complexities of using classical metrics such as detection rate, false positive rate etc. in distributed networks [19,20]. These metrics are also not applicable Table 1. Results of expected cost based on packet capture data. Figure 3. A simple ROC curve for a single IDS generated with data analyzed using Weka. Figure 4. ROC curves for two IDS’s generated with data analyzed using Weka. to measure the performance of IDSs in complicated and distributed mobile networks. The performance of an IDS is also related to the operating cost of the IDS. We have used the decision tree approach to calculate the operating cost of an IDS. Then, we have computed the minimum operating cost of the IDS. We have used available packet capture data sets and shown that using this approach the minimum operating cost for an IDS can be easily computed. Thus, by minimizing the operating cost, the performance of an IDS can be optimized. 8. Acknowledgements The first author wishes to acknowledge the support of a WOS-A project (ref. no.: SR/WOS-A/ET-20/2008) funded by the Department of Science and Technology, Government of India. REFERENCES NOTES *Corresponding author.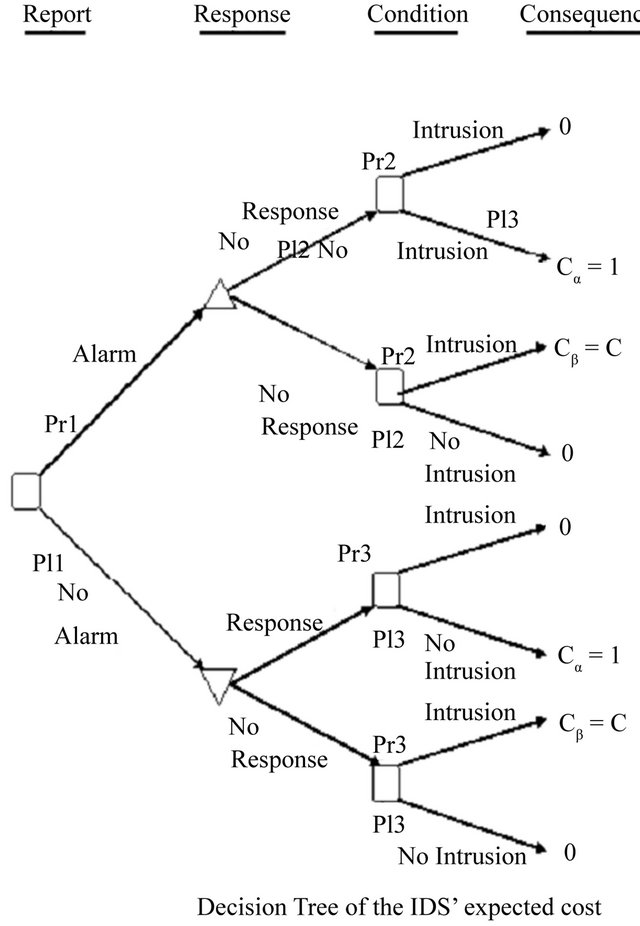

 .
.

 and α. Therefore, our main objective is to minimize the expected cost which is evaluated at different points on ROC curve.