Int'l J. of Communications, Network and System Sciences
Vol. 5 No. 8 (2012) , Article ID: 21931 , 18 pages DOI:10.4236/ijcns.2012.58057
Is Faster Necessarily Better? 3G Take-Up Rates and the Implications for Next Generation Services
NERA Economic Consulting, San Francisco, USA
Email: christian.dippon@nera.com
Received May 10, 2012; revised June 26, 2012; accepted July 5, 2012
Keywords: Spectrum; Diffusion; Broadband; Linear Probability Models; Qualitative Choice Analysis
ABSTRACT
Most countries have allocated 3G spectrum and are in the process of allocating advanced wireless services and 4G spectrum, both of which promise subscribers significantly faster broadband speeds. Operators anticipate that subscribers will adopt these services swiftly thereby justifying the large investments. Yet, why is it the case that only two countries in the world have more 3G than 2G subscribers? This study examines the drivers behind 3G diffusion using linear probability models and qualitative choice (logit) analysis. Time series diffusion models show that diffusion patterns follow an s-curve pattern, favoring the Gompertz curve.
1. Introduction
In the late 1990s and early 2000s, many hailed the then upcoming allocations of 3G spectrum as a revolutionizing step in telecommunications. Fueled by the success of the Internet, 3G promised to take “mobile telephony beyond just voice … giving people a whole range of new exciting services down to their mobile phone” [1]. In essence, 3G promised to bring the Internet to the mobile phone. The anticipated significance of 3G initially led to exuberantly high spectrum valuations. Because of these high valuations, some countries chose to allocate 3G spectrum through auctions. The anticipated high value of the scarce 3G spectrum consequently led to high winning bids. For instance, as reported by [2], winning bidders in the UK paid EUR650 for each potential subscriber. In Germany, winning bidders paid EUR615 per capita. Underlining the anticipated significance of 3G in the marketplace, BT (British Telecom) Ignite’s CEO Alfred Mocket stated that BT had no choice in the bidding war because the “cost of the licence was the cost of staying in business” (as cited in [3]).
The high spectrum prices paid in the first 3G auctions, the stock market crisis of early 2000, as well as the slower than anticipated technological progress did delay the rollout of 3G services. Table 1 illustrates this by showing that, on average, countries rolled out 3G services approximately two years (26 months) after their 3G auctions. It is important to note that the “delays” shown in Table 1 are only approximate values as in many countries in-band migration was allowed. Hence, in some countries, the launching of 3G services took place prior to the allocation of 3G spectrum.
It was not until approximately 2006, several years after the allocation of 3G spectrum, that the EU and North American countries deployed 3G networks. With 3G reaching mass markets, analysts quickly began speculating whether 3G services would become substitutes for 2G services and when 3G would become the dominant technology. For instance, [4] predicted that 60 percent of mobile subscribers in Western Europe would be using 3G technology by 2010. Reference [4]’s analysis found that Italy and the UK would lead Europe in terms of 3G penetration and Belgium and Greece would have the lowest rates. Similarly, [5] made the prediction that the UK and Italy would lead 3G adoption with penetration rates of 68 and 72 percent, respectively, by 2010. In the same year, [6] cited several studies that predicted 3G subscribers in North America would make up 82 percent of all mobile subscribers by 2010. Finally, a consulting report for the GSM Association states: “3G technology has diffused relatively quickly in mature markets” [7].
Recent data on 3G penetration rates demonstrate that these and many other statements and forecasts were far too optimistic as actual 3G penetration rates fell significantly short from most of these claims. As shown in Table 2, the average 3G penetration rate in the EU 15 countries for year-end 2009 was 25.7 percent—far short of the predicted 60 plus percentage range or the stated 30 to 80 percent [7]. Similarly, contrary to the forecasts, the leading countries were Spain with a 43 percent 3G penetration rate followed by Sweden with a 40 percent penetration
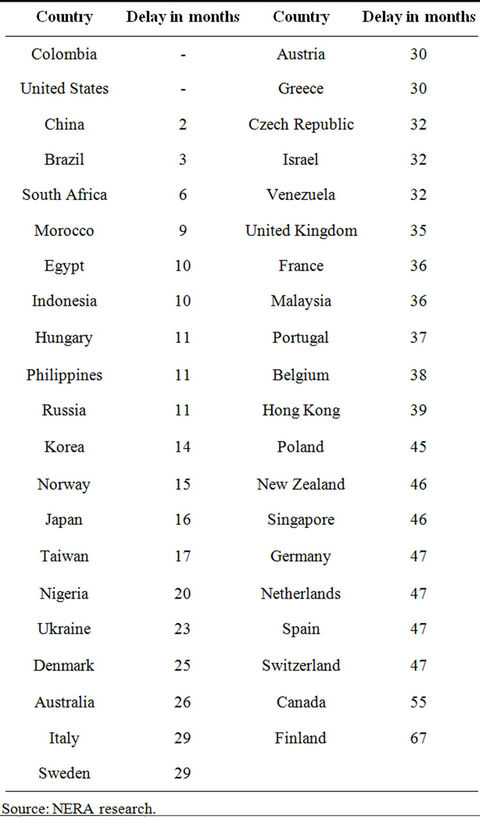
Table 1. EU and North American rollout delays.
rate. The UK and Italy had 3G penetration rates of 32 and 30 percent, respectively, both less than half of the predicted rate.
Figure 1 shows the hesitant, yet steady, increase in 3G subscribers in the EU 15 nations. The apparent slow diffusion of 3G technology was not limited to the EU 15 nations. Rather, it seemed to be a worldwide phenomenon. The December 2009 US 3G penetration rate was 26.1 percent, which is less than one third of the number forecasted for the US by various analysts for 2010. As shown in Figure 2, the 2009 3G penetration rate in North America was 22.3 percent.
Quite surprisingly, 3G growth rates in North America during the last three quarters of 2009 declined, possibly indicating that demand from early adopters has been met thereby decreasing the long-term growth rate of the technology.
With the exception of Japan and South Korea, consumer demand for 3G handsets and services was even
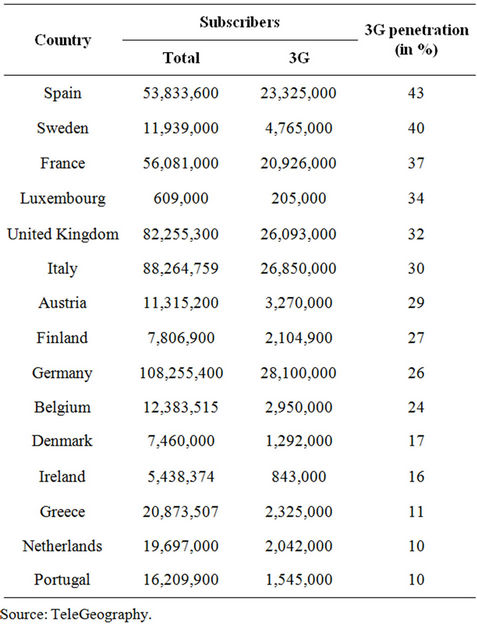
Table 2. EU 15 3G penetration rates, December 2009.
lower in Asia where 2009 penetration rates were approximately 4 percent. Figure 3 depicts this result, which must be interpreted with caution as some Asian countries are only now in the process of allocating 3G spectrum. For instance, with over 1.1 billion potential subscribers, India auctioned its 3G spectrum in May 2010. Similarly, Thailand, with over 60 million potential subscribers, has not yet scheduled its auction of 3G spectrum.
There are seemingly only two exceptions to this international trend of low 3G diffusion. With 90 and 70 percent, respectively, Japan and South Korea are the only two countries in the world that currently have more 3G subscribers than 2G subscribers. These two countries were among the first to introduce 3G services, and their 3G diffusion rates surpass the rates in the rest of the world. Figures 4 and 5 illustrate this.
Not surprisingly, due to the already high 3G diffusion rates, the two countries exhibit declining 3G growth rates. Interestingly, and as discussed further below, a visual inspection of the 3G diffusion patterns in these two countries, particularly Japan, seems to indicate that 3G diffusion follows an s-curve.
The cross-country comparison above clearly shows that although several years have gone by since the allocation of 3G spectrum and the introduction of 3G services consumers still are hesitant in adopting the technology. Seemingly, consumers are not convinced that 3G
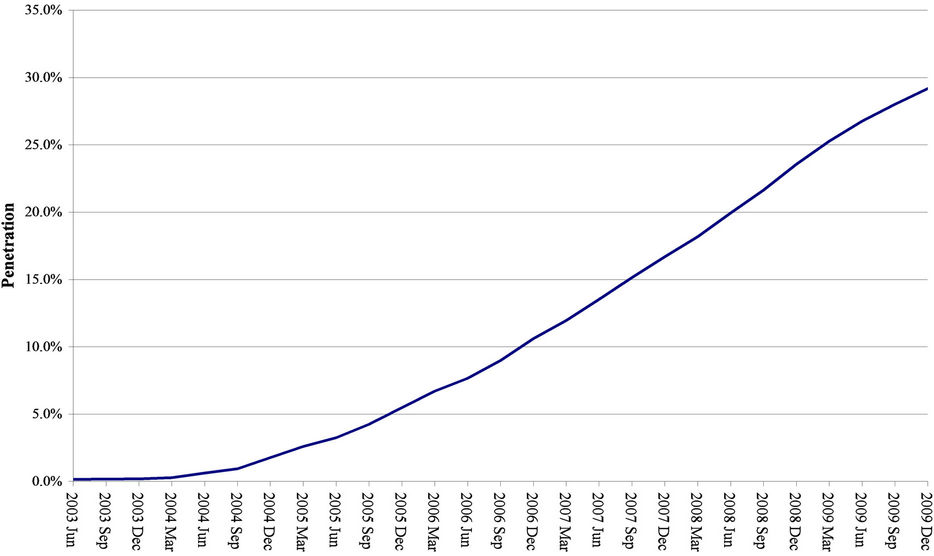
Figure 1. EU 15 penetration (2003-2009).
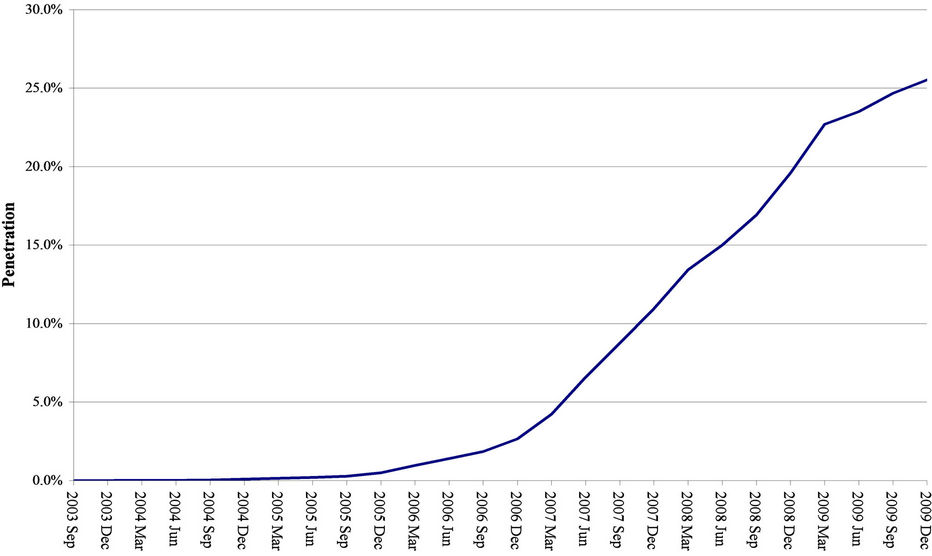
Figure 2. North America 3G penetration (2003-2009). Source: TeleGeography.
offers improved services over the legacy 2G services. This, in turn, raises the question of whether faster data upload and download speeds are necessarily better and whether consumers value accessing the Internet via their mobile phones. It also poses the question of what drives the demand for 3G handsets and services and whether regulatory intervention, such as mobile number portability (MNP), is an effective tool in promoting 3G take-up.
These important questions are empirically examined herein by analyzing the socioeconomic and regulatory
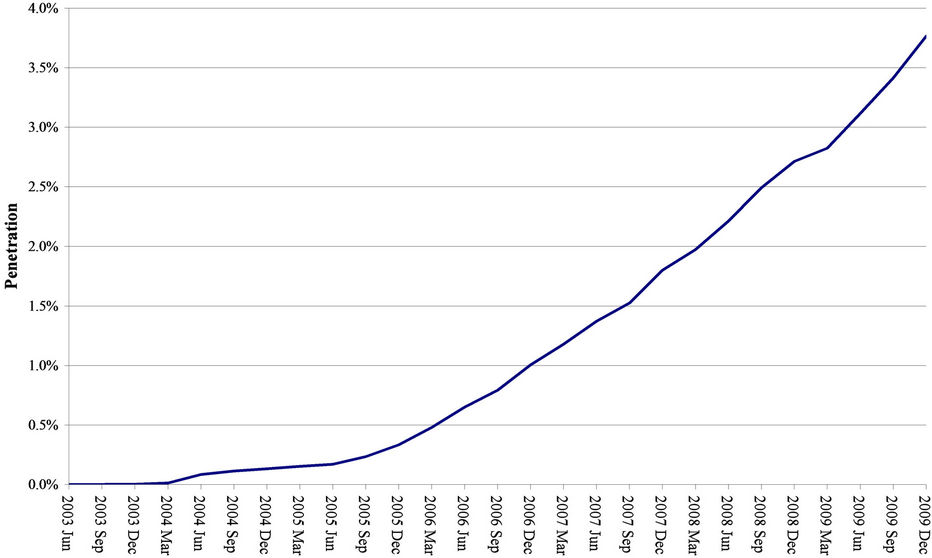
Figure 3. Asia and Pacific 3G penetration (excluding Japan and South Korea). Source: TeleGeography.
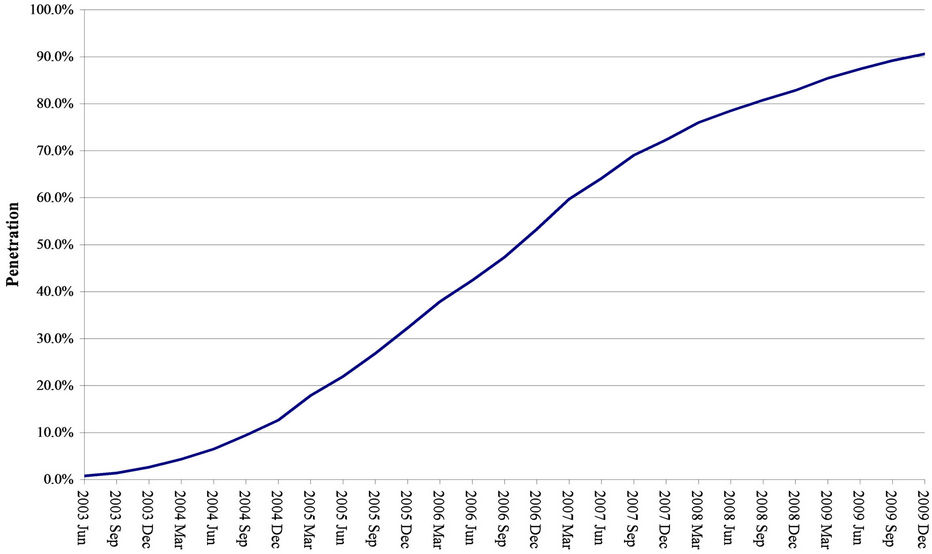
Figure 4. Japan 3G penetration.
determinants that shape a country’s 3G diffusion pattern. This study also examines the impact of MNP on 3G diffusion and tests the hypothesis that countries with lower 2G levels have relatively more 3G subscribers. This latter question is of interest as studies on mobile diffusion have shown the existence of fixed or 1G networks to have a positive impact on mobile diffusion [8-10]. Given the unexpectedly slow take-up of 3G services, it is also informative to study the demand determinants and diffusion patterns of this technology. Finally, using Gompertz
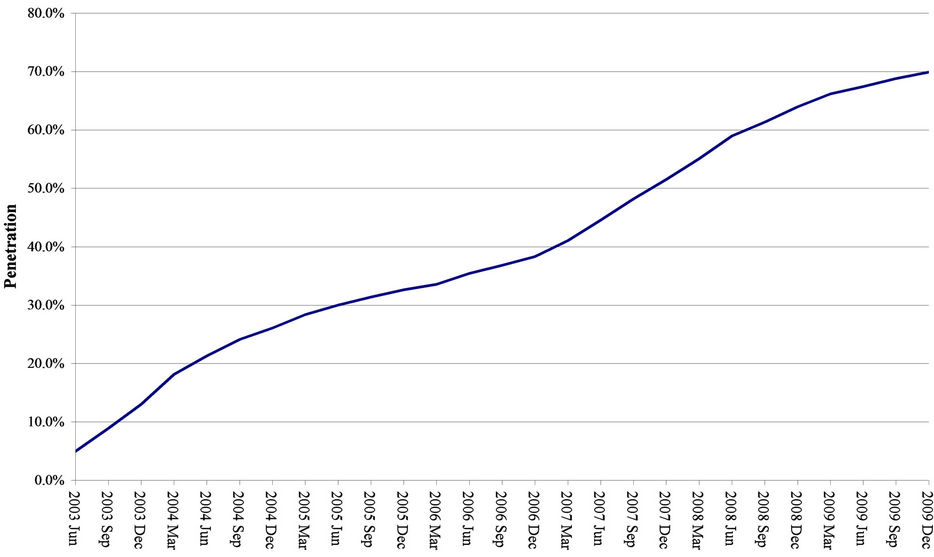
Figure 5. South Korea 3G penetration. Source: TeleGeography.
and logistic diffusions curves, 3G penetration rates for India, Mexico, and Thailand are forecasted.
It is important to note that the intent of this study is not to provide evidence of the potential of 3G technologies and the desirability of such services. Rather, the study is based on the evidence of actual 3G take-up rates that, in turn, are a reflection of 3G services, prices, and quality of service offered by operators worldwide. Similarly, the study does not address the efficacy of MNP. Instead, only the impact of MNP on 3G diffusion is studied.
In Section 2, there is a discussion of the prior literature. Section 3 explains the study data and variables. Section 4 details the findings of the linear probability model. Section 5 introduces the binary logit model, and Section 6 presents two diffusion models—the Pearl logistic curve and the Gompertz curve. Section 7 reflects 3G take-up forecasts for India, Mexico, and Thailand. Section 8 links the findings to regulatory policy. Section 9 concludes.
2. Prior Literature
There is a large body of economic literature on mobile diffusion patterns. However, few previous studies examined 3G diffusion rates separately from general mobile penetration rates. The economic literature on mobile diffusion includes [9] who examined the technological and regulatory determinants of the diffusion of mobile telecommunications services in the European Union. Reference [11] studied mobile diffusion in Central and Eastern Europe. Using logistic and Gompertz diffusion curves estimated using nonlinear least squares, [11] identified the determinants of mobile diffusion in the study countries. Reference [12] examined mobile diffusion in Portugal and found that mobile penetration rates followed an s-curve, in particular, a logistic curve.
Reference [13] offers a possible explanation for Japan’s high 3G take-up rate. [13] found that the strong increase in 3G handsets in Japan, particularly for the mobile operator KDDI, was not due to the advanced data functions offered by 3G. Instead, it appeared that 2G services compatibility was the driver for the demand for 3G handsets. [13] found that by 2002 only 0.4 percent of the population used 3G services although over 6 percent (approximately 8 million) of the population had 3G handsets. This finding also suggests that the 3G handset count is an imperfect proxy for 3G subscribers.
Reference [14] studied worldwide mobile diffusion by isolating key determinants of mobile take-up. [14] confirmed that diffusion patterns followed the characteristics of an s-curve and found that the size of the network externality determined the spread of the s-curve.
Reference [15] investigated the relationship between handset subsidies and the adoption of 3G and other advanced services. [15] suspected that the bundling of handsets with services might have mitigated the slow development of the mobile data market in Finland. The study, however, revealed that although this hypothesis might have been true for Finland in its transition from 2G to 3G it could not be expected to hold in the future. Reference [16] presented their results on diffusion rates in Greece using various diffusion models, including a flexible logistic (FLOG) model. [16] focused on socioeconomic and regulatory aspects of diffusion. Among other things, they found a positive correlation between take-up speed and the number of mobile competitors.
Reference [17] studied mobile diffusion in Europe and the impact of regulatory intervention on 2G and 3G diffusion. Directly relevant to this study, [17] found that 3G was not conceived as a new range of services but as a tool that would allow the operators to optimize their networks. The limited 3G take-up rates in most countries seem to support this finding and also seem to indicate that 3G is mainly used to separate the market into subscribers who do not place a value on receiving Internet access on their mobile phone and subscribers who do. [17] further noted that 3G was not introduced as a substitute to 2G but as a complement to GSM, offering new services (mainly multimedia ones) that did not previously exist. [17] did note that 3G penetration rates in 2006, which reached only single-digit levels, did not meet the high expectations for 3G.
Reference [18] analyzed the potential complementarities between mobile voice and short message service (SMS). Among other things, [18] found that SMS accounted for up to 95 percent of data revenues. This finding also generally supports the data presented above because it shows that until recent years SMS was responsible for almost all data revenue. However, it is the signaling systems associated with the cellular networks that control SMS, not the cellular (2G or 3G) networks themselves. Hence, with respect to this study, [18]’s finding implies that 3G revenue consists of a maximum of 5 percent of an operator’s data revenue.
Reference [19] studied the effect of technological innovations and competition policies on the diffusion of 3G mobile phones in Japan. [19] found that technological innovations in entertainment, e-payment, and high-speed data services are significant determinants of 3G diffusion. Finally, [20] offers a comprehensive literature review of the mobile diffusion literature that concentrates on the interaction between fixed and mobile.
3. Study Variables and Data
To study the determinants and rate at which mobile subscribers take up 3G services, I constructed a comprehensive database of 47 countries for which data were available. Table 3 lists the countries included in the study.
Table 4 summarizes the variables collected for each study country and provides a brief description and the source of each variable, and Table 5 reports summary statistics for the explanatory variables.
Due to the limited availability of source data for each variable, I collected cross-section data instead of timeseries data to study the demand determinants of 3G. There are two limitations to the available data. First, 3G diffusion can only be measured as the percentage of mobile subscribers who have a 3G handset. Although this is a common industry proxy for 3G diffusion, it is an upper bound to the actual number of 3G subscribers because 3G handsets are backwards compatible, and, as observed in developing nations in particular, subscribers might purchase 3G handsets even though they mainly (or exclusively) use 2G services. Second, some countries report 3G subscribers although they have not yet allocated 3G spectrum. There are at least two possible reasons for this observation. First, a country may allow in-band migration where operators holding existing 2G licenses can offer 3G services. Second, operators sell 3G handsets even though no 3G services are available.
Therefore, in the analytical evaluation of the data, I removed countries where 3G spectrum has not been allocated yet, despite the fact that operators in these countries do report a modest amount of 3G subscribers. This process eliminated Argentina, Chile, India, Mexico, Peru, and Thailand.
Note, although these countries did not have 3G spectrum allocated at the time of the study, most of these countries are currently in the process of doing so. As such, the empirical insight derived from the data is particularly valuable to these countries in forecasting their 3G diffusion patterns.
4. Linear Probability Model
A first simple model for 3G demand is a linear probability model estimated via conventional ordinary least squares (OLS) using the most recent data for 41 countries.
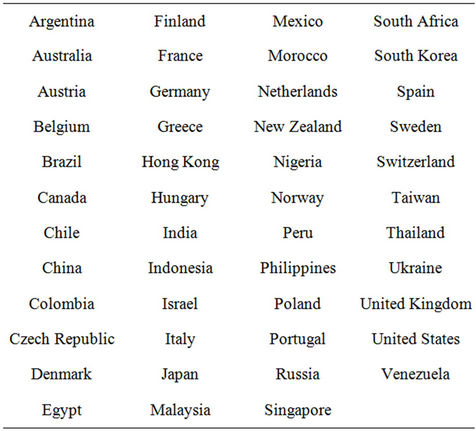
Table 3. Study countries.
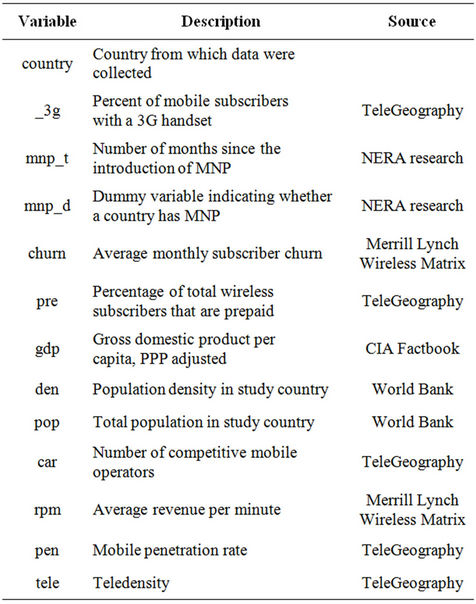
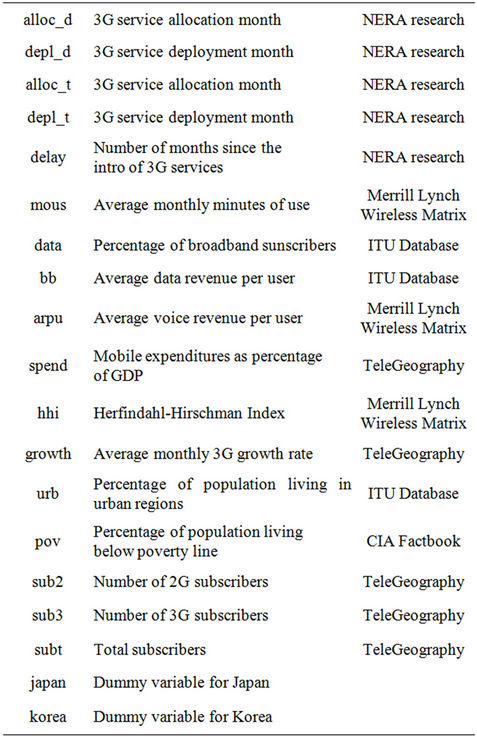
Table 4. Variables used in study.
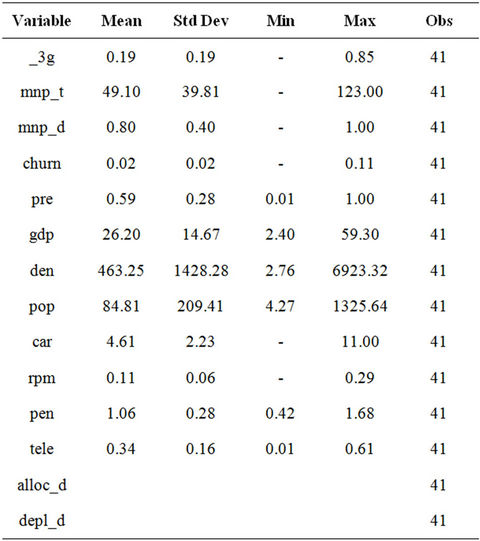
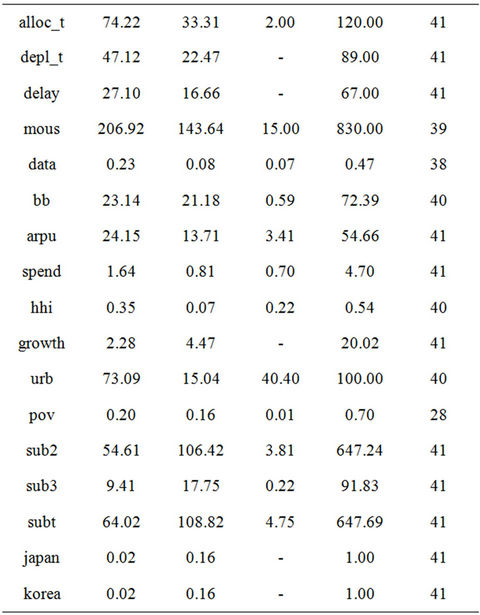
Table 5. Summary statistics.
Table 6 shows the model with the best fit.
Equation (1) represents the fitted model:
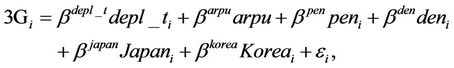 (1)
(1)
where 3Gi is the measure of 3G diffusion in country i.
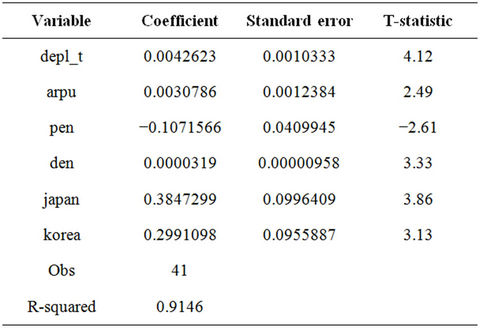
Table 6. Linear probability model.
The variable depl_t represents the number of months since the launch of 3G services, arpu reports the average revenue per user at the time, pen represents the mobile penetration, and den represents population density. Variables Japan and Korea are control variables for the above-average 3G diffusion rates in Japan and Korea. The disturbance term is denoted by . The variables depl_t, pen, den, Japan, and Korea are significant at the 1 percent level, and arpu is significant at the 5 percent level.
The fitted model indicates that differences in the length of time since the introduction of 3G, ARPUs, mobile penetration rates, population density, and the two country dummies explain 91 percent of the 3G diffusion difference in the 41 countries. Specifically, each additional year of 3G deployment increases 3G take-up by approximately 5 percent. Similarly, for each additional $10 in ARPU per month, 3G take-up increases by approximately 3 percent. The constant term in this regression is insignificant, which makes sense as one would not expect any 3G take-up if a country has not yet deployed 3G services. Moreover, with the elimination of countries that have not yet allocated 3G spectrum from the dataset, this result is expected. Hence, this simple, yet strong, model indicates that 3G penetration is mostly a function of time. Additionally, higher mobile spending and population density accelerates 3G penetration, and high mobile penetration rates temper it.
Importantly, though, as opposed to other studies, it indicates that 3G diffusion is much slower than anticipated. For instance, as noted above, [6] forecasted that 3G diffusion in North America would be at 82 percent in 2010. Although the US had 3G services prior to 2006, it was not until September 2006 that the Federal Communications Commission allocated advanced wireless services (AWS) spectrum for 3G purposes. Hence, if “true” 3G services were launched in September 2006 and were forecasted to reach 82 percent by 2010, this would imply a linear growth trend of approximately 3 percent per month. However, the linear model indicates an average monthly growth rate of 0.04 percent, ceteris paribus, which is approximately 13 percent of [6]’s forecast. Specifically, for the US, the linear model forecasts a 3G take-up rate of 19.2 percent. This compares reasonably well with the actual take-up rate of 23.5 percent.
Various alternative combinations of the independent variables yield lower R-squared results. Notably, market concentration, as measured by the Herfindahl-Hirschman Index (HHI), seems to have no statistical significance in explaining the difference in 3G diffusion rates. This result is in contrast to [21] who found the HHI to be a significant determinant of mobile diffusion in Vietnam.
The period between the allocation of spectrum and the launching of 3G services (delay) has no statistical significance. This finding is generally consistent with [9] who found that mobile diffusion in countries with a late start to 2G would catch up with the rates observed by early adopter countries.
Remarkably, 3G diffusion rates are not a function of the number of 2G subscribers. This contrasts to the previous literature that found existing networks (either fixed or 1G) to be a positive contributor to mobile diffusion [1, 8,9].
Testing for MNP yields a statistically insignificant coefficient, indicating that in this model the availability of MNP does not positively or negatively contribute to 3G take-up. Table 7 shows the in-sample predictions and differences to actual 3G shares.
Although this model provides a simple and robust explanation of what determines 3G diffusion, it suffers from a number of shortfalls. Most importantly, the dependent variable (a percentage) is not bound by zero and one. In the above linear probability model, this would imply that 3G take-up rates could exceed 100 percent or become negative.
5. Binary Logit Model
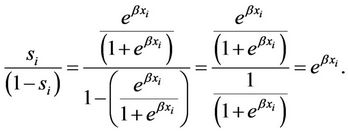
To avoid the obvious drawback of the classical linear model, I introduce a binary logit model. A logit model is well suited for estimating 3G diffusion as it captures the dichotomous nature of the problem whereas subscribers select either a 3G (S = 1) or 2G handset (S = 0). Using a logistic function (rather than normal distribution) will also constrain the dependent variable (share of 3G subscribers), so that it is restricted by zero and one, thereby remedying the problem with the linear probability model. The binary logit model follows the framework derived by [22]:
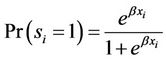 (2)
(2)
where si is the share of 3G subscribers in country i, xi represents the characteristics of country i, and β is the
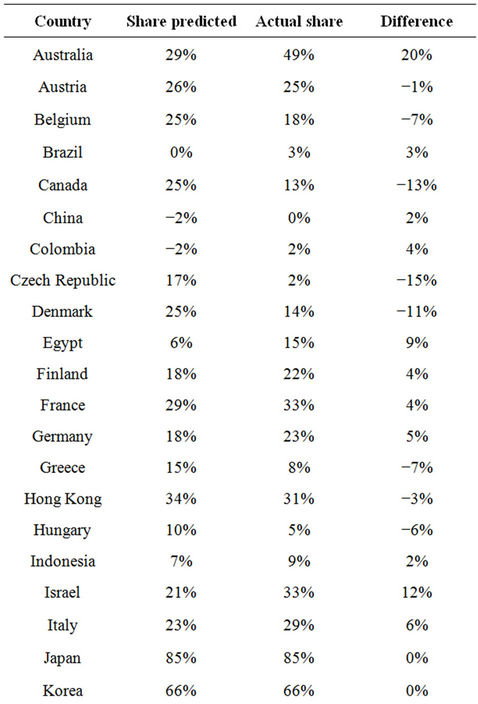
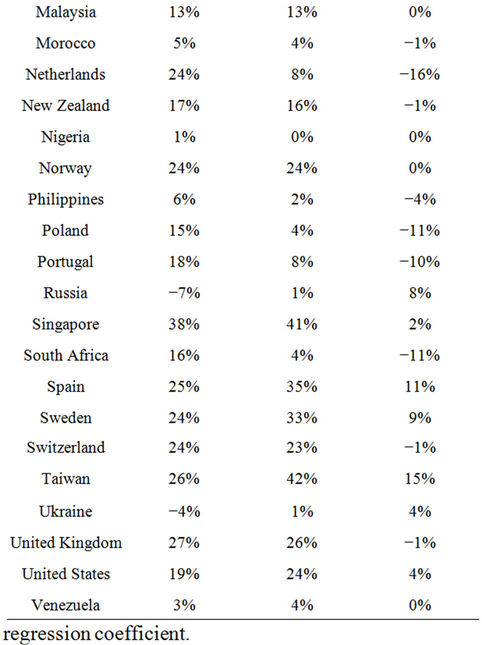
Table 7. In-sample forecasting and comparison.
regression coefficient.
 (3)
(3)
Based on Equation (3), it follows that
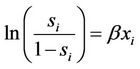 . (4)
. (4)
Equation (4) is fitted using an OLS regression with  as the dependent variable. Table 8 shows the model with the best fit.
Although the sizes of the regression coefficients in this model do not offer a meaningful interpretation for understanding the differences in 3G diffusions, the significance level of the variables do indicate which factors contribute, positively or negatively, to explaining 3G diffusion in the selected countries. Specifically, consistent with the linear probability model, the time that has passed since the deployment of 3G services contributes positively to 3G take-up. Again, this is not surprising because one would expect 3G take-up to increase over time. Mobile penetration contributes negatively to 3G diffusion. This phenomenon seems somewhat counterintuitive because one would expect countries with higher penetration rates to have higher 3G take-up rates. It is also counter to much of the literature on mobile diffusion that found higher penetration to be aiding mobile diffusion [8-10]. However, the possibility of overall (mostly 2G) penetration contributing negatively to 3G diffusion cannot be eliminated because it might be indicative that 2G and 3G services are substitutes.
Countries with higher population densities have higher 3G take-up rates. Interestingly, and counter to the linear probability model, countries with relatively high HHIs
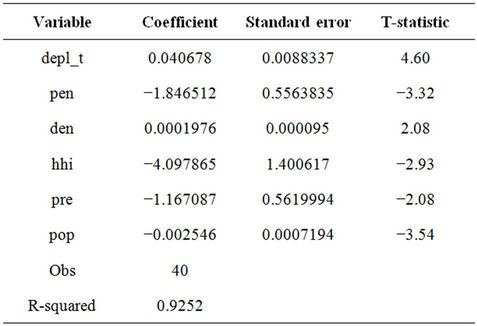
Table 8. Logistic regression.
have lower 3G take-up rates, which is consistent with [21]. This finding may be of interest to regulators because it may be an indication of the lack of competition (although not necessarily so). What was evidenced was that the higher the percentage of prepaid subscribers the lower the 3G take-up rate. This result was expected because in some countries prepaid services are associated with lower income subscribers. Finally, the results show that the larger the population the lower the 3G take-up rate. This is consistent with [14], and it might be an indication that larger nations require larger network investments. As 3G investments are frequently restricted to urban areas and business centers, network coverage in other areas are added only at a later stage.
The above model represents the best data fit and indicates that several other variables seem not to affect 3G diffusion. Specifically, as in the linear probability model, the length of time between the spectrum allocation and the deployment of 3G services is statistically insignificant. This implies that a rollout delay does not explain the difference in 3G diffusion, although the delay shortens the time that passes since the introduction of 3G services, hence indirectly reducing 3G take-up. As in the linear probability model, MNP does not seem to have anything to do with 3G take-up rates. As a word of caution, this result in no way suggests that MNP is not an effective policy tool. Instead, it simply shows that MNP affects both 3G and 2G equally. Finally, consistent with the linear probability model, the number of 2G subscribers, again, is not significant. This reconfirms that higher 2G penetration rates are not statistically correlated with higher 3G penetration rates and provides further evidence that 2G and 3G act as substitutes.
Table 9 shows the in-sample predictions and differences to actual 3G shares.
6. Diffusion Models
There is a rich literature on mobile diffusion and the fact that mobile subscriber growth follows an s-curve pattern. For instance, [14] determined that, common to all nations, mobile diffusion starts slowly in the introductory stage, grows more rapidly as critical mass is reached, and finally tapers off until it reaches saturation. A visual inspection of 3G diffusion patterns in Japan and, to a lesser extent, South Korea, as shown above, seems to indicate that 3G diffusion also follows an s-curve pattern. To test this hypothesis and thereby shed further light on 3G take-up rates, I fit the diffusion models to the cumulative 3G subscriber data for each study country. I used differential equations, such as Equation (5), to derive the diffusion models:
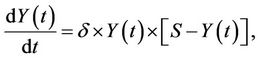 (5)
(5)
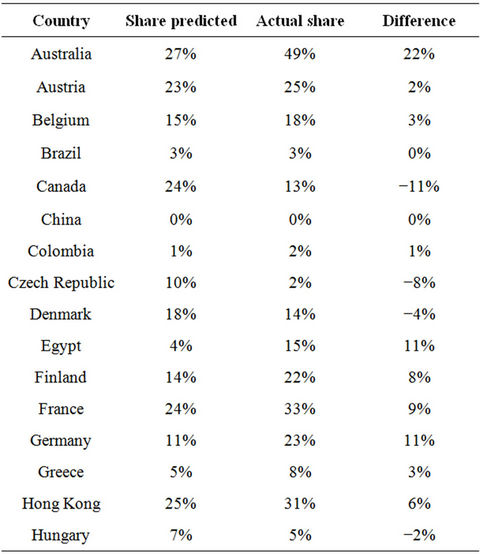
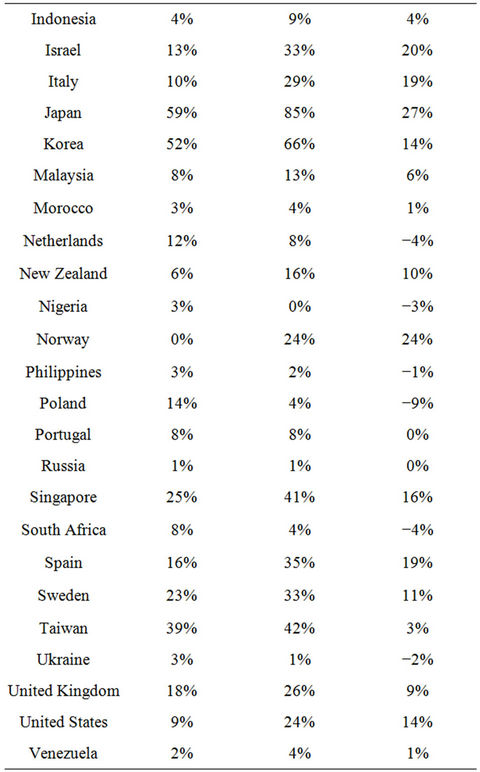
Table 9. In-sample forecasting and comparison binary logit model.
where, in the present case,  is the cumulative number of diffusion at time t, S is the saturation level, and
  is the coefficient of diffusion [16]. For the present model, the general differential equation can be written as:
 . (6)
. (6)
This model assumes that 3G growth in a country is a function of the diffusion coefficient δ, the cumulative number of 3G subscribers 3G(t), and the difference between saturation and the current level of subscribers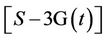 . That is, the closer the number of 3G subscribers is to the saturation point, the slower the growth rate.
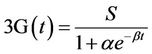
Diffusion curves can be modeled in a number of ways. Commonly used diffusion models for forecasting technological growth patterns include the family of logistic models [23] and the Gompertz model [24,25]. A member of the logistic curves family is the Pearl curve [26]. The standard Pearl curve is written as:
 , (7)
, (7)
where S is the saturation point or the upper limit of 3G subscribers in a country and α and β are coefficients that are obtained by fitting the logistic curve to the 3G subscriber data. The two coefficients describe the level of diffusion in each country, and they can be used to rank the study country according to 3G take-up. Specifically, α describes the location of the curve, whereas β describes the shape of the curve. The higher the β, the faster subscribers adopt 3G in a country. A log transformation of Equation (7) yields:
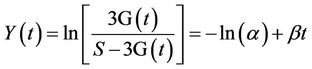 . (8)
. (8)
This transformation allows Y(t) to be regressed on t using OLS in order to obtain estimates for the constant term –ln(α) and the slope b. After solving for α, the two coefficients can be inserted into Equation (7), and 3G subscriber counts can be estimated for each time period t.
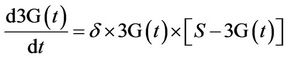
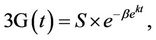
An alternative diffusion model is the Gompertz model. Its general form is as follows:
 (9)
(9)
where S is the saturation level and β and k are coefficients obtained by fitting the curve to the subscriber data for each country. Similar to the Pearl logistic curve, the higher k is, the faster a country is adopting 3G services.
A double-log transformation of Equation (9) yields:
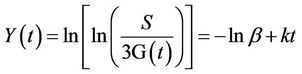 . (10)
Regressing the transformation Y(t) on t using OLS, solving for β, and inserting the two coefficients into Equation (9) allows for the estimation of 3G subscribers for each time period t.
The saturation level S is arguably the most difficult variable to estimate. Although one could reasonably argue that 2G technology will become obsolete at some point as subscribers transition to 3G and beyond, the time for 3G handsets also is limited. Various countries are already introducing next generation technologies, including long-term evolution (LTE) and evolved highspeed packet access (HSPA+). Although there is no specific generation number for these technologies, they are commonly referred to as 4G or 3.9G technologies.
With the introduction of these next generation technologies, some countries will never reach 100 percent 3G take-up. It is reasonable to assume that even though 3G take-up likely will never reach 100 percent the technology will continue to evolve with the same diffusion curve as if it were to reach 100 percent take-up. However, once the introduction of a next generation technology has occurred, the diffusion path is altered and growth rates decrease until they become negative and eventually approach zero. In short, one can assume that 4G and beyond technologies will not affect the shape of the 3G diffusion curve; instead, they will cut its evolutionary path short.
This assumption implies that the saturation point for 3G is equal to the saturation point for mobile penetration, which is proportional to the total population pop. However, as noted by [9], the saturation point for mobile penetration is difficult to estimate. Although some countries already have penetration rates at or above 100 percent, other countries are unlikely to achieve these levels. Regression analyses suggest that mobile penetration in a country is a function of the Gross Domestic Product (GDP). Hence, I grouped the study countries into countries with high GDPs and low GDPs, where high was defined as countries included in the High Income OECD member list and low was defined as countries not included in the list.1 For countries with a high GDP, I assume that saturation is 100 percent mobile penetration. For low GDP countries, the saturation point is set at 80 percent.
Rather than estimating the saturation point, the variable can be made endogenous to the model, as done by [16,27]. However, given the more recent introduction of 3G, most countries show incomplete s-curves, or “growth-in-progress,” as classified by [14]. Thus, a recent temporary decrease in growth could be mistaken as a sign of declining long-term growth and thereby an approximation to saturation. Making them endogenous to the model yielded saturation points around 30 percent. These estimates were rejected because they were counter to empirical evidence (see Table 2) and general expectations.
Table 10 shows the R-squared for the regressions of the transformed Pearl logistic and Gompertz curves. Due to time-series data limitations, t is the only explanatory variable in addition to the constant. The focus of the diffusion models is to forecast diffusion patterns, whereas the linear probability model and binary logit model define the demand determinants. Hence, the data limitation should not affect the validity of the diffusion model forecasts.
With an average R-squared of 88.88 percent for the Pearl logistic curves and 96.39 percent for the Gompertz curves, the hypothesis that 3G penetration rates follow an s-curve pattern is confirmed.
As shown in Table 11, using the Akeike Information Criterion (AIC), the Gompertz curve seems to reflect the 3G diffusions more closely than the logistic curve. However, some caution needs to be added to this interpretation because the number of observations for some countries is low thereby rendering model selection through AIC less reliable. Nevertheless, even for countries with higher numbers of observations, such as the UK, Austria, Japan, and South Korea, the Gompertz curve yields a lower AIC and thus a potentially better fitting model.
Using the Gompertz and logistic models for each country, I calculated the number of months to reach 50 percent 3G take-up. Table 12 presents the results of this analysis and shows that, on average, it takes a country an estimated 22 - 29 months until 50 percent of its mobile subscribers have adopted 3G technology. According to the Gompertz curve, Singapore and Japan have the highest 3G adoption rates. This seems consistent with casual observations. Countries with the lowest diffusion include the Czech Republic and the Philippines. Using the logistic curve, Morocco and Singapore are among the countries with the fasted adoption rates, whereas the Czech Republic and Denmark show the lowest rates.
Regressing the Gompertz-based diffusion speeds in each country on demographic and socioeconomic parameters indicates that diffusion speed is explained by country wealth, as measured by GDP per capita, and price levels, as measured by revenue per minute (RPM). As expected, lower GDP per capita translates into lower diffusion speeds, while higher price levels prolong the time until a country reaches 50 percent 3G penetration. Based on the low R-squared of this regression, additional factors influence a country’s diffusion speed. Table 13 summarizes this.
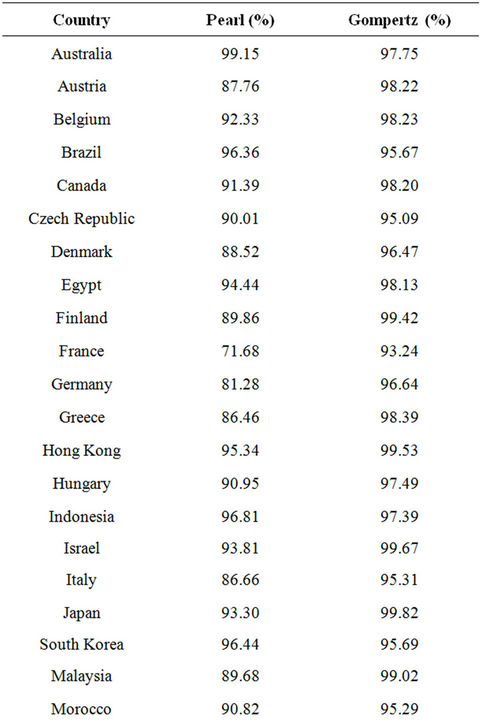
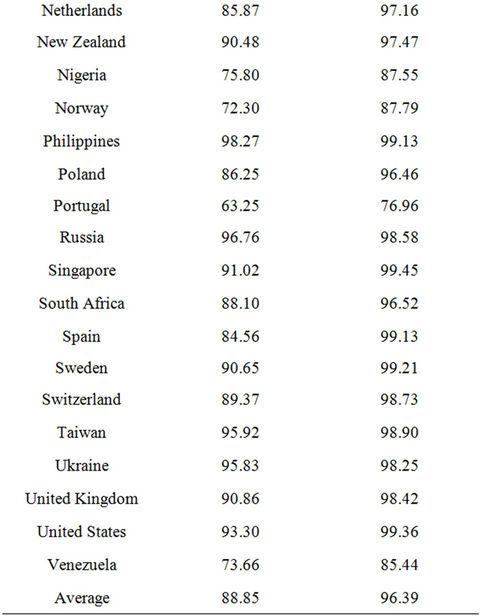
Table 10. Logistic and Gompertz diffusion goodness of fit.
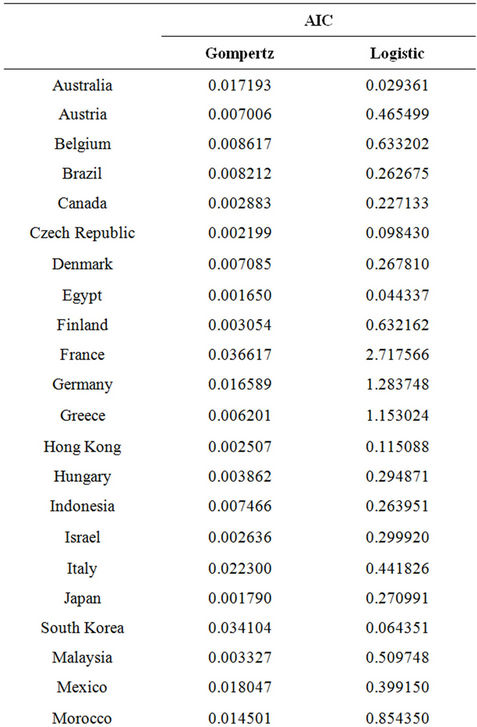
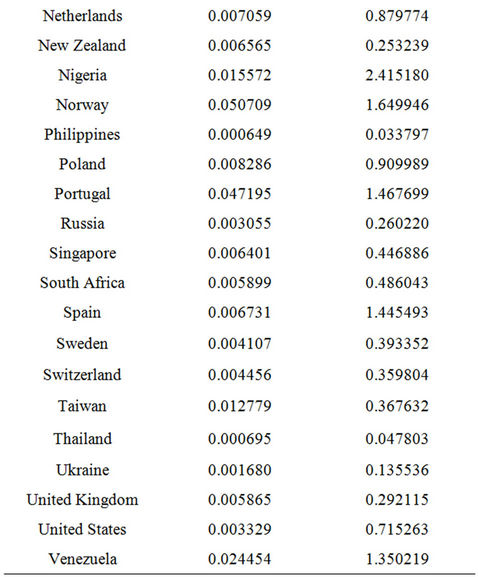
Table 11. Logistic and Gompertz diffusion Akeike Information Criterion.
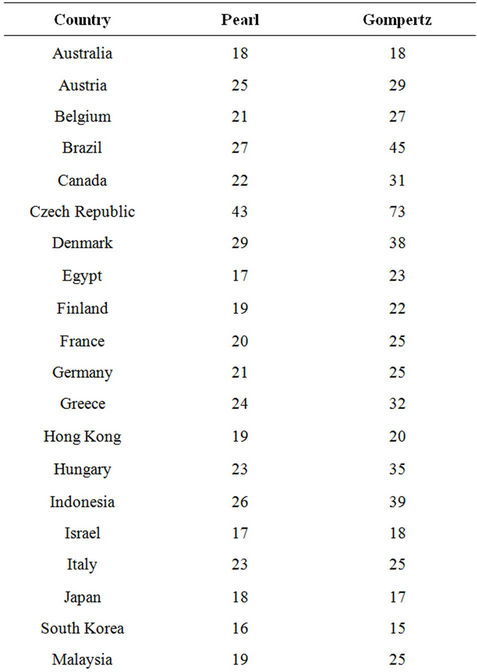
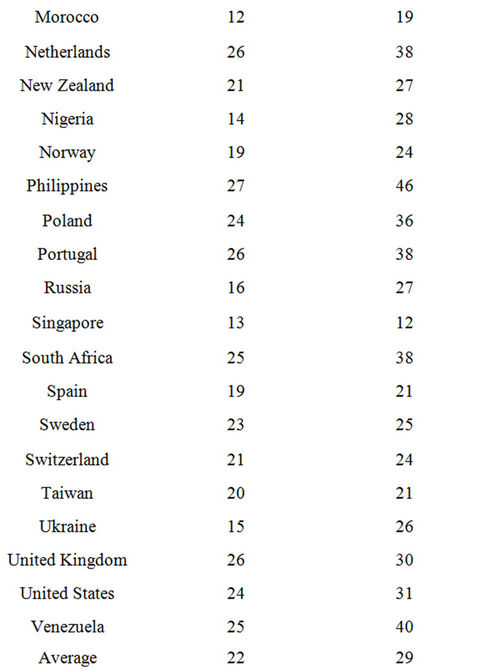
Table 12. Diffusion speed comparison number of months to reach 50 percent take-up.
7. Forecasting 3G Adoption in Selected Countries
During the writing of this paper, India was completing its 3G auction, Mexico had just completed the first few rounds of its 3G auction, and Thailand was planning to hold its 3G spectrum auction within the coming months. Because much speculation surrounds 3G take-up in these countries, the results of the time-series models in this paper are used to forecast the 3G take-up rates in these three countries. As demonstrated below, the empirical evidence produces forecasts that are much lower from those reported by analysts in previous, and even present, auctions.
7.1. India
Figure 6 shows the forecasted 3G Gompertz and logistic diffusions for India using the diffusion coefficients from four similarly situated countries. Specifically, in terms of GDP per capita, India compares closest to the Philippines and Nigeria, and, in terms of ARPU, it compares to the Ukraine and Egypt—GDP and ARPU are statistically significant variables in explaining the difference in penetration rates across countries. Assuming the rollout of 3G by year-end 2010 and averaging the penetration percentages for these four benchmark countries yields a yearend 2015 3G penetration rate for India of 32 and 75 percent using the Gompertz and the logistic curves, respectively.
Based on the finding above, which indicates that the Gompertz curve produces a superior fit relative to the logistic curve, the actual 3G penetration rate for India is expected to be closer to the Gompertz than the logistic estimates. Table 14 shows the actual forecasted penetration figures.
Reference [7] estimated a 3G penetration rate for India of between 20 and 40 percent within five years. This compares to 32 percent in this study and thus falls within mid-range. On May 24, 2010, The Economics Times reported that the research firm Crisil found that 3G subscribers should reach 100 million over the next five years. With approximately 520 million subscribers in 2009 (and not accounting for population growth), this indicates a maximum penetration rate of 19 percent. However, given the rapid pace at which India’s mobile subscribers are growing, the Crisil study seems to yield lower numbers than the ones presented above.
7.2. Mexico
Using the same forecasting approach as for India, Figure 7 shows the Gompertz and logistic curves for Mexico using four similarly situated countries. Specifically, the benchmark countries include Venezuela and Malaysia, which are similar to Mexico in terms of GDP per capita, and Poland and Brazil, which resemble Mexico in terms of ARPU.
Again, based on the superior fit of the Gompertz curve,
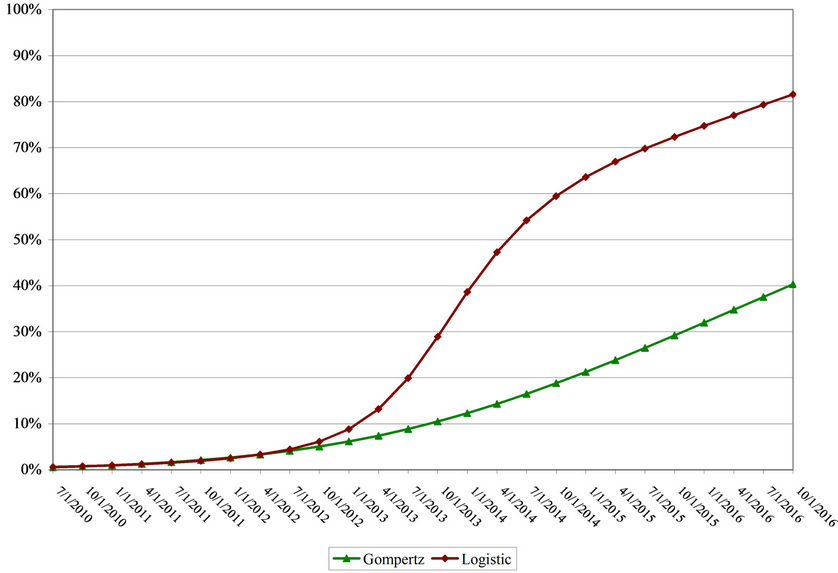
Figure 6. India forecasted 3G penetration, 2011-2016.
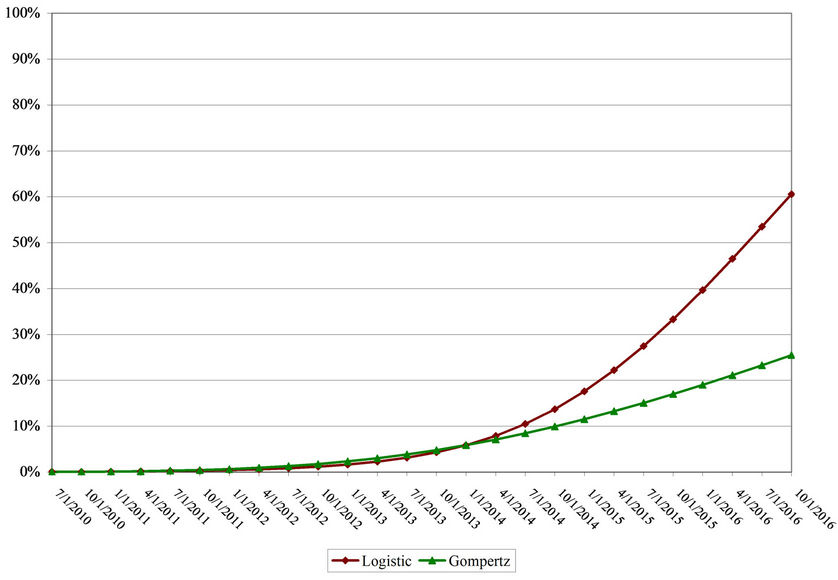
Figure 7. Mexico forecasted 3G penetration (2011-2016).
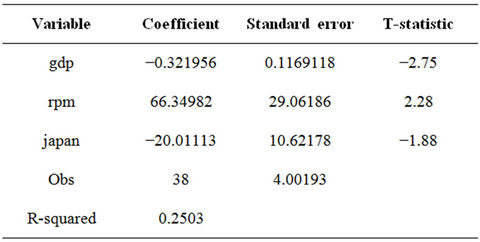
Table 13. Explaining differences in diffusion speeds.
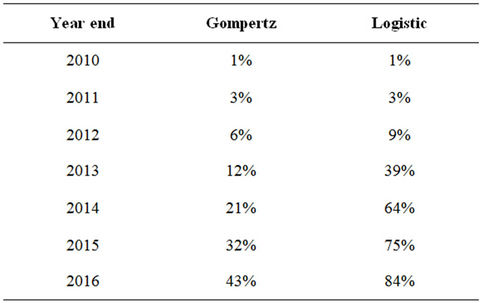
Table 14. 3G Penetration rate forecasts, India.
actual 3G penetration rates for Mexico are expected to be closer to the Gompertz than the logistic estimates. Table 15 shows that actual forecasted penetration figures.
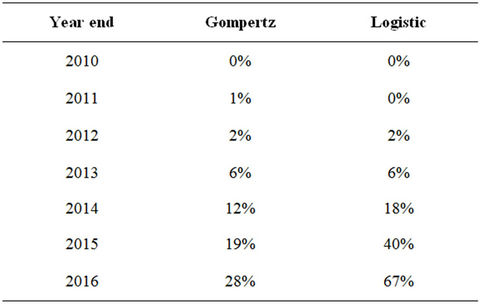
Table 15. 3G Penetration rate forecasts, Mexico.
7.3. Thailand
In Figure 8, I use the Gompertz and the logistic curves to forecast the 3G take-up rate in Thailand. The benchmark countries for Thailand include South Africa and the Ukraine in terms of GDP per capita and the Philippines and Egypt in terms of ARPU. Using year-end 2010 as the rollout date produces a conservatively high estimate because it implies that the licensing award date and service rollout date are very close.
Based on the AIC, it is doubtful that the logistic curve is the most accurate. Rather, it is more likely that Thailand will follow the patterns forecasted by the Gompertz curve. 3G penetration rates for Thailand from year-end 2010 through year-end 2016 are summarized in Table 16
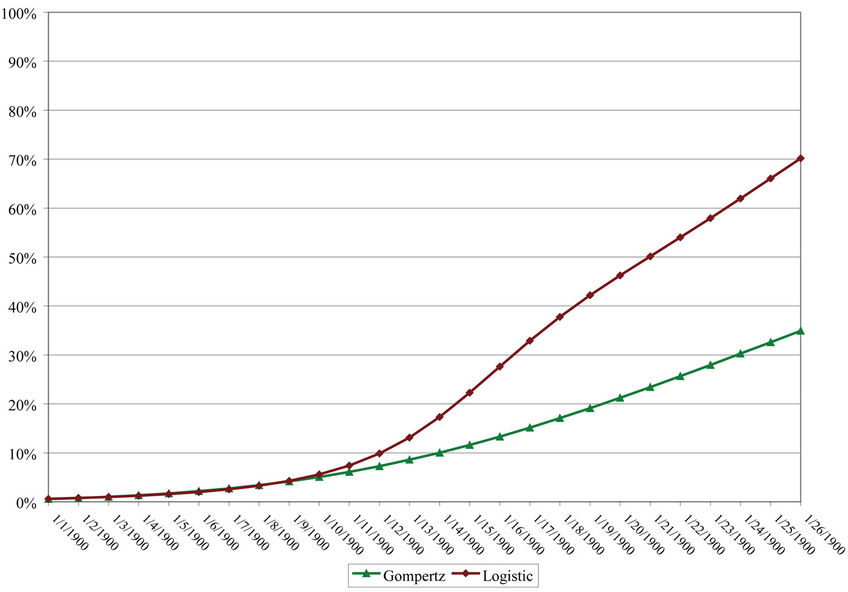
Figure 8. Thailand forecasted 3G penetration (2011-2017).
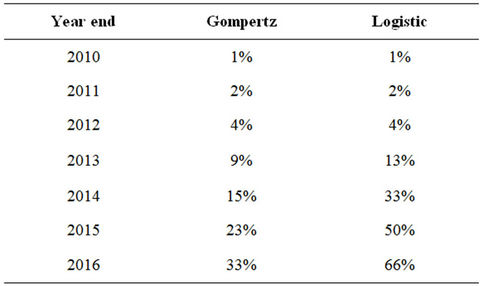
Table 16. 3G penetration rate forecasts, Thailand.
and show that Thailand’s 3G diffusion will achieve approximately 23 percent within five years.
The forecasts above are significantly lower than those found by other analysts. For instance, the research firm Pyramid forecasted that 45 percent of the residents of Thailand would subscribe to 3G by 2014 [28]. While this forecast likely was made with an anticipated rollout date of 2010, the empirical evidence suggests a significantly slower diffusion rate in Thailand.
8. Policy Implications
The study presented in this paper finds that 3G diffusion is much slower than anticipated and presents various approaches to size the market for 3G. The proper sizing of the 3G market, or any technology-based market, is crucial for regulators and operators. As many countries are in the process of allocating the next generation of spectrum (commonly referred to as 4G, although no particular technology has been agreed upon by the standards bodies) or refarming previously allocated spectrum, the study highlights that properly estimating the market potential for any new technology is crucial when determining its value. Regulators rely on accurate spectrum value estimates when setting licensing terms and allocating the scarce spectrum (for instance through an auction process). Operators must properly value the spectrum in order to support their business case for infrastructure investment and to determine their maximum willingness to pay in case the regulator decides to allocate the spectrum through an auction process. Furthermore, accurately predicting subscriber take-up rates enables operators to meet customer expectations and avoid infrastructure overor under-builds.
The study also offers practical advice to regulators in their quest to allocate scarce spectrum in an efficient manner in order to maximize social welfare gains. Specifically, as revealed by the linear probability model and the logit model, regulators can influence 3G take-up by ensuring an early rollout of the technology. As 3G penetration is a function of the time passed since 3G spectrum is allocated and 3G service is rolled out, regulators who awarded spectrum early relative to other countries have higher penetration rates. This intuitive result does not imply that the diffusion speed will be higher. It simply reflects the fact that new technologies require a certain amount of time for consumers to adopt them. In life cycle terms, this is commonly referred to as the launch period. With the HHI concentration ratio entering the binary logit model as a significant variable, regulators can promote 3G take-up by ensuring a competitive market environment.
For operators, the study indicates that short of a restricted supply of 2G services they have little influence over 3G adoption rates. The binary logit model indicates that the percentage of prepaid subscribers is a statistically significant indicator of 3G take-up. Although the decision of prepaid versus postpaid is mainly a decision made by subscribers, operators can directly influence it by making postpaid offerings relatively more attractive than prepaid. In terms of a restriction of 2G supply, this does not seem to be a viable alternative in a competitive market because unless there is collusion other operators will undermine any effort to limit the supply of 2G.
Therefore, subscribers drive the take-up of 3G and any future technology for the most part because they are the ones who decide which services they purchase. However, given the slow 3G diffusion rates, subscribers still seem to be hesitant about the capabilities of 3G relative to 2G. As the 3G download speed is usually well below 1 Mbps, one possible explanation for the slow take-up rate is that 3G services are not sufficiently differentiated from 2G services. If so, both regulators and operators can directly influence the take-up for 3G and beyond. Regulators must ensure that sufficient bandwidth is provided to allow operators to provide download and upload speeds that are clearly distinct from 2.5G speeds and are more comparable to current xDSL speeds. Similarly, operators must ensure that state-of-the-art networks are built to provide the necessary speed differentiator.
The study also reveals that the presence of MNP or the time that has passed since the introduction of MNP are not statistically significant factors in explaining differences in 3G penetration. As previously noted, this does not mean that MNP is not an effective policy tool.
9. Conclusion
This study reveals that 3G penetration can be explained by the time that has passed since the deployment of the technology, mobile penetration rates, density, market concentration, the percentage of prepaid subscribers, and the size of the population. It further shows that 3G takeup follows an s-curve diffusion pattern and most closely the Gompertz curve. The forecasts offered in the paper present 3G penetration rates for India, Mexico, and Thailand. The results show that forecasted adoption rates are well below previous reports. Finally, the study demonstrates that early deployment and a competitive playing field are key to mobile technology diffusion.
10. Acknowledgements
The author thanks Professor Kenneth Train (University of California, Berkeley), Dr. Aniruddha Banerjee (Centris), and Professor Gary Madden (Curtin University of Technology) for their constructive comments as well as Moses Namkung and Patricia Cunkelman for their research assistance. There was no third party funding for the completion of this study.
REFERENCES
- L. George, “Expectations High for 3G,” CNN.com, 14 May 2001. http://archives.cnn.com/2001/TECH/05/14/3g.george/
- G. Madden, I. Saglam and A. Morey, “Auction Design and the Success of National 3G Spectrum Auctions (Working Paper No: 10-02),” Department of Economics, TOBB University of Economics and Technology, Ankara, 2010. http://ikt.web.etu.edu.tr/RePEc/pdf/1002.pdf
- J. Wakefield, “BT Accuses Government of 3G ‘Tax’,” ZDNet.co.uk, 2001. http://news.zdnet.co.uk/internet/0,1000000097,2086122,00.htm
- S. Heng, “UMTS Broadband Mobile Technology Rolled out, Confounding Many Expectations,” Deutsche Bank Research, 2006. http://www.dbresearch.com/PROD/DBR_INTERNET_EN-PROD/PROD0000000000199922.pdf
- Forrester Research, “3G Will Become the Dominant Technology for Mobile Phones, But Not until 2010 (Press Release),” 19 January 2006.
- CDMA Development Group, “The Smart Money Is on 3G: The Accelerating Migration to 3G Technologies (White Paper),” 2006. http://www.qualcomm.com/common/documents/articles/CDG_smartmoney.pdf
- LECG, “3G Mobile Networks in Emerging Markets: The Importance of Timely Investment and Adoption (White Paper Prepared for the GSM Association),” 2009. http://www.gsmworld.com/documents/Report_GSMA_LECG_Feb09.pdf
- N. Cadima, P. Barros and P. Luis, “The Impact of Mobile Phone Diffusion on the Fixed-Link Network,” CEPR Discussion Paper No. 2598, Centre for Economic Policy Research, London, 2000.
- H. Gruber and F. Verboven, “The Diffusion of Mobile Telecommunications Services in the European Union,” 1999. doi:10.2139/ssrn.154808
- H. Koski and T. Kretschmer, “Entry, Standards and Competition: Firm Strategies and the Diffusion of Mobile Telephony,” Review of Industrial Organization, Vol. 26, No. 1, 2005, pp. 89-113. doi:10.1007/s11151-004-4085-0
- H. Gruber, “The Economics of Mobile Telecommunications,” Cambridge University Press, Cambridge, 2001. doi:10.2277/0521843278
- A. Botelho and L. C. Pinto, “The Diffusion of Cellular Phones in Portugal,” Telecommunications Policy, Vol. 28, No. 5-6, 2004, pp. 427-437. doi:10.1016/j.telpol.2003.11.006
- K. Ishii, “Internet Use via Mobile Phone in Japan,” Telecommunications Policy, Vol. 28, No. 1, 2004, pp. 43-58. doi:10.1016/j.telpol.2003.07.001
- S.-L. Jang, S.-C. Dai and S. Sung, “The Pattern and Externality Effect of Diffusion of Mobile Telecommunications: The Case of the OECD and Taiwan,” Information Economics and Policy, Vol. 17, No. 2, 2005, pp. 133-148. doi:10.1016/j.infoecopol.2004.05.001
- M. Tallberg, H. Hämmäinen, J. Töyli, S. Kamppari and A. Kivi, “Impacts of Handset Bundling on Mobile Data Usage: The Case of Finland,” Telecommunications Policy, Vol. 31, No. 10-11, 2007, pp. 648-659. doi:10.1016/j.telpol.2007.08.007
- C. Michalakelis, D. Varoutas and T. Sphicolpoulos, “Diffusion Models of Mobile Telephony in Greece,” Telecommunications Policy, Vol. 32, No. 3-4, 2008, pp. 234- 245. doi:10.1016/j.telpol.2008.01.004
- L. Fuentelsaz, J. P. Maícas and Y. Polo, “The Evolution of Mobile Communication in Europe: The Transition from the Second to the Third Generation,” Telecommunications Policy, Vol. 32, No. 6, 2008, pp. 436-449. doi:10.1016/j.telpol.2008.04.008
- L. Grzybowski and P. Pereira, “The Complementarity between Calls and Messages in Mobile Telephony,” Information Economics and Policy, Vol. 20, No. 3, 2008, pp. 279-287. doi:10.1016/j.infoecopol.2008.06.005
- S. A. Taher, “Technology and Innovation in the Diffusion Process of 3G Mobile Phones in Japan,” 4th Communication Policy Research, South Conference, Negombo, 7 December 2009. http://ssrn.com.abstract=1554226
- I. Vogelsang, “The Relationship between Mobile and Fixed Line Communications: A Survey,” Information Economics and Policy, Vol. 21, No. 1, 2010, pp. 4-17. doi:10.1016/j.infoecopol.2009.12.002
- J. Hwang, Y. Cho and N. V. Long, “Investigation of Factors Affecting the Diffusion of Mobile Telephone Services: An Empirical Analysis for Vietnam,” Telecommunications Policy, Vol. 33, No. 9, 2009, pp. 534-543. doi:10.1016/j.telpol.2009.06.003
- W. H. Greene, “Econometric Analysis,” 6th Edition, Prentice Hall, Upper Saddle River, 2008.
- R. Bewley and D. G. Fiebig, “A Flexible Logistic Growth Model with Applications in Telecommunications,” International Journal of Forecasting, Vol. 4, No. 2, 1988, pp. 177-192.
- B. Gompertz, “On the Nature of the Function Expressive of the Law of Human Mortality, and on a New Mode of Determining the Value of Life Contingencies,” Philosophical Transactions of the Royal Society of London, Vol. 115, 1825, pp. 513-585. doi:10.1098/rstl.1825.0026
- L. P. Rai, “Appropriate Models for Technology Substitution,” Journal of Scientific & Industrial Research, Vol. 58, No. 1, 1999, pp. 14-18.
- A. L. Porter, A. T. Roper, T. W. Mason, F. A. Rossini and J. Banks, “Forecasting and Management of Technology,” John Wiley & Sons, Inc., New York, 1991.
- S. Massini, “The Diffusion of Mobile Telephone in Italy and the UK: An Empirical Investigation,” Economics of Innovation and New Technology, Vol. 13, No. 3, 2004, pp. 251-277. doi:10.1080/10438590410001628396
- T.-H. Kim, “Hurdles until the End for 3G in Thailand,” Pyramid Research Analyst Notes, 2009. http://www.pyramidresearch.com/points/item/091021.htm#
NOTES
1The High Income OECD member list is composed of OECD members with Gross National Income (GNI) per capita of US$11,906 or more in 2008, as classified by the World Bank (see http://stats.oecd.org/glossary/detail.asp?ID=1231).