Journal of Water Resource and Protection
Vol.11 No.08(2019), Article ID:94436,29 pages
10.4236/jwarp.2019.118059
Prioritization of W. Alarab Sub-Watersheds (North Jordan) for Conservation Measures Using RS, GIS, and Multi-Criteria Analysis
Yahya Farhan1 , Samer Nawaieh2
1The Trustee Council for Al-Ahliya University, Amman, Jordan
2Yarmouk University, Department of Geography, Irbid, Jordan

Copyright © 2019 by author(s) and Scientific Research Publishing Inc.
This work is licensed under the Creative Commons Attribution International License (CC BY 4.0).
http://creativecommons.org/licenses/by/4.0/


Received: June 24, 2019; Accepted: August 17, 2019; Published: August 20, 2019
ABSTRACT
Soil erosion and high sediment flow are of eminent environmental concern in Wadi Alarab catchment, northern Jordan. The objective of this research is to conduct a prioritization scheme using RS, GIS, and multi-criteria analysis approach based on morphometric analysis, land use/land cover (LULC) change analysis, and soil loss modeling based on RUSLE model factors. ASTER GDEM and Arc GIS were utilized to delineate watersheds and extract the drainage networks using the Arc Hydro tool. Five basic morphometric parameters, five linear and five shape parameters, six LULC classes, and five soil erosion risk classes are applied to prioritize 13 sub-watersheds connected to W. Alarab basin. LANDSAT images were subjected to supervised classification (the Maximum Likelihood Method) to determine land use/cover changes and to establish the LULC map/layer. Soil erosion risk classes were estimated using the RULSE model. RULSE factors (R, K, L, S, C, and P) were calculated in a GIS environment, then multiplied together so as to estimate soil loss (ton·ha−1·yr−1) and to establish a soil erosion risk map for the entire watershed and the thirteen sub-watersheds. A GIS-based integration of the three layers compiled for each criterion reveals that six sub-watersheds (1, 5, 8, 9, 10, and 11) are categorized under low priority. Further, three sub-basins (4, 12, and 13) are fall under moderate priority, and four sub-basins (2, 3, 6, and 7) are designated as of high priority. It is obvious that 53.8% of these sub-basins must be prioritized immediately for soil and conservation measures. The validity of the achieved priority classes was tested statistically using Discriminant Analysis (DA), and the results showed that morphometric parameters, LULC analysis, and soil loss are accepted criteria for prioritization. These results are intended to help decision-makers to prepare reliable soil erosion management plans.
Keywords:
Prioritization, Morphometric Analysis, LULC, Soil Erosion Modeling, Validation, Discriminant Analysis (DA)

1. Introduction
Land degradation in Jordan has become an environmental concern for soil and water conservation planners, watershed managers, and land resource developers. Land degradation in the rainfed highlands is attributed largely to soil erosion by water, destruction of vegetation cover over the last 3000 years, land use abuse, agricultural intensification, and improper utilization of catchment resources [1] [2]. The presence of historical contour stone terraces, indicates that the rainfed agricultural region has experienced severe soil erosion at least since the Nabatean period, 3000 years ago [3].
At present, a prominent deficiency of soil and conservation measures and increased derelict land serve to accelerate soil erosion loss. It has been verified in the recent past that the predicted annual average of soil loss over the Wadi Kufranja catchment (northern Jordan) was “5 < ASL < 50 ton·ha−1·yr−1” [4] (where ASL = Annual Average Soil Loss), and the average annual soil loss over Wadi Kerak was 64 ton·ha−1·yr−1. Further, 54.5% of the watershed is prone to high and extremely high soil erosion loss greater than 25 ton·ha−1·yr−1 [1]. Such figures greatly exceed the acceptable soil loss tolerance level (from 2.5 to 12 ton·ha−1·yr−1) [5] [6]. It is also argued that any loss of soil greater than 1 ton·ha−1·yr−1 is deemed as irreversible in a lapse of time between 50 and 100 years [7]. The expansion of rainfed “mixed” farming (i.e., cereals cultivation) since the 1950s over the northern and southern highlands has induced a substantial increase in soil erosion, and a decline in soil fertility [8]. Consequently, cultivated lands with poor conservation measures experience high rates of soil erosion loss, which exceeds the acceptable tolerance level of soil loss.
Exceptional heavy rainstorms, associated with extreme daily rainfall intensity, varying from 2.1 to 6.66 mm·hr−1, are recurrent events in Jordan [9] [10]. Therefore, high soil erosion loss, landslide events, and flooding are predictable in the rainfed region of the highlands. Various qualitative and quantitative surveys/studies were conducted since the 1960’s and focused on soil erosion and conservation. The earliest surveys were carried out in the northern, central, and southern high lands of Jordan [11] [12] [13]. The predicted average annual sediment yield was computed for the Zarqa River using the AGNPS model [14] , and for the Wadi Mujib watershed [15] and the Wadi Wala catchment [16] using the SWAT model. The rate of siltation in Wadi Alarab reservoir was estimated at 0.4002 × 10⁻⁶ m3. Accordingly, it is expected that the reservoir will be filled with sediment in a period of 38 years maximum [17].
In situ field measurements of soil erosion using different techniques were employed on soils of sub-humid [18] [19] , semi-arid [20] [21] and arid climatic zones of Jordan [22]. Recently, an estimation of soil erosion loss rates was carried out for the Wadi Kufranja, northern Jordan [4] and Wadi Kerak, southern Jordan [1] using the RUSLE model, which denotes a continuous decline in soil fertility and productivity. The prioritization of a watershed has been prescribed as the procedure which led to recognizing high erosion-prone areas, which is deemed, of high potential for implementing conservation activity so as to provide proper conservation measures. It is often difficult to carry out conservation activities over the entire watershed. For that reason, it is pragmatic to recognize the critical areas of the watershed to prioritize them in terms of soil erosion potential. Such procedures are essential to improve soil conservation and watershed management plans [23] [24]. Sustainable agriculture can be achieved through reducing the erosivity effect on soil loss while increasing infiltration rates and water availability in the soil profile. The adoption of soil and water conservation measures “priority-wise” is aimed at helping decision makers in their planning for efficient soil and water conservation programs to reduce soil erosion and sediment yield over a watershed [25] [26].
Morphometric parameters of drainage basins and LULC analysis are substantial factors to understand the geomorphic and anthropogenic control of the soil erosion process. LULC parameters exercise a considerable impact on drainage network patterns, and significantly affect erosion susceptibility of the sub-watersheds [27]. Furthermore, soil loss rates depend on several geo-environmental factors; thus, the detection of areas with high susceptibility to erosion is feasible using morphometric parameters, LULC change, and soil loss modeling data [28]. Prioritization studies have recently demonstrated the significance of RS, GIS, analysis of morphometric parameters, land use/land cover analysis and soil loss modeling, in ranking different sub-basins according to the order in which they have to be taken for conservation measures. Adoption of conservation programs in concordance with a priority method will minimize soil erosion rates, thus increasing moisture on the farm, and in turn reducing the impact of drought and the probability of flooding [29] - [35]. Wadi Alarab is mainly a rainfed farming watershed. In the recent past, irrigated cultivation was practiced by local farmers along scattered patches of narrow accessible Wadi bottoms (<15 m in width). Intensive vegetable farming is practiced at present in the Ghor area following the construction of the Wadi Alarab dam in the mid 1986. Although the kinetic energy of rainfall events in northern Jordan using the RUSLE [36] was estimated at between 200 and 400 MJ mm·ha−1·h−1·yr−1 [37] , such figures are low compared to humid areas. Nevertheless, other factors such as the deterioration of vegetation cover and soil layer reduce the retention potential in the catchment and lead, together with high-intensity rainfall events, to flash flooding. These short-term peak discharges are characteristic of the rift catchments and result in a high erosive impact on slopes including Wadi beds [38]. In light of repetitive flash flooding and the immense erosion potential, high soil erosion rates and sediment yield loads exhibit potential areas to promote conservation activity instantly in order to support agricultural sustainability.
The present study is intended to achieve the following:
1) Prioritize 13 sub-watersheds connected to the W. Alarab catchment, based on and GIS, and the analysis of morphometric parameters, LULC change analysis, and soil loss modeling.
2) Generate three separated priority maps based on the three criteria using GIS tools.
3) Integration of the three layers to perform the final map which shows the priority classes of low, moderate, and high.
4) Test the validity of the final priority classes by means of Discriminant Analysis (DA).
W. Alarab is considered a vital rural support catchment in northern Jordan, thus, the findings of the present analysis are significant for future soil and water conservation planning and water resources management in the northern region of Jordan.
2. Study Area
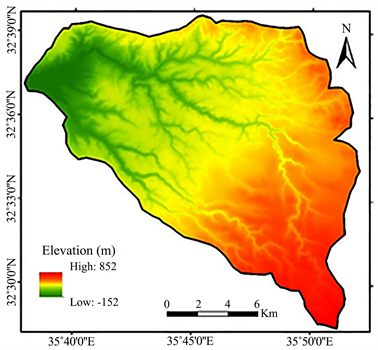
The Wadi Alarab watershed is part of the northern Jordanian highlands, draining to the Jordan River. The catchment is located between 32˚28' to 32˚40'N latitude, and 35˚38' to 35˚53'E longitude (Figure 1). It attains a maximum elevation of 852 m (a. s. l) in the south east of the catchment, to −152 m (b. s. l) in the northwest close to the Wadi Alarab reservoir (Figure 2(a)). The watershed covers an area of 262.5 km2. The middle and upper catchment consists of maturely dissected topography, with relatively narrow Wadi bottoms and broad interfluves characterized by gentle (0˚ - 5˚) and moderate (5˚ - 10˚) slope categories. The gentle broad interfluves represent remnants of the Miocene-Pliocene erosion surface [39]. The major lower courses are deeply incised gorges, with prominent morphological breaks appearing on the valley cross-sections and
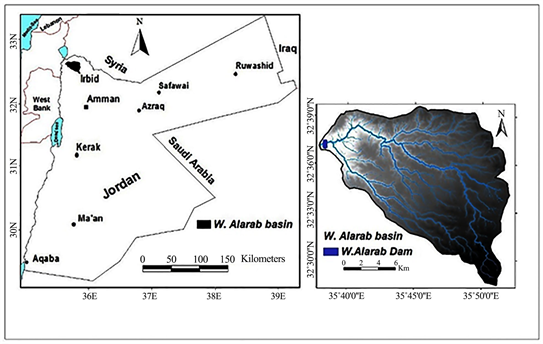
Figure 1. The study area.
 (a)
(a)
 (b)
(b)
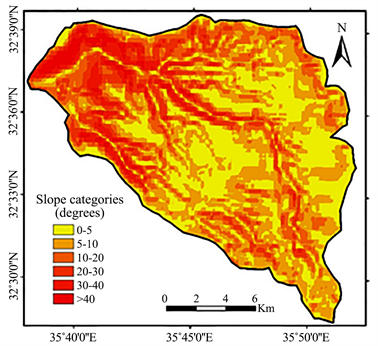
Figure 2. (a) The DEM of W. Alara; (b) Slope categories of W. Alarab.
longitudinal profiles, due to lithological variation and rejuvenation [40]. The main Wadi courses are of the V-Shape type associated with steep valley-side slopes. Slope categories of 20˚ - 30˚ and 30˚ - 40˚and more dominate the lower catchment (Figure 2(b)). Wadi Alarab is at the youth age stage of geomorphic development, with a convex upward hypsometric curve, and the hypsometric integral (HI) value is 63% [41]. Thus, high soil erosion rates and sediment yield are expected to be high over the rejuvenated belt which characterizes the dissected denudational highlands and fault scarp overlooking the Rift (Ghor).
From the early Miocene to Pleistocene, progressive subsidence and lowering of the Dead Sea level caused rejuvenation of the drainage basins draining to the rift, including W. Alarab; consequently, incised drainage systems characterize the lower Wadi courses. The oldest rock units are exposed south east, i.e., Amman silicified limestone, Muwaqqar chalk marl, and Umm Rijam chert-limestone of Upper Cretaceous age, whereas the youngest rocks are exposed north west, i.e., Waqqas conglomerate of the Pliocene age, and basalt of 5.1 Ma [42]. A “Dry Mediterranean” climate (Csa) dominates the upper part of the watershed, while semi arid (Bs), and arid (BW) climates characterize the lower part. Mean annual rainfall ranges from 585 mm in Irbid city to 390 mm at the summits of the faulted-erosional escarpment east of the reservoir. Potential evapotranspiration varies from 1313 mm·year−1 SE of the watershed, to 1425.5 mm·year−1 in the NW [38]. On the top of the valley side slopes, the broad remnants of erosion surfaces are covered with Calcaric Cambisols and Chromic, and Vertic Cambisols, with basaltic parent materials [43]. Wadi deposits are classified as Regosols, and the old terraces soil is Fluvisols. The dominant major land use/cover classes are: bare rocks (34%), olive plantations (27%), bush vegetation of low Maquis (11%), agricultural fields (14%), built-up area/rural settlements (14%), and forest and water bodies (0.4%) [38]. The city of Irbid extends over a broad level/ undulating planation surface at the eastern water divide area between the upper Wadi Shallala (a tributary of the Yarmouk River) and Wadi Alarab, at an elevation of 580 m (a. s. l). The built-up area of the city occupies three shallow sub-basins, hence they are excluded from the present study. The population of the city is estimated at some 400,000 inhabitants, while the total population of the Irbid Qasabah District approaches 460,000 inhabitants [44]. The Irbid agglomeration, along with the rural settlements which are scattered over the watershed, represents serious population pressure on land and water resources of the catchment.
3. Materials and Methods
Topographic maps of a scale 1:50.000 were purchased from the Royal Jordanian National Geographic Center (RJNGC), Amman. The topo-sheets were scanned, geo-referenced, and transformed to a zone 36 N projection system using Arc GIS 10.1. The Wadi Alarab watershed and the 13 sub-watersheds were delineated using topographic sheets. The ASTER DEM (30 m resolution) was employed to extract the drainage networks using the Arc Hydro extension. A threshold greater than 300 was adopted to extract the drainage network. The Wadi Alarab catchment is classified as a fifth-order basin, whereas the delineated 13 sub-watersheds are of third-order. Stream order was designated using the stream ordering system elaborated by [45] and [46]. Slope classes (degrees) and elevation (m) maps were prepared using ASTER GDEM.
Fifteen morphometric parameters (basic, linear, and shape parameters) were calculated to illustrate the morphometric characteristics of Wadi Alarab catchment and the 13 sub-watersheds (Table 1) using DEM, GIS 10.1 software, and the mathematical equations developed in previous studies elsewhere [30] [45] [47]. The basic parameters include: Area (A), Basin length (Lb), Perimeter (P), Stream order (u), and Stream Length (Lu). Whereas five linear morphometric parameters, and five shape parameters were considered in prioritization of the 13 sub-basins based on morphometric approach. The linear and shape parameters are designated as “erosion risk parameters” [29] [30]. The linear parameters employed in prioritization include: Bifurcation ratio (Rb), Drainage density (Dd), Stream frequency (Fs), Texture ratio (Tr), and Length of overland flow (Lo). Likewise, the utilized shape parameters consists of: Shape factor (Bs), Form factor (Rf), Circularity ratio (Rc), Elongation ratio (Re), and compactness coefficient (Cc). Morphometric parameters perform a crucial role in understanding lithological composition, soil characteristics, hydrological behavior, and erosion status over a drainage basin [48]. Figure 3 displays the methodology employed in the present study.
3.1. Extraction of Morphometric “Erosion Risk Parameters”
The bifurcation ratio (Rb) refers to the ratio of streams number of a given order to the number of the streams of the next higher order [45] , and it is computed by:
(1)
where:
Nu = total number of stream segments of order “u”
Nu + 1 = number of segments of the next higher order
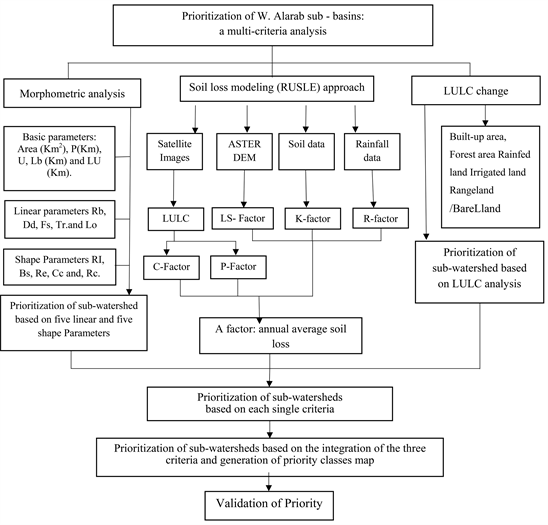
Figure 3. Methodology adopted in the present study.

Table 1. Morphometric characteristics of the 13 sub-Watersheds and Wadi Alarab basin.
The bifurcation ratio has been developed as an index of relief and dissection. Rb values of drainage basins vary from 2 for flat-undulating or rolling terrain, to 6 for heavily distorted drainage network by geological structure [45] [46]. High Rb values indicate high overland flow and an early hydrograph peak with a high potential of susceptibility to flash flooding during exceptional heavy rainfall [49]. As a result, soil erosion rates and sediment discharge increased in the main channel.
Drainage density (Dd) represents the total length of streams in a drainage basin per unit area [45] [50] [51] , or
(2)
where:
A = the basin area
Lu = the total stream length
Dd is a measure of topographic dissection and runoff potential of the drainage basin. High Dd value indicates high runoff, a rapid stream response, and in turn, a low infiltration rate. Whereas low drainage density of a watershed denotes low runoff and high infiltration [52].
Stream frequency (Fs) is the ratio of the total number of streams (Nu) of all orders in a drainage basin to the catchment area (A) [45]. It is displayed by the following equation:
(3)
Fs values are positively correlated with Dd values of a watershed. Low Fs values imply a relatively low infiltration rate of surface water, and thus a low ground water potential [53]. High stream frequency denotes more infiltration, and in turn high groundwater potential.
Texture ratio (Tr) Tr refers to the ratio of the total number of streams of the first order (N1) to the perimeter of the drainage basin. It is considered to be a significant parameter in drainage basin morphometric assessment. Tr parameter counts on slope deposits and lithology, infiltration capacity and topographic conditions [27]. Texture ratio is computed by:
(4)
where:
Nu = the total number of streams of all orders
P = perimeter (km)
Length of overland flow (Lo) is determined by the equation:
(5)
where:
H = basin relief (Bh) m
Lb = basin length (km)
Lo is the length of water over the ground before it is concentrated into definite stream channels [45]. Lo variable is one of the most significant independent variables influencing both hydrographic and hydrologic development of drainage basins. This parameter is related inversely to the average slope of the channel and is equivalent to a large extent to the length of sheet flow.
Form factor (Rf): According to [45] , Rf is computed using the following equation:
(6)
Rf is determined by the ratio of the drainage basin area, to the square of the basin length [46]. Higher values of Rf imply a more circular shape of a drainage basin, while smaller Rf values (<0.45) denote that the basin is elongated in shape.
Shape factor (Bs) represents the ratio of the square of the basin length to the area of the basin, or
(7)
Shape factor provides a conception regarding the circular character of the catchment. The greater the circular character, the greater, or fast response of watersheds following an intense rainstorm [54].
Elongation ratio (Re) is elaborated by Schumm [1956] according to the following equation:
(8)
Low values of Re indicate that the catchment is more elongated. Where the Re value approaches 1.0, the shape of the drainage basin becomes a circular shape.
Compactness coefficient (Cc) is developed by [55] , and defined as the ratio of perimeter of a watershed to circumference of the circle area, which is equal to the area of the watershed. Cc is computed according to the following equation:
(9)
where:
P = perimeter of the basin (km)
A = area of the basin (km2)
When Cc value is 1, it implies that the watershed is a perfect circle. If the Cc value is 1.28, the basin is more square-shaped. The catchment is considered highly elongated when the Cc value > 3.0 [56].
The circularity ratio (Rc) of a drainage basin is computed according to:
(10)
where:
(A) is the basin area, and (P) is the perimeter [57]. If Rc value is close to 1, the shape of a basin is circular. Low, medium, and high values of Rc indicate young, mature, and old stages of geomorphic development of the catchment respectively.
3.2. Land USE/Land Cover (LULC) Change Analysis
Land use/land cover change analysis was performed using ENVI (V.4.5-2015) software. LANDSAT 5 (TM), May 1989, and LANDSAT 8 (OLI), May 2017 were downloaded from the website http://earthexplorer.usgs.gov, having a ground resolution of 30 m × 30 m for blue, green, red, and NIR bands. Subsequently, supervised classification using the Maximum Likelihood Method was employed to classify land use/land cover based on the classification system developed earlier [58]. Two Land use/cover maps were generated to represent LULC classes exist in 1989 and 2017 along with LULC changes that took place during this period. NDVI values were generated and mapped from a LANDSAT image to determine the C factor so as to verify Land use/cover information with a limited field check. C-factor and P-factor layers were also prepared. LULC change (increase or decrease was shown in area (km2) and percentage (of the total area) under each LULC class for 1987 and 2017. The recognized LULC classes in Wadi Alarab watershed strongly affect soil erosion.
Prioritization ranking of sub-basins was designed on the basis of the percentage areas under each LULC category. The highest percentages of classes that directly induce soil erosion, such as bare land, were considered the maximizing criteria; whereas the highest percentages of classes that restrain erosion, such as forest, were considered the minimizing criteria. The higher the value of land cover category showing positive change, the lower the rank assigned to it. Whereas the higher the value of LULC category showing negative change, the higher the rank assigned to it [27] [34] [59]. Based on the above assumption, ranking of the LULC class for each sub-watershed was ascribed. The average of ranks pertaining to LULC categories exist in each sub-basin, representing the compound value (Cp). Thus, sub-basins were prioritized based on the surpassing ranking method, as low (>7.5), moderate (6.1 - 7.4) and high (<6.0) priority.
3.3. Soil Loss Prediction: The RUSLE Approach
The RUSLE is an empirical soil erosion model employed to estimate the average annual soil loss with reference to cropping systems, land management conditions, and erosion control practices [60]. Specifically, the model was developed to guide soil conservation plans to control soil erosion [61] [62]. The most widely used model describes how climate (rainfall erosivity), morphology (slope length and slope steepness), soil attributes (soil erodibility), vegetation and land use/land cover (cover management practice) affect rill and sheet erosion induced by raindrop impact and surface runoff [36]. The average annual soil loss of (A) in tons per hectare per year was quantified using RUSLE, according to the following equation:
where:
A denotes the average annual soil loss due to rill and sheet erosion (ton·ha−1·yr−1);
R refers to the rainfall-runoff erosivity factor (MJ mm·ha−1·hr−1·yr−1);
K represents the soil erodibility factor (soil loss per erosion index unit for a specified soil measured on a standard plot, 22.1 m long, with uniform slope 2.13, in continuous tilled fallow) [ton−1·ha−1·hr−1·ha1·MJ−·mm−1];
LS is the slope/length and slope steepness factor (dimensionless);
C is the cover management practice factor (values range from 0.0 to 1.5) (dimensionless);
P indicates the support practice factor, or erosion control practices factor (ratio of soil loss with a support practice (i.e., contour tillage, strip-cropping, and terracing) to soil loss with row tillage parallel to the slope (values vary from 0.0 to 1.0) (dimensionless).
RUSLE factors were mapped in a GIS raster format using Arc GIS spatial analyst since soil erosion varies spatially. Thus, the estimated annual average soil loss was realized on a cell-by-cell bases [61] with 30 × 30 m grid cell size, so that spatial variation of soil erosion can be considered in order to recognize the spatial patterns of soil loss. The process of deriving RUSLE factors from satellite data, DEM, soil and rainfall data are discussed elsewhere [1] [4]. The rank was assigned on the basis of areas percentages under each soil loss category. The higher the percentage of soil loss category in a particular sub-watershed was assigned the highest priority/rank designated to it, and the lower value was given low priority rank and so on [34]. In this way the, ranking of soil loss category for each sub-watershed was determined. The rankings of soil loss category for each sub-watershed were averaged in order to achieve the compound value (Cp) based on rankings. The highest and lowest soil loss rates by area percentages pertaining to the 13 sub-basins are calculated and provided. The sub-watersheds were classified into five priority classes as low (>8), moderate (6.4 - 7.9), high (4.6 - 6.3), very high (2.8 - 4.5), and severe (<2.7).
The set of tools provided by the GIS software were used to integrate multiple criteria based on the derived overlays which represent priority obtained using morphometric analysis, land use/cover change, and priority performed based on soil loss modeling. Using a geo-processing tool, it was possible to overlay the three raster layers/data deduced, multiplying each of them by a given appropriate weight, and then summing up together the scores to generate the final multi-criteria priority map based on the aforementioned approaches for the sub-watersheds under consideration.
3.4. Validation of Multi-Criteria Analysis Results
Discriminant Analysis (DA) was utilized to test statistically the validity of priority groups of sub-basins generated based on the integration of multi criteria analysis, and to decide if they are significantly different from each other, and also to help in explaining regional spatial difference among the third-order sub-watersheds in term of prioritization. The results are intended to verify that soil erosion risk and geomorphic conditions are found entirely different from one priority class to another. Through DA, each sub-watershed can be related to a set of discriminant functions by calculating its “scores” on those functions. The mean value of these scores, on each discriminant function, can be computed for each priority class [63] [64] [65]. The mean values are then utilized to test if the priority classes are significantly different from each other, or if the resultant priority classes are accepted or not.
4. Results and Discussion
4.1. Morphometry of Wadi Alarab and the Sub-Watersheds
The area of a drainage basin (A) is considered a major parameter in hydrological processes. The maximum discharge of flood per unit area is inversely related to the size of the catchment [66]. The total area of Wadi Alarab is 262.5 km2, and for the 13 sub-watersheds, it ranges from 3.4 km2 to 23.7 km2 (Table 1). The basin length (Lb) of the catchment is 25.9 km, while the length of the sub-basins varies from 2.2 km to 13.5 km. The perimeter (P) of Wadi Alarab is 74.6 km, and the perimeters of the sub-watersheds range from 9.5 km to 43.0 km. Sub-watershed no. 6 (2.2 km) represents the shortest in length (Lb), and sub-basin no. 10 (13.5 km) refers to the longest, with the highest perimeter and the largest area (18.4 k2), whereas sub-basin no. 6 is the smallest (3.4 k2). The longest and the largest sub-basins have developed on a fault within the Amman silicified limestone/Al Hisa phosphorite geological unit. By contrast, the shortest sub-basin in length, and the smallest in area is located at the northwestern border of the main watershed on steep dissected slopes (30˚ - 40˚). The watershed has a drainage density (Dd) value of 1.54, which denotes high permeability of the sub-surface materials. Likewise, the drainage density for the sub-basins varies from 1.1 to 1.8. Low values of stream frequency (Fs) were achieved for both the entire watershed (Fs = 2.23), and the sub-watersheds (Fs values range from 0.9 to 2.9). The value of drainage texture (Tr) for the Wadi Alarab catchment is 7.8, and the values for the sub-watersheds range from 0.3 to 0.9, which indicate coarse drainage and high runoff (Table 1). The entire catchment shape (Bs) value is 2.5, and for the 13 sub-watersheds values vary from 1.4 to 11.0. These figures denote that sub-watersheds are elongated and more elongated, with relative high peak flooding. Low circularity ratio (Rc) (0.1 - 0.5) suggests that these sub-basins are elongated. The computed elongation ratio (Re) ranged from 0.3 to 0.9 which indicates that the sub basins areas are characterized by high runoff capacity along the stream flow path, a phenomenon associated with high relief and steep slopes [47]. The values of form factor (Rf) vary from 0.10 to 0.70. This implies that the basins have more elongated shape in nature with a prominent flatter peak flow for a long duration. Thus, elongated basins are more highly vulnerable to flood flows than circular-shaped basin areas. Similarly, basin relief (Bh) (1004 m) and relief ratio (Rr) (38.7) values testify to the intensity of the erosion process operating on steep slopes characterized by low infiltration and high runoff conditions [67].
4.2. Mophometric Analysis and Sub-Watersheds Priority
The linear and shape parameters were employed to prioritize the 13 sub-watersheds related to Wadi Alarab. It has been reported earlier that linear parameters confirm a direct relationship with erodibility. The higher the linear variables, the greater the erodibility is. The highest value of the linear parameter was ranked 1, the second highest value ranked 2 and so on. Alternatively, shape parameters maintain an inverse relationship with erodibility. Therefore, the lower their values, the greater the erodibility is. The lowest value of shape parameter was rated as rank 1 and the second lowest as rank 2 and so on [26] [29] [30] [32] [68]. The Compound parameter (Cp) score was calculated by summing up all the ranks of linear parameters as well as shape parameters, and then dividing by the numbers of all parameters (i.e., 10 in the present study). Further, the sub-watershed having the lowest compound parameter (Cp) score, was assigned the highest priority, the next higher value was designated as second priority and so on [26]. Highest priority denotes the greater the degree of soil erosion in that particular sub-watershed; therefore, it is considered a potential area for applying soil conservation measures [69]. Based on present morphometric analysis and the final ranking of Cp values (Table 2), the sub-watersheds of Wadi Alarab were then classified into four priority groups:
1) Low priority (>5.0)
2) Moderate priority (4.3 - 4.9)
3) High priority (3.6 - 4.2)
4) Very high priority (3.0 - 3.5)
Consequently, on the basis of morphometric analysis, sub-watersheds nos. 10, and 12 are classified as of low priority; nos. 11 and 13 fall under moderate priority, sub-basins nos. 1, 5, 7, and 8 are ranked as high priority, and sub-basins nos. 2, 3, 4, 6, and 9 are categorized under very high priority (Figure 4). Sub-watersheds categorized as falling under the rank of high and very high priority (69% of the total) are part of the rejuvenated belt which occupied the center and lower parts of the catchment, where high soil erosion rates are common.
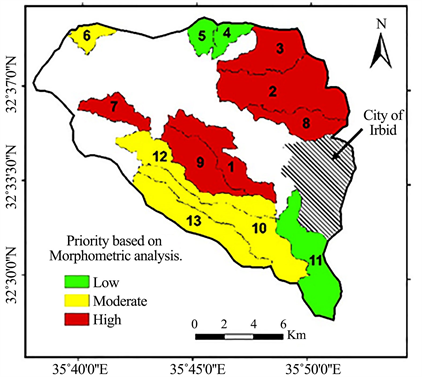
Figure 4. Priority of sub-watersheds based on morphometric analysis.
Table 2. Calculation of compound factor and prioritized ranks for the sub-basins in Wadi Alarab based on morphometric analysis.
4.3. Soil Loss Modeling and Sub-Watersheds Priority
A soil loss rates layer was computed through full integration of the RUSLE model factors in a GIS environment to generate the soil erosion risk classes map (Figure 5). Soil erosion for the entire watershed was classified into five soil erosion risk categories of: slight (0 - 5 ton·ha−1·yr−1), moderate (5 - 15 ton·ha−1·yr−1), high (15 - 25 ton·ha−1·yr−1), very high (25 - 50 ton·ha−1·yr−1), and extreme (> 50 ton·ha−1·yr−1). The spatial distribution of soil erosion risk classes showed that 74.63% of the watershed has slight soil erosion loss, 1.78% has moderate loss, 0. 58% has high loss, 17.83% has very high, and 5.18% area is under an extreme soil erosion risk class (Table 3).
In light of the high annual soil loss rates (0 - 85 ton·ha−1·yr−1), and the mean annual value (32.5 ton·ha−1·yr−1) for the entire watershed, the average annual soil loss of the 13 sub-watersheds was computed at 27.95 ton·ha−1·yr−1 (Table 4),
Table 3. Area and proportion of each soil erosion risk classes.
Table 4. Average annual soil loss (ton·ha−1·yr−1) for the 13 sub- watersheds of Wadi Alarab catchment.
*The average annual soil erosion loss for the 13 sub-basins is 27.95 ton·ha−1·yr−1.
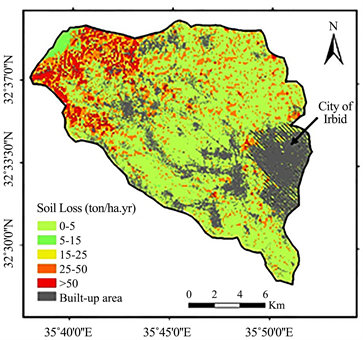
Figure 5. Soil risk classes of W. Alarab.
which significantly exceeds the acceptable soil loss tolerance (2.5 to 12 ton·ha−1·yr−1) [5] [6]. Eleven sub-watersheds (84.6%) exhibit an average soil loss less than the average annual soil loss of the Wadi Alarab watershed. Whereas two sub-basins (15.4%) show an average annual soil loss greater than the average for Wadi Alarab. The transformation of forest and rangeland in the northern highlands of Jordan; to rainfed cultivation is continuous, thus, accelerating soil erosion. The presence of considerable bare land, steep slopes, and population pressure at present contributed largely to the high soil erosion rates. Based on the present soil loss rates and the final ranking of Cp values (Table 5 and Figure 6), the 13 sub-basins were classified into five priority categories: low priority, moderate priority, high, very high, and severe. Sub-watersheds nos. 1, 10, and 11 (23% of the total) are categorized under low priority, while two sub-basins nos. 9 and 13 (15.4% of the total) are ranked under moderate priority. Four sub-watersheds nos. 2, 5, 8 and 12 (30.8% of the total) are classified under high priority, whereas two sub-basins nos. 3 and 4 (15.4% of the total) are ranked under very high priority. Two sub-watersheds nos. 6 and 7 (15.4% of the total) are categorized under severe priority. It is obvious that 61.5% of the sub-watersheds connected to Wadi Alarab are ranked under high, very high, and severe priority. Consequently, a management plan to conserve soil and water should be arranged and implemented immediately for these sub-watersheds.
4.4. Land Use/Land Cover and Sub-Watersheds Priority
A supervised classification using the Maximum Likelihood Method was carried out on LANDSAT 5 TM, 1987, and LANDSAT 8 OLI, 2017, to identify LULC changes over the Wadi Alarab catchment between 1987 and 2017. The classified images have categorized into the built-up land, forest area, rainfed farming, irrigated agriculture, rangeland, bare land, and water body. Figure 7 and Figure 8 illustrate land use/cover maps for the Wadi Alarab catchment deduced from
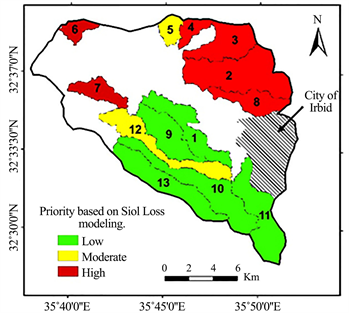
Figure 6. Priority of sub-watersheds based on soil los modeling.
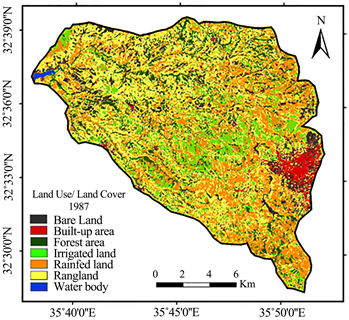
Figure 7. Land use/land cover: 1987, based on LANDSAT 5 TM.
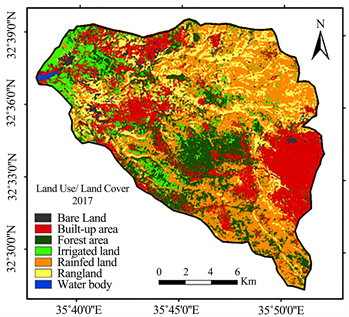
Figure 8. Land use/ land cover: 2017, based on LANDSAT 8 OLI.
Table 5. Ranks and priorities classes of sub-basins in Wadi Alarab based on soil risk classes (RUSLE model).
LANDSAT data of 1987 and 2017 respectively. Area/percentage wise statistics of 1987 and 2017 (Table 6 and Table 7) and priority classes for LULC data; show that land resources were degraded due to continuous human interference whether for cultivation, deforestation, grazing or any other form of land use. Table 6 reveals an overall expansion in the built-up area (km2) in the 13 sub-watersheds. Sub-basins 1, 12, and 13 are ranked the highest in terms of urban development, where the built-up areas reach 6 km2, 3.1 km2, and 2.5 km2 respectively. The forest areas have been deteriorated in sub-basins 13 (from 5.5 km2 in 1987 to 1.06 km2 in 2017), 1 (from 4.5 km2 to 1.06 km2), and sub-basin 9 (from 5.83 km2 to 1.24 km2). However, the forest area has been expanded in five sub-basins (2, 3, 4, 5, and 7), but on a limited scale (Table 6). Furthermore, rainfed cultivation has been increased by area in sub-basins 1, 5, 7, and 9, and decreased in the rest of the sub-basins. By contrast, the irrigated farming expanded rapidly over 11 sub-watersheds (1, 2, 3, 4, 7, 8, 9, 10, 11, 12, and 13) following the construction of the Wadi Alarab dam in 1986. Rangeland increased by area in sub-basins 1-7, and 9, but it decreased over the rest of the sub-basins. By contrast, the bare land by area has increased across the 13 sub-watersheds of Wadi Alarab (Table 6). The expansion of rural settlements was carried out mainly in central and lower parts of the catchment. Rural settlements are often located on the narrow interfluves or on middle slopes with accessibility to irrigated areas, rainfed farming and grazing areas, Moreover, the city of Irbid has notably expanded to cover almost three shallow 3rd-order sub-basins. Population pressure, and agricultural intensification (i.e., vegetable farming, tree orchards [olives and almonds], rainfed mixed farming (cereals cultivation) are prominent; consequently, susceptibility of soils to erosion is expected to increase. Cultivated land with poor conservation measures in the northern highland catchments generally experiences severe soil erosion and decline in crop productivity, and farmers suffer [1]. On the basis of LULC change (%) analysis, and the final compound values (Cp), the priority of the 13 sub-watersheds was then classified into three classes (Table 7): high priority (<6.5), moderate priority (6.1 - 7.4) and low priority (>7.5). Consequently, sub-watersheds nos. 3, 4, 5, 7, 8, and 9 (46% of the total) are classified as low priority category, and sub-basins nos. 1, 2, and 6 (23% of the total) are categorized under moderate priority category, whereas sub-watersheds nos. 10, 11, 12, and 13 (31% of the total) are ranked under high priority category (Figure 9).
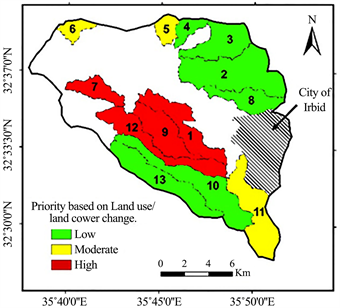
Figure 9. Priority of sub-watersheds based on land use/ land cover analysis.
Table 6. Land use/land cover change in Wadi Alarab sub-basins by area (1987-2017).
Table 7. Priority based on land use/land cover change (%) in Wadi Alarab sub-basins (1987-2017).
4.5. Integration of the Three Criteria and Priority Categories
The three priority overlays performed based on morphometric analysis, soil loss modeling, and land use/cover change analysis, were integrated using the geo-processing tool. Thus, it was possible to overlay the three derived raster layers/data, then multiplying each of them by a given appropriate weight, and summing up together scores to generate the final multi-criteria priority map. Based on the integration of the three criteria analysis, and the final ranking of Cp values (Table 8), the 13 sub-watersheds were then classified into: low priority (>7.0), moderate priority (5.1 - 6.9), and high priority (<5.0). Results showed that sub-basins nos. 1, 5, 8, 9, 10, and 11 (46% of the total) are ranked under low priority category (Figure 10). Moreover, three sub-watersheds nos. 4, 12, and 13 (23% of the total) are classified under moderate priority category. By contrast, four sub-basins nos. 2, 3, 6, and 7 (31% of the total) are ranked under the category of high priority.
The generated priority map shows critical sub-watersheds which experience high soil erosion risk. Based on morphometric analysis, the average soil loss rate for high priority sub-watersheds (1, 5, 7, and 8) is estimated at 26.8 ton·ha−1·yr−1; whereas for a very high category sub-watersheds (2, 3, 4, 6, and 9), the average soil loss rate is estimated at 25.6 ton·ha−1·yr−1. With reference to LULC change analysis, the sub-watersheds assigned to high priority (10, 11, 12, and 13), yield an average soil loss rate at 18.8 ton·ha−1·yr−1. High (2, 5, 8, and 12), very high (3 and 4), and severe priority sub-watersheds (6, and 7) were identified based on soil loss modeling; they furnish an average soil loss rate estimated at 25.9, 28.6, and
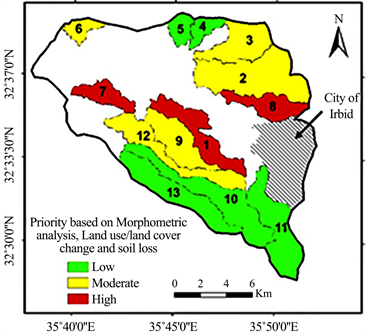
Figure 10. Priority of sub-watersheds based on morphometric analysis, Soil loss modeling, and land use/cover change.
Table 8. Priority sub-basins based on morphometric analysis, land use/land cover change analysis, and soil loss modeling.
57.6 ton·ha−1·yr−1 respectively. Furthermore, it is worth noting that sub-watersheds nos. 6, and 7, which are classified under high, very high, and severe priority; based on morphometric analysis and soil loss modeling, they have experienced the highest soil loss rate with an average estimated at 57.6 ton·ha−1·yr−1. However, the three priority categories derived based on the integration of the criteria showed consistent results in terms of soil erosion loss rates. Sub-watersheds of the low priority group afford an average annual soil loss rate at 20.35 ton·ha−1·yr−1. The average annual soil loss of the moderate priority group is computed at 23 ton·ha−1·yr−1. The average annual soil loss rate for the high priority group sub-basins is 43.2 ton·ha−1·yr−1. It is obvious that the average annual soil loss for the high priority sub-watersheds recognized based on LULC change analysis is relatively smaller than the annual average soil loss rate identified with reference to morphometric analysis and soil loss modeling based on the RUSLE. Although the vegetation cover is relatively degraded over the catchment, it appears that the major decisive factors in accelerating soil erosion are the combination of watershed morphology (slope and relief), and geomorphic rejuvenation, and slope instability, rather than anthropogenic intervention, land use/cover abuse, and historical exploitation of land resources. All these sub-basins are considered part of the rejuvenated belt characterizing the Rift catchments. It is evident that 84.6% of the total sub-watersheds connected to W. Alarab watershed are under a serious soil erosion threat. Consequently, it is recommended that these sub-watersheds should be assigned top priority based on the interaction of the three criteria, including soil loss estimation discussed earlier. However, the present results make it possible to identify critical sub-watersheds, or “hotspots” prone to serious soil erosion risk, and this must be addressed for implementing soil and water conservation measures to control soil erosion.
4.6. Validation of the Three Criteria Priority Groups
To confirm the priority classes connected to the 13 sub-watersheds, statistical testing using Discriminant Analysis was carried out to test the hypothesis that there are significant differences between the three priority groups achieved based on the integration of the three criteria analysis. And then, if this hypothesis is substantiated, to establish a system of a coordinate axes which discriminates between the recognized three priority groups (Figure 11). The analysis shows that 100% of the original grouped sub-watersheds (cases) are correctly classified, and 85% of cross validated grouped sub-watersheds are correctly classified. It is also verified that there is a significant difference between the priority classes (low, medium, and high priority). Statistical testing was conducted on data representing the three priority groups, with the associated ranking values related to morphometric analysis, LULC change, and soil loss modeling including the Cp scores. The F test of Wilks lambda obtained is F ratio 5. 517 with the degree of freedom V1 = 2 and V2 = 10. Referring to the table of percentage points of the F-distribution, with V1 = 2 and V2 = 10, it is found that at 95 percent of confidence, the tabulated value is 4.10, which is significantly exceeded by the computed F ratio (5. 517). Subsequently, there is a remarkable significant difference between each of the priority classes, and the three priority groups are distinct and completely separated. Furthermore, 100 percent of the difference between the three priority groups is attributed to Discriminant function 1 (96.8 percent) and Discriminant function 2 (3.2 percent). It was also revealed that Discriminant function 1 is positively correlated with the three criteria of analysis (morphometric, LULC, and soil loss parameters), where the canonical correlation is 0.958.
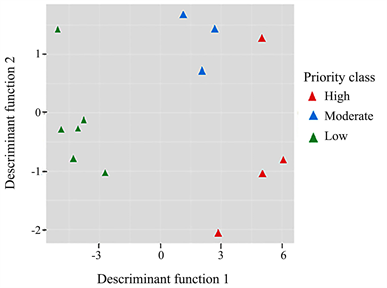
Figure 11. The scores of the 13 sub-watersheds connected to each priority class on the two discriminant functions 1 & 2.
By contrast, Discriminant function 2 is also positively correlated with the criteria of analysis, but with a moderate correlation value (0.523). The scores of each sub-watershed of the three priority groups on Discriminant function 1 and 2 were plotted in Figure 11. The plot shows highly distinct priority groups that are completely separated. Referring to the present results, it can be concluded that prioritization based on morphometric analysis, LULC, and soil loss modeling is proved to be statistically valid and consistent, and of high capacity using GIS tools. The potential of the criteria of analysis are strongly recommended for prioritization research.
5. Conclusions
Rainfed cultivation over the northern highlands is critically threatened due to soil erosion by water. High soil erosion rates increase the sediment load into the Wadi Alarab dam due to frequent heavy rainstorms. Therefore, all sub-watersheds classified under high, very high, and severe priority reveal a significant degree of erosion risk connected to particular sub-watersheds. Using geospatial tools, it was possible to extract three priority maps representing the three approaches employed in the analysis. Based on morphometric analysis, three sub-basins are ranked under low priority; two sub-watersheds are grouped under moderate priority, four sub-watersheds are classified under high priority, and five sub-basins are fall under very high priority. With reference to LULC change analysis; six sub-watersheds are categorized under low priority, while three sub-basins are classified under moderate priority. By contrast, four sub-watersheds are categorized under high priority. Based on soil loss modeling, three sub-basins are categorized as of low priority, and two sub-basins fall under moderate priority. Four sub-watersheds are ranked under high priority, and two sub-basins are classified under very high priority, whereas two sub-watersheds fall under severe priority.
Integrating the three layers in a GIS environment, the final priority map shows critical sub-watersheds which experience high soil erosion risk, where 84.6% of the total sub-watersheds pertaining to Wadi Alarab catchment are under a serious soil erosion threat. Although the vegetation cover is relatively degraded over the watershed, it appears that the major decisive factors in accelerating soil erosion, are the combination of watershed morphology (slope and relief), geomorphic rejuvenation, and slope instability; rather than anthropogenic factors (i.e., land use/cover and historical exploitation of land resources). The validity of the prioritization of the 13 sub-basins was tested using Discriminant Analysis (DA). It is evident that there is a significant difference between the priority groups (low, moderate, and high), and the three priority classes are completely separated, statistically valid, and consistent. Thus, the adoption of GIS, remote sensing, morphometric analysis, LULC change analysis, soil loss rates confirm the efficiency of this approach in prioritizing W. Alarab sub-watersheds. The current results are expected to help decision-makers in identifying priority sub-watersheds which need immediate adoption of proper conservation measures.
Acknowledgements
The authors are thankful to anonymous reviewers for their constructive comments which improve the manuscript. Thanks also extended to the staff of the University of Yarmuk for their support of this research, and to Dr. Bill Templer for editing the language of the original manuscript.
Conflicts of Interest
The authors declare no conflicts of interest regarding the publication of this paper.
Cite this paper
Farhan, Y. and Nawaieh, S. (2019) Prioritization of W. Alarab Sub-Watersheds (North Jordan) for Conservation Measures Using RS, GIS, and Multi-Criteria Analysis. Journal of Water Resource and Protection, 11, 995-1023. https://doi.org/10.4236/jwarp.2019.118059
References
- 1. Farhan, Y. and Nawaish, S. (2015) Spatial Assessment of Soil Erosion Risk Using RUSLE and GIS Techniques. Environmental Earth Sciences, 74, 4646-4669. https://doi.org/10.1007/s12665-015-4430-7
- 2. Christopherson, G. and Guertin, D. (1995) Soil Erosion, Agricultural Intensification, and Iron Age Settlement in the Region of Tall el Umeiri. Unpublished Paper Presented at the Annual Meeting of the American Schools of Oriental Research, Philadelphia.
- 3. Cordova, C.E. (2000) Geomorphological Evidence of Intense Prehistoric Soil Erosion in the Highlands of Central Jordan. Physical Geography, 21, 538-567. https://doi.org/10.1080/02723646.2000.10642725
- 4. Farhan, Y., Zreqat, D. and Farhan, I. (2013) Spatial Estimation of Soil Erosion Risk Using RUSLE Approach, RS and GIS Techniques: A Case Study of Kufranja Watershed, Northern Jordan. Journal of Water Resources and Protection, 5, 1247-1261. https://doi.org/10.4236/jwarp.2013.512134
- 5. Irvem, A., Topaloglu, F. and Uygur, V. (2007) Estimating Spatial Distribution of Soil Loss over Seyhan River Basin in Turkey. Journal of Hydrology, 336, 30-37. https://doi.org/10.1016/j.jhydrol.2006.12.009
- 6. Nearing, M.A., Ascough, L.D. and Laften, J.M. (1990) Sensitivity Analysis of the WEPP Hillslope Profile Erosion Model. Transaction of the ASAE, 33, 839-849. https://doi.org/10.13031/2013.31409
- 7. Kouli, M., Vallianatos, F., Soupios, P. and Alexakis, D. (2009) GIS-Based Morphometric Analysis of Two Major Watersheds, Western Crete, Greece. Journal of Environmental Hydrology, 15, 1-17.
- 8. Alkharabsheh, M., Alexandridis, K., Bilas, G., Misopolinos, N. and Silleos, N. (2013) Impact of Land Cover Change on Soil Erosion Hazard in Northern Jordan Using Remote Sensing and GIS. Procedia Environmental Sciences, 19, 912-921. https://doi.org/10.1016/j.proenv.2013.06.101
- 9. Farhan, Y. (1986) Landslides in Central Jordan with Special Reference to the March 1983 Rainstorm. Singapore Journal of Tropical Geography, 7, 80-97. https://doi.org/10.1111/j.1467-9493.1986.tb00174.x
- 10. Farhan, Y. (1999) Geomorphic Impacts of Highway Construction, Their Causes and Remedies: A Case Study from Aqaba, Southern Jordan. The Arab World Geographer, 2, 1-25.
- 11. Beaumont, P. and Atkinson, K. (1969) Soil Erosion and Conservation in Northern Jordan. Journal of Soil and Water Conservation, 24, 144-147.
- 12. Atkinson, K., Beaumont, P., Bowen-Jones, H., Fisher, W.B. and Gilchrist-Shirlaw, D.W. (1967) Soil Conservation Survey of Wadi Shueib and Wadi Kufrein, Jordan. Unpublished Report, Department of Geography, University of Durham, Durham.
- 13. Willimott, S.G., Gilchrisy-Shirlaw, D.W., Smith, R.A. and Birch, B.P. (1963) The Wadi Hasa Survey, Jordan. Unpublished Report, Department of Geography, University of Durham, Durham.
- 14. Al-Sheriadeh, M., Malkawi, A., Al-Hamdan, H. and Abdulrahman, N. (2000) Evaluating Sediment Yield at King Talal Reservoir from Landslides along Irbid-Amman Highway. Engineering Geology, 56, 361-372. https://doi.org/10.1016/S0013-7952(99)00119-2
- 15. Ijam, A. and Al-Mahamid, M. (2012) Predicting Sedimentation at Mujib Dam Reservoir in Jordan. Jordan Journal of Civil Engineering, 6, 448-463.
- 16. Ijam, A. and Tarawneh, E. (2012) Assessing of Sediment Yield for Wala Dam Catchment Area in Jordan. European Water, 38, 43-58.
- 17. Al-Ansari, N. and Knutsson, S. (2012) Reduction of the Storage Capacity of Two Small Reservoirs in Jordan. Journal of Earth Science and Geotechnical Engineering, 2, 17-37.
- 18. Dabbas, I. (1994) Soil Erosion Measurement in the Salt Area, Jordan. M.A. Thesis, University of Jordan, Amman. (In Arabic)
- 19. Beni Taha, Q. (2004) Soil Erosion in Jerash Area. M.A. Thesis, University of Jordan, Amman. (In Arabic)
- 20. Jawabreh, A. (1995) Soil Erosion Measurements in the Muwaqqar Area, Jordan. M.A. Thesis, University of Jordan, Amman. (In Arabic)
- 21. AL-Shabatat, A. (2005) Environmental Deterioration and Land Management in the Petra—Showbak Area, Jordan. Ph.D. Thesis, University of Jordan, Amman. (In Arabic)
- 22. Al-Hamdan, A. (1996) Soil Erosion Measurements in the Azraq Area, Jordan. M.A. Thesis, University of Jordan, Amman. (In Arabic)
- 23. Farhan, Y., Anbar, A., Al-Shaikh, N. and Mousa, R. (2017) Prioritization of Semi-Arid Agricultural Watershed Using Morphometric and Principal Component Analysis, Remote Sensing, and GIS Techniques, the Zerqa River Watershed, Northern Jordan. Agricultural Sciences, 8, 113-148. https://doi.org/10.4236/as.2017.81009
- 24. Arabameri, A., Pradhan, B., Poughasemi, H.R. and Rezaei, K. (2018) Identification of Erosion-Prone Areas Using Different Multi-Criteria Decision-Making. Techniques and GIS. Geomatics, Natural Hazards and Risk, 9, 1129-1155. https://doi.org/10.1080/19475705.2018.1513084
- 25. Gajbhiye, S.M., Mishra, S.K. and Pandy, A. (2014) Prioritizing Erosion-Prone Area through Morphometric Analysis: An RS and GIS Perspective. Applied Water Science, 4, 51-61. https://doi.org/10.1007/s13201-013-0129-7
- 26. Makwana, J. and Tiwari, M.K. (2016) Prioritization of Agricultural Sub-Watersheds in Semi Arid Middle Region of Gujarat Using Remote Sensing and GIS. Environmental Earth Sciences, 75, 137-159. https://doi.org/10.1007/s12665-015-4935-0
- 27. Altaf, F., Meraj, G. and Romshoo, S.A. (2013) Morphometric Analysis to Infer Hydrological Behavior of Lidder Watershed, Western Himalaya, India. Geography Journal, 2013, 178021. https://doi.org/10.1155/2013/178021
- 28. Iqbal, M. and Sajjad, H. (2014) Watershed Prioritization Using Morphometric and Land Use/Land Cover Parameters of Dudhganga Catchment Kashmir Valley India Using Spatial Technology. Journal of Remote Sensing & GIS, 3, 1000115.
- 29. Biswas, S., Sudhakar, S. and Disai, V.R. (1999) Prioritization of Sub-Watersheds Based on Morphometric Analysis of Drainage Basin: A Remote Sensing and GIS Approach. Journal of the Indian Society of Remote Sensing, 27,155-166. https://doi.org/10.1007/BF02991569
- 30. Ratnam, K.N., Srivastava, Y.K., Rao, V.V., Amminedu, E. and Murthy, K.S.R. (2005) Check Dam Positioning by Prioritization of Micro-Watersheds Using SYI Model and Morphometric Analysis-Remote Sensing and GIS Perspective. Journal of the Indian Society of Remote Sensing, 33, 25-38. https://doi.org/10.1007/BF02989988
- 31. Thakkar, A.K. and Dhiman, S.D. (2007) Morphometric Analysis and Prioritization of Mini Watersheds in Mohr Watershed, Gujarat Using Remote Sensing and GIS Techniques. Journal of the Indian Society of Remote Sensing, 35, 313-321. https://doi.org/10.1007/BF02990787
- 32. Javed, A., Khanday, M.Y. and Ahmad, R. (2009) Prioritization of Sub-Watersheds Based on Morphometric and Land Use Analysis Using Remote Sensing and GIS Techniques. Journal of the Indian Society of Remote Sensing, 37, 261-274. https://doi.org/10.1007/s12524-009-0016-8
- 33. Javed, A., Khanday, M. and Rias, S. (2011) Watershed Prioritization Using Morphometric and Land Use/Land Cover Parameters: A Remote Sensing and GIS Approach. Journal of the Geological Society of India, 79, 63-75. https://doi.org/10.1007/s12594-011-0068-6
- 34. Khanday, M.Y. and Javed, A. (2016) Prioritization of Watersheds for Conservation Measures in a Semi Arid Watershed Using Remote Sensing and GIS. Journal of the Geological Society of India, 88, 185-196. https://doi.org/10.1007/s12594-016-0477-7
- 35. Gajbhiye, S., Sharma, S.K. and Tignuth, S. (2015) Development of a Geomorphological Erosion Index for Shakkar Watershed. Journal of the Geological Society of India, 86, 361-370. https://doi.org/10.1007/s12594-015-0323-3
- 36. Renard, K.G., Foster, G.R., Weesies, G.A., McCool, D.L. and Yoder, D.C. (1997) Predicting Soil Erosion by Water: A Guide to Conversation Planning with the Revised Universal Soil Loss Equation (RUSLE). Agricultural Handbook No. 703, USAD-ARS, Washington.
- 37. Eltaif, N., Gharaibeh, M., Al-Zaitawi, F. and Alhamad, M.N. (2010) Approximation of Rainfall Erosivity Factor in Northern Jordan. Pedosphere, 20, 711-717. https://doi.org/10.1016/S1002-0160(10)60061-6
- 38. Kraushaar, S. (2016) Soil Erosion and Sediment Flux in Northern Jordan, Springer Theses. https://doi.org/10.1007/978-3-319-31888-2
- 39. Quennell, A. (1958) The Structure and Geomorphic Evolution of the Dead Sea Rift. Quarterly Journal of the Geological Society, 114, 1-24. https://doi.org/10.1144/gsjgs.114.1.0001
- 40. Farhan, Y., Anbar, A., Enaba, O. and Al-Shaikh, N. (2015) Quantitative Analysis of Geomorphometric Parameters of Wadi Kerak, Jordan, Using Remote Sensing and GIS. Journal of Water Resources and Protection, 7, 456-475. https://doi.org/10.4236/jwarp.2015.76037
- 41. Farhan, Y., Elgaziri, A., Elmaji, I. and Ali, I. (2016) Hypsometric Analysis of Wadi Mujib-Wala Watershed (Southern Jordan) Using Remote Sensing and GIS Techniques. International Journal of Geosciences, 7, 158-176. https://doi.org/10.4236/ijg.2016.72013
- 42. Moh’d, B.K. (2000) The Geology of Irbid and Ash Shuna Ash Shamaliyya (WAQQAS): Map Sheets No. 3154-II and 3154-III. Geological Directorate, Geological Mapping Division, Amman.
- 43. Ministry of Agriculture, Jordan. (1995) The Soil of Jordan. Report of the National Soil Map and Land Use Project, Ministry of Agriculture, Hunting Technical Service LTD and European Commission, Amman.
- 44. Department of Statistics (2016) Population Estimation Reports, Amman, Jordan.
- 45. Horton, R. (1945) Erosional Development of Streams and Their Drainage Basins: Hydrological Approach to Quantitative Morphology. Geological Society of America Bulletin, 56, 275-370. https://doi.org/10.1130/0016-7606(1945)56[275:EDOSAT]2.0.CO;2
- 46. Strahler, A. (1957) Quantitative Analysis of Watershed Geomorphology. Transactions of the American Geophysical Union, 38, 913-920. https://doi.org/10.1029/TR038i006p00913
- 47. Strahler, A. (1964) Quantitative Geomorphology of Drainage Basins and Channel Network. In: Chow, V.T., Ed., Handbook of Applied Hydrology, McGraw Hill, New York, 439-476.
- 48. Al-Saady, Y., Al-Suhail, Q., Al-Tawash, B. and Othman, A. (2016) Drainage Network Extraction and Morphometric Analysis Using Remote Sensing and GIS Mapping Techniques (Lesser Zab River Basin, Iraq and Iran). Environmental Earth Sciences, 75, 1243. https://doi.org/10.1007/s12665-016-6038-y
- 49. Kanth, T. and Hassan, Z. (2012) Morphometric Analysis and Prioritization of Watersheds for Soil and Water Resources Management in Water Catchment Using Geospatial Tools. International Journal of Geology, Earth, and Environmental Sciences, 2, 30-41.
- 50. Strahler, A. (1952) Dynamic Basis of Geomorphology. Geological Society of America Bulletin, 63, 923-938. https://doi.org/10.1130/0016-7606(1952)63[923:DBOG]2.0.CO;2
- 51. Strahler, A. (1958) Dimensional Analysis Applied to Fluvially Eroded Landforms. Geological Society of America Bulletin, 69, 279-300. https://doi.org/10.1130/0016-7606(1958)69[279:DAATFE]2.0.CO;2
- 52. Prasad, R.K., Mondal, N.C., Banerjee, P., Nandakumar, N.V. and Singh, V.S. (2008) Deciphering Potential Groundwater Zone in Hard Rock Through the Application of GIS. Environmental Geology, 55, 467-475. https://doi.org/10.1007/s00254-007-0992-3
- 53. Sreedevi, P., Sreekanth, P., Khan, H. and Ahmed, S. (2013) Drainage Morphometry and Its Influence on Hydrology in a Semi Arid Region: Using SRTM Data and GIS. Environmental Earth Sciences, 70, 839-848. https://doi.org/10.1007/s12665-012-2172-3
- 54. Tucker, G.E. and Bras, R.L. (1998) Hillslope Processes, Drainage Density, and Landscape Morphology. Water Resources Research, 34, 2751-2764. https://doi.org/10.1029/98WR01474
- 55. Gravelius, H. (1914) Grundriß der Gesamten Gewässerkunde, Band 1: Flußkunde. Compendium of Hydrology, I, 265-278.
- 56. Zavoianu, I. (1985) Morphometry of Drainage Basins (Developments in Water Science). Elsevier, Amsterdam.
- 57. Miller, V. (1953) A Quantitative Geomorphic Study of Drainage Basin Characteristics in the Clinch Mountain Area, Virginia and Tennessee. Project NR 389-402, Technical Report 3, Columbia University, Department of Geology, ONR, New York.
- 58. Anderson, J., Hardy, E., Roach, J. and Witmer, R. (1976) A Land Use and Land Cover Classification System for Use with Remote Sensor Data. US Geological Survey Professional Paper 964, Washington DC. https://doi.org/10.3133/pp964
- 59. Chandniha, S.L.K. and Kansal, M.L. (2017) Prioritization of Sub-Watersheds Based on Morphometric Analysis Using Geospatial Technology in Piperiya Watershed, India. Applied Water Science, 7, 329-338. https://doi.org/10.1007/s13201-014-0248-9
- 60. Wischmeier, W.H. and Smith, D.D. (1978) Predicting Rainfall Erosion Losses: A Guide to Conservation Planning. USDA Handbook 537, Washington DC.
- 61. Millward, A. and Mersey, J.E. (1999) Adapting the RUSLE to Model Soil Erosion Potential in a Mountainous Tropical Watershed. Catena, 38, 109-129. https://doi.org/10.1016/S0341-8162(99)00067-3
- 62. Angima, S.D., STOTT, D.E., O’Neill, M.K., Ong, C.K. and Weesies, G.A. (2003) Soil Erosion Prediction Using RUSLE for Central Kenyan Highland Conditions. Agriculture, Ecosystem, & Environment, 97, 295-308. https://doi.org/10.1016/S0167-8809(03)00011-2
- 63. Mather, P. and Doornkamp, J.C. (1970) Multivariate Analysis in Geography with Particular Reference to Drainage-Basin Morphometry. Transactions of the Institute of British Geographers, 51, 163-187. https://doi.org/10.2307/621768
- 64. Davis, J.C. (1973) Statistics and Data Analysis in Geology. Wiley, New York.
- 65. Mather, P.M. (1986) Computational Methods and Multivariate Analysis in Physical Geography. Wiley, London.
- 66. Chorley, R., Donald, M. and Pogorzelski, H. (1957) A New Standard for Estimating Drainage Basin Shape. American Journal of Science, 255, 138-141. https://doi.org/10.2475/ajs.255.2.138
- 67. Angillieri, M.Y.E. and Fernandez, O.M. (2017) Morphometric Analysis of River Uasins Using GIS and Remote Sensing of an Andean Sections of Route 150, Argentina. A Comparison Between Manual and Automated Delineation of Basins. Revista Mexicana de Ciencias Geológicas, 34, 150-156. https://doi.org/10.22201/cgeo.20072902e.2017.2.482
- 68. Patel, D.P., Gajjar, C.A. and Srivastava, P.K. (2013) Prioritization of Malesari Mini-Watersheds through Morphometric Analysis: A Remote Sensing and GIS Perspective. Environmental Earth Sciences, 69, 2643-2656. https://doi.org/10.1007/s12665-012-2086-0
- 69. Gajbhiye, S.M. and Sharma, S.K. (2015) Prioritization of Watersheds through Morphometric Parameters: A PCA-Based Approach. Applied Water Science, 7, 1505-1519. https://doi.org/10.1007/s13201-015-0332-9