Journal of Water Resource and Protection
Vol.11 No.01(2019), Article ID:89899,15 pages
10.4236/jwarp.2019.111004
Analytical Errors in the Determination of Inorganic and Organic Phosphorus in Waters Based on Laboratory Experiences
Jinbo Zhao1,2, Mengyuan Liu2, Ming Chen2
1State Key Laboratory of Water Environment Simulation, Beijing, China
2School of Environment, Beijing Normal University, Beijing, China

Copyright © 2019 by author(s) and Scientific Research Publishing Inc.
This work is licensed under the Creative Commons Attribution International License (CC BY 4.0).
http://creativecommons.org/licenses/by/4.0/


Received: June 19, 2018; Accepted: January 12, 2019; Published: January 15, 2019
ABSTRACT
Phosphorus has been closely associated with eutrophication, a growing ecological problem globally. Because bacterial and algae responds to organic and inorganic nutrients differently, developing an accurate analytical method for the determination of dissolved inorganic phosphorus (DIP) and dissolved organic phosphorus (DOP) is critical for understanding eutrophication. This paper describes analytical variations observed in laboratory experiments for the determination of DIP and DOP. Several experimental parameters including phosphorus reagents’ temperature, water sample matrix, pH, and autoclave methods are investigated. With the optimization of the autoclave procedure, the recoveries of 8 model organic phosphorus compounds (i.e. adenosine-5-triphosphate di-sodium salt (ATP), phytic acid (PTA), sodium tripolyphosphate (STP), methyltriphenylphosphonium bromide (MPT), p-nitrophenyl phosphate magnesium salt (p-NPP), β-D-glucose-6-phosphate monosodium salt (G-6-P) and cocarboxylase (COCA)) are all well above 90% indicating significant analytical method improvement.
Keywords:
Inorganic Phosphorus, Organic Phosphorus, Analytical Method

1. Introduction
Eutrophication is a growing problem globally and has been resulting in significant ecological and socio-economic consequences [1] [2] [3]. The addition of excess P to natural waters is one of the world’s most serious environmental problems because of its contribution to the eutrophication process. Non-point pollution such as fertilizer runs off from farmland posts potential risk to threat the surface water quality in China.
Understanding the root cause of eutrophication requires knowledge of nutrient biogeochemistry in aquatic systems. Because bacterial and algae responds to organic and inorganic nutrients differently, development of rapid and relatively selective methods for the detection of dissolved organic phosphorus (DOP) and dissolved inorganic phosphorus (DIP) is important [4] [5]. Lack of suitable analytical methods for determination of DOP is one of major reasons for limited knowledge on bacteria and algae response to DOP [4] [6] [7]. This paper studied potential analytical variations (e.g. sample preparation, autoclave procedure etc.) to optimize the analytical method for determination of DIP and DOP species in water samples.
2. Materials and Methods
2.1. Chemicals
Potassium dihydrogen orthophosphate (chemical company and purity information should be listed here) was used to for making stock solutions. The six organic P model compounds used to optimize the autoclave digestion method are adenosine-5-triphosphate di-sodium salt (ATP), phytic acid (PTA), sodium tripolyphosphate (STP), methyltriphenylphosphonium bromide (MPT), p-nitrophenyl phosphate magnesium salt (p-NPP), β-D-glucose-6-phosphate monosodium salt (G-6-P), and cocarboxylase (COCA). These compounds were purchased from Sigma or Sigma Aldrich without further purification (see details for purity of each compound in Figure 1). These model compounds represent a refractory P-O-P compounds, refractory C-O-P compound, a labile C-O-P compound and a C-P compound, two C-O-P compounds and a P-O-P compound, respectively.
2.2. Sample Digestion Procedure
The determination of organic phosphorus in natural waters requires digestion or oxidation to convert particulate, organic and condensed species to phosphate [8] [9] [10]. Many of the phosphorus species present in natural waters contains bonds that need to be broken to release measurable P species. For example, P-O-P, C-O-P and C-P bonds need to be broken down to release phosphorus as phosphate, which can then be determined using phosphomolybdenum blue chemistry method. The digestion technique also need to be able to release phosphorus from biological material including algal cells and plant detritus, and from species adsorbed or occluded onto particulate matter [7]. Common sample digestion techniques include microwave digestion, autoclave, UV photo-oxidation, conventional heating (using hot-plate, sand bath or aluminium blocks), and dry ashing. In several studies, sample digestions are also in combination with a range of oxidative techniques such as perchloric acid, sulphuric acid-nitric acid, acid persulphate and alkaline persulphate [11] [12].
In this study, the autoclave method is performed as following: each water sample of approximately 20 mL were placed in individual glass autoclave bottle

Figure 1. Chemical information of the organic model compounds used in optimization of the autoclave digestion.
of 100 mL following with addition of 0.2 g potassium peroxydisulphate (K2S2O8) and 1 mL of 0.5 M sulphuric acid. Screw top plastic lids with foil seals were hand tightened and then released by half a turn. The samples were then sonicated at room temperature for 15 min to dissolve the added K2S2O8. Each sample was autoclaved for 30 min at 121˚C and then left for 2 h to cool down.
2.3. Determination of Phosphorus
To prepare the phosphate standards, 0.4394 g potassium dihydrogen orthophosphate was dried at 105˚C for 2 h, and then dissolved in 100 mL ultra-high purity (UHP) water to give a 1 g∙P∙L−1 stock solution. The working standards (0 - 100 µg∙P∙L−1) were then prepared by a serial dilution of the stock solution with UHP water. Two analytical method quality control (QC) samples were prepared at the same time (QC0: 5 µg∙P∙L−1; QC1: 50 µg∙P∙L−1). Standards for total (inorganic + organic) P determination were prepared following the same procedure and were autoclaved with the samples in one batch, see Figure 2.
Phosphate concentrations were determined using a segmented flow analyser (SEAL AA3). The programming and operation of the analyser were carried out using the Automated Analyzer Control and Evaluation software (AACE software). Basically, sample reacts with molybdate under acidic conditions (pH < 2) to form phosphomolybdic acid [7] ; the formed heteropolyacid is then reduced by ascorbic acid to produce a blue complex that can be detected at 660 nm using a spectrophotometer. Seven samples were injected in triplicate per hour as set up using the AA3, the injection time being 60 s and the wash time 120 s.
3. Results and Discussion
3.1. Determination of Dissolved Inorganic Phosphorus (DIP)
3.1.1. Effect of Temperature
Temperature is one of the most important factors that can affect the inorganic phosphorus analytical method because it affects the reaction sensitivity and hence the calibration gradient. Several studies have reported a rate increase of the formation of the molybdenum blue complex with increasing temperature [8] [9] [10] [11]. Two reagents are needed in the phosphomolybdenum blue method to measure DIP: the ammonium molybdate solution and the reducing agent

Figure 2. Typical standards and samples from recorder output.
(ascorbic acid or tin (II) chloride). Both reagents are very sensitive to light and temperature. Therefore, the reagents should be stored at 4˚C when not in use. It is also important that the reagent solutions are equilibrated to room temperature prior to use.
Figure 3 shows instrument baseline when using cold reagents stored at 4˚C and equilibrated at 25˚C, respectively. The baseline increased from 2434 at 4˚C to 2572 as the reagents being warmed up to 25˚C. The baseline difference between 4˚C and 25˚C was 138, which is roughly equivalent to a 15 µg∙L−1 P concentration difference. Clearly, the regent temperature is one of many errors that could occur in the analytical method, which can be avoided by equilibrating the reagents at room temperature for approximately 2 h prior to use.
3.1.2. Interferences of Other Inorganic Ions for DIP Measurement
The phosphomolybdenum blue method is subject to potential interference from certain matrix ions, e.g., fluoride, nitrate, silicate, arsenate and trace metals (Fe (III), Al (III), Mg (II)). These interferences are more severe in polluted waters and wastewater samples. For example, fluoride slows down the development of the phosphomolybdenum blue complex, but does not affect the maximum absorbance reached at steady state [11]. Nitrate only interferes at very high concentrations (>10 mg∙L−1) [13]. Chromium (III) only interferes with this method when the Chromium (III) concentration above 1 mg∙L−1 [14], which is only found in polluted waters or waste water samples. Silicate can have a major interference effect by reacting with ammonium molybdate to form molybdosilicic acid.
Arsenic and phosphorus are both group V elements, therefore arsenate ( ) and phosphate ( ) are chemically similar. It has been shown that arsenate can positively interfere in the determination of inorganic phosphate
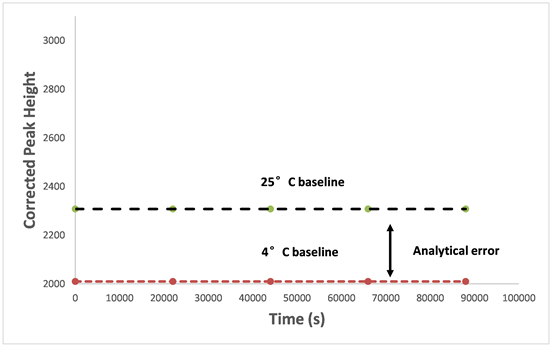
Figure 3. The comparison of segmented flow analyser response baseline under reagent temperatures at 4˚C and 25˚C.
[15] [16] [17] [18]. Arsenic exists in different forms in the environment depending on the pH values. Under strong acidic conditions, it exists in the As(III) oxidation state as arsenate (H3AsO4). Under weak acidic conditions, arsenic ion exists as the dihydrogen arsenate ion . However, under weak basic conditions, the hydrogen arsenate ion is formed, while under strong basic conditions the arsenate ion is predominant [19]. Previous study showed that under typical pH and Eh conditions for the River Tamar (pH = 6.1 - 8.2; Eh > 600 mV) [20] [21], arsenate ( / ) was a major component of the total arsenic concentration, which is typically ranged from 2 to 16 µg∙As∙L−1, but can be as high as 40 As∙µg∙L−1 due to the impact of historical arsenic mining [16].
In this study, the impact of arsenate on P measurement under different temperature conditions (i.e. 30˚C, 40˚C, and 50˚C) was investigated. An ANOVA test (p = 0.876) showed that there was no significant difference in P concentration determined between the P standards and the standards spiked with As up to 0.10 mg∙As∙L−1 at 30˚C, 40˚C, and 50˚C. This result demonstrated that P determinations using the segmented flow analyser are insensitive to arsenate concentrations up to 0.10 mg As∙L−1 at temperatures up to 50˚C.
At higher arsenate concentrations, the significant impact on P measurement was observed. Figure 4 shows the experimental results with the addition of 1 mg∙As∙L−1 to P standards (as phosphate) suggesting a significant interference of As and this interference effect was increased with higher temperatures. An increase of temperature from 30˚C to 50˚C had no effect on the non-spiked P standards as the slopes remained same. However, the slopes for the arsenate spiked P standards were significantly different under different temperatures. Figure 5 also shows that the instrument is more sensitive to arsenate at higher temperatures (50˚C). At a lower temperature (30˚C) arsenate concentrations ranged from 0 to 1 mg∙As∙L−1 demonstrated a much less interference, equivalent to 0.002 - 0.004 mg∙P∙L−1. Based on this study, 30˚C is the optimum temperature for minimising the arsenate interference. Consequently, it is important to understand the arsenate concentration in samples before the P is determined, particularly for samples from impacted catchments. If the arsenate concentration is larger than 0.10 mg∙As∙L−1, sample pre-treatment is required [22].
3.2. Determination of Dissolved Organic Phosphorus (DOP)
3.2.1. Optimisation of the Autoclave Method
The molybdenum blue method only measures the concentration of molybdate-reactive phosphorus species in water samples, which are predominantly orthophosphate species but also include some condensed IP species and labile organic phosphorus species. There is no established method that can directly measure DOP. Determination of DOP and TDP are generally based on the conversion of all P species to orthophosphate. This is carried out by the hydrolysis and oxidation of molecules containing essentially P-O-P, C-O-P and C-P (see Figure 1 for examples) bonds [23]. In natural waters, DOP includes nucleic

Figure 4. Effect of 1 mg∙As∙L−1 on the P response at 30˚C, 40˚C and 50˚C.

Figure 5. Effect of arsenic concentration on the P blank at 30˚C, 40˚C and 50˚C.
acids, phospholipids, inositol phosphates, phosphoamides, phosphonic acids, organophosphate pesticides, humic associated organic phosphorus compounds [24] and organic condensed phosphates in dissolved, colloidal and particle-associated forms [25].
An acid peroxydisulphate method was developed by Espinosa et al. [33] and an autoclave digestion protocol has been reported by Haygarth et al. [26]. Ridal and Moore [27] suggested that adjustment of the peroxydisulphate concentration is the most important parameter for improving recoveries. The USEPA Persulfate Digestion Method 365.1 uses a lower mass of peroxydisulphate (0.2 g per 20 mL sample) [28]. In this study, several parameters in the autoclave digestion were investigated including pH values of test samples and oxidizing reagent concentration.
1) Peroxydisulphate concentration
Figure 6 shows the measured P concentration in the blank and different oxidizing reagents with and without autoclave process. DOP signal can be observed even without autoclave procedure. For example, a signal equivalent to 3.7 µg∙P∙L−1 was observed with 0.8 g K2S2O8. Approximately 4.7 µg∙P∙L−1 was observed with the addition of both K2S2O8 and sulphuric acid. This result suggested that approximately 80% of the signal came from the K2S2O8 and 20% from the sulphuric acid. Clearly, the high blank signal could largely come from the oxidizing reagent. According to the USEPA Method 365.1 and the results observed in current study, the amount of K2S2O8 was reduced from 0.8 to 0.2 g.
The recoveries of all 8 organic P compounds were > 95% (n = 9) using this method (0.2 g peroxydisulphate), and the limit of detection (LOD) was 5 µg∙P∙L−1. The LOD was calculated from the blank signal plus three times the standard deviation of triplicate blank sample measurement.
2) Stability of autoclaved samples
Generally, “sample stability” means the DOP concentration of the sample remains constant or less than 5% variation through times. Autoclaved samples normally have a pH in the range 0.9 - 1.2. Theoretically, at this pH, the nutrient concentrations in the samples should be stable for at least 5 days for storage at room temperature [29]. Figure 7 shows the results of the stability of autoclaved samples over 3 weeks. A batch of 6 orthophosphate standards (0, 10, 20, 30, 40 and 60 μg∙P∙L−1, n = 3 for each concentration) were autoclaved using the optimized autoclave procedure. All standards were stored at room temperature and analysed on day 1, 3, 7, 14, and 21. Day 1 sample means samples collected from autoclaved samples stored for 24 hr. There was no significant concentration change after 7 days (p = 0.004). However, from the day 14, 6% of loss at 30 and 60 μg∙P∙L−1 standards were observed. This suggests that autoclaved samples can be stable for up to 7 days at room temperature prior to analysis.
3.2.2. Optimization of the Segmented Flow Analyser Method
The rate of molybdenum blue formation is very pH dependent and therefore the effect of pH on the detection response was investigated. The results showed that

Figure 6. Effect of digestion reagents on the blank signal with and without autoclave procedure. Error bars represent +/− 1 standard deviation (s.d.).

Figure 7. Stability of autoclaved samples over a 3-week period.
increasing of the pH of the autoclaved samples did not affect the calculated IP concentrations. However, in the USEPA Persulfate Digestion Method 365.1, an acidified wash, (pH 1.0) is used in order to match the carrier stream with the pH of the samples after autoclaving. This was used to reduce the baseline noise and the blank response.
Figure 8 shows the comparison of calibration graphs for 6 autoclaved standards analysed using the normal wash stream (water) and an acidified wash stream. Using the non-acid wash, the blank signal was significantly higher than those with the acidified carrier, resulting in a lower LOD. However, the acid carrier only resulted in a slightly better sensitively compared with the non-acid carrier, as shown by the gradient of the calibration graph.
The sensitivity and reproducibility over time of the acidified carrier stream method for determining IP in autoclaved standards were conducted. Table 1

Figure 8. Typical calibrations obtained for autoclaved standards analysed using a normal carrier stream and an acidified carrier stream.

Table 1. Calibration equations (range 5 - 80 μg∙P∙L−1) for autoclaved inorganic phosphorus standards. RSD (n = 3) is given for the 40 μg∙P∙L−1 standard.
shows the results from 9 calibrations over a 10 week period (Jun.-Aug., 2015). The analytical variability for the 40 µg∙P∙L−1 standards was < 3.5%, the gradients (sensitivities) in all the equations were within 5% of each other and R2 values were all > 0.98. The LOD was 3 µg∙P∙L−1, which is comparable with the LOD of the USEPA Persulfate Digestion Method 365.1 of 4 µg∙P∙L−1. Table 2 shows typical calibration data for autoclaved inorganic P standards
3.2.3. Recovery of Model Organic P Compounds
The model compounds selected to examine the efficiency of the autoclaved method include a variety of naturally occurring molecules, most of which are widely distributed in natural waters [30]. Phytic acid is one of the P compounds most resistant to hydrolysis and is also one of the most refractory organic phosphorus compounds found in soils [31] [32]. β-D-glucose-1-phosphate contains a labile C-O-P bond and is a sugar arising from bacterial decomposition that is
Table 2. Typical calibration data for autoclaved inorganic P standards (n = 6).
widely distributed in soil leachates and marine waters [30]. Adenosine-5’-triphosphate (ATP) and adenosine-5’-diphosphate (ADP) are ubiquitous in nature [33] and contain C-O-P and P-O-P bonds. Methyltriphenylphosphonium bromide is a refractory compound containing a C-P bond. Sodium tripolyphosphate is a condensed inorganic compound containing P-O-P bonds. Cocarboxylase is also called thiamine pyrophosphate and is a coenzyme important in respiration in the Krebs cycle.
Figure 9 shows the results for 8 model compounds and orthophosphate (for comparison) at 50 µg∙P∙L−1 using the optimized autoclave method. Quantitative recovery was achieved for all model organic P compounds, with the only exception of phytic acid (C-P bond), which has the lowest recovery at 90% ± 5%. This is not surprising as phytic acid is one of the most resistant compounds to hydrolysis. Sodium tripolyphosphate (P-O-P bonds) had 95% ± 3% recoveries. Adenosine-5'-triphosphate (C-O-P and P-O-P bonds) recovery was 100% ± 10%. D-glucose-1-phosphate (labile C-O-P bond) gave 100% ± 1% recoveries. P-nitrophenyl phosphate and cocarboxylase had larger standard errors compared to the other compounds, presumably due to contamination of one test sample. Orthophosphate gave 100% ± 3.1% recovery. These results clearly show that organic compounds containing C-P bonds are the most resistant to hydrolysis, whereas C-O-P bonds are relatively labile, and that the autoclave method is suitable for most natural organic phosphorus compounds.
Although the acid peroxydisulphate method had a very good recovery for most of the organic P compounds in fresh water, it is not the ideal method for sea water samples. The matrix absorbs much of the energy and there is a potential risk that salts will precipitate out during digestion [34], making the method much more difficult to perform [35] [36] [37]. It can be seen from Figure 10 that the recoveries of DOP model compounds in low nutrient sea water were low. The recovery of phytic acid was < 20% and G-6-P and ATP were < 80%, possibly because the peroxydisulphate reagent was consumed by the oxidation of chloride ions to free chlorine [27]. One way to avoid this effect is to dilute sea water samples [36] by a factor of five to give a final salinity of 7. As shown in

Figure 9. The recovery of 8 organic P model compounds using the optimum autoclave method. The concentration of samples was 50 µg∙P∙L−1 and errors bars show ± 1 s.d (3 samples measured in triplicate (n = 9)).

Figure 10. Effect of dilution (5X) on the recovery of DOP in low nutrient seawater (salinity 35), error bars ± 1 s.d. (n = 3).
Figure 10, phytic acid recovery in salinity 7 water was 70%, and A-T-P and G-6-P were >90%.
4. Conclusion
Segmented flow analyser is able to directly determine inorganic P in natural waters and indirectly determine organic P after autoclave digestion. In this study, the author investigated several parameters that could impact the analytical results, for example, adjustment of the reagent temperature to room temperature to increase reaction sensitivity, reduction of the reaction temperature to 40˚C to minimize arsenate interference, replacement of the UHP wash stream by an acid wash stream to ensure the detection of autoclaved samples was not impacted by variations in the acidity of the samples, and reduction of the peroxydisulphate concentration to improve the detection sensitivity. The optimization of analytical method achieved quantitative recoveries of all organic P model compounds in fresh water samples. The autoclaved samples were stable at room temperature for at least 7 days prior to instrument analysis.
Acknowledgements
This project is supported by special fund of State Key Joint Laboratory of Environment Simulation and Pollution Control, and Beijing Normal University Youth Science Foundation (No. 105503GK).
Conflicts of Interest
The authors declare no conflicts of interest regarding the publication of this paper.
Cite this paper
Zhao, J.B., Liu, M.Y. and Chen, M. (2019) Analytical Errors in the Determination of Inorganic and Organic Phosphorus in Waters Based on Laboratory Experiences. Journal of Water Resource and Protection, 11, 53-67. https://doi.org/10.4236/jwarp.2019.111004
References
- 1. Bostrom, B., Jansson, M. and Forsberg, C. (1982) Phosphorus Release from Lake Sediments. Archives of Hydrobiology, 18, 5-59
- 2. Gardolinski, P.C.F.C., Worsfold, P.J. and McKelvie, I.D. (2004) Seawater Induced Release and Transformation of Organic and Inorganic Phosphorus from River Sediments. Water Research, 38, 688-692. https://doi.org/10.1016/j.watres.2003.10.048
- 3. Herbes, S.E., Allen, H.E. and Mancy, K.H. (1975) Enzymatic Characterization of Soluble Organic Phosphorus in Lake Water. Science, 187, 432-434. https://doi.org/10.1126/science.187.4175.432
- 4. Quiquampoix, H. and Mousain, D. (2005) Organic Phosphorus in the Environment. In: Turner, B.L., Frossard, E. and Baldwin, D.S., Eds., Enzymatic Hydrolysis of Organic Phosphorus, CABI, London, 89.
- 5. Redfield, A.C., Smith, H.P. and Ketchum, B. (1937) The Cycle of Organic Phosphorus in the Gulf of Maine. The Biological Bulletin, 73, 421-443. https://doi.org/10.2307/1537605
- 6. Whitton, B.A., et al. (2005) Organic Phosphorus in the Environment. In: Turner, B.L., Frossard, E. and Baldwin, D.S., Eds., Ecological Aspects of Phosphatase Activity in Cyanobacteria, Eukaryotic Algae and Bryophytes, CABI, London, 205.
- 7. Monbet, P., McKelvie, I.D. and Worsfold, P.J. (2009) Dissolved Organic Phosphorus Speciation in the Waters of the Tamar Estuary (SW England). Geochimica et Cosmochimica Acta, 73, 1027-1038. https://doi.org/10.1016/j.gca.2008.11.024
- 8. John, M.K. (1970) Colorimetric Determination of Phosphorus in Soil and Plant Materials with Ascorbic Acid. Soil Science, 109, 214-220. https://doi.org/10.1097/00010694-197004000-00002
- 9. To, Y.S. and Randall, C.W. (1977) Evaluation of Ascorbic Acid Method for Determination of Orthophosphates. Journal of the Water Pollution Control Federation, 49, 689-692.
- 10. Pai, S.C., Yang, C.C. and Riley, J.P. (1990) Effects of Acidity and Molybdate Concentration on the Kinetics of the Formation of the Phosphoantimonylmolybdenum Blue Complex. Analytica Chimica Acta, 229, 115-120. https://doi.org/10.1016/S0003-2670(00)85116-8
- 11. Blomqvist, S., Hjellstrom, K. and Sjosten, A. (1993) Interference from Arsenate, Fluoride and Silicate When Determining Phosphate in Water by the Phosphoantimolylmolybdenum Blue Method. International Journal of Environment Analytical Chemistry, 54, 3-43. https://doi.org/10.1080/03067319308044425
- 12. Zhao, J.B. (2006) Analytical Methods for the Determination of Inorganic and Organic Phosphorus in Natural Water, in 2nd Year Report. SEOES: University of Plymouth.
- 13. Smil, V. (2000) Phosphorus in the Environment: Natural Flows and Human Interferences. Annual Review of Energy and Environment, 25, 53-88. https://doi.org/10.1146/annurev.energy.25.1.53
- 14. APHA (1976) Standard Methods for the Examination of Water and Wastewater. 14th Edition, American Public Health Association, New York.
- 15. Mankasingh, U. (2005) Techniques for Studying the Biogeochemistry of Nutrients in the Tamar Catchment. Ph.D. Thesis, University of Plymouth, Plymouth.
- 16. Langston, W.J., et al. (2003) Characterisation of the South West European Marine Sites: Plymouth Sound and Estuaries cSAC, SPA. Marine Biological Association of the United Kingdom, 315-324.
- 17. Tuckwell, R. (2008) Flow Injection Techniques for the Determination of Nutrients in Natural Waters. MPhil Thesis, University of Plymouth, Plymouth.
- 18. Linge, K.L. and Oldham, C.E. (2001) Interference from Arsenate When Determining Phosphate by the Malachite Green Method. Analytica Chimica Acta, 450, 247-252. https://doi.org/10.1016/S0003-2670(01)01388-5
- 19. Holleman, A.F. and Wiberg, E. (2001) Inorganic Chemistry. Academic Press, San Diego, 741-755.
- 20. Badr, E.A., Tappin, A. and Achterberg, E. (2008) Distributions and Seasonal Variability of Dissolved Organic Nitrogen in Two Estuaries in SW England. Marine Chemistry, 110, 153-164. https://doi.org/10.1016/j.marchem.2008.04.007
- 21. Mighanetara, K., et al. (2008) Contaminant Fluxes from Point and Diffuse Sources from Abandoned Mines in the River Tamar Catchment, UK. Journal of Geochemical Exploration, 100, 116-124. https://doi.org/10.1016/j.gexplo.2008.03.003
- 22. Elbaz-Poulichet, F., et al. (1999) Trace Element Geochemistry in the Upper Amazon River. Geochimica et Cosmochimica Acta, 36, 1061-1066.
- 23. Kerouel, R. and Aminot, A. (1995) Model Compounds for the Determination of Organic and Total Phosphorus Dissolved in Natural Waters. Analytica Chimica Acta, 318, 385-390. https://doi.org/10.1016/0003-2670(95)00461-0
- 24. Thurman, E.M. (1985) Organic Geochemistry of Natural Waters. Nijhoff & Junk, Boston, 9.
- 25. McKelvie, I.D. (2005) Separation, Preconcentration and Speciation of Organic Phosphorus in Environmental Samples. In: Turner, B.L.e.a., Ed., Organic Phosphorus in the Environment, CABI Publishing, London, 1-20.
- 26. Haygarth, P.M., Warwick, M.S. and House, W.A. (1997) Size Distribution of Colloidal Molybdate Reactive Phosphorus in River Waters and Soil Solution. Water Research, 31, 439-448. https://doi.org/10.1016/S0043-1354(96)00270-9
- 27. Ridal, J.J. and Moore, R.M. (1990) A Re-Examination of the Measurement of Dissolved Organic Phosphorus in Seawater. Marine Chemistry, 29, 19-31. https://doi.org/10.1016/0304-4203(90)90003-U
- 28. Schwab, E.C. (2007) Low-Level Phosphorus Determination by USEPA Persulfate Digestion Method 365.1. National Water Quality Laboratory, Denver, 44.
- 29. Rowland, A.P. and Haygarth, P.M. (1997) Determination of Total Phosphorus in Soil Solutions. Journal of Environmental Quality, 26, 410-415. https://doi.org/10.2134/jeq1997.00472425002600020011x
- 30. Worsfold, P.J., et al. (2005) Sampling, Sample Treatment and Quality Assurance Issues for the Determination of Phosphorus Species in Natural Waters and Soils. Talanta, 66, 273-293. https://doi.org/10.1016/j.talanta.2004.09.006
- 31. Maher, W. and Woo, L. (1998) Procedures for the Storage and Digestion of Natural Waters for the Determination of Filterable Reactive Phosphorus, Total Filterable Phosphorus and Total Phosphorus. Analytica Chimica Acta, 375, 5-47. https://doi.org/10.1016/S0003-2670(98)00274-8
- 32. Martin, M., Celi, L. and Barberis, E. (1999) Determination of Low Concentration of Organic. Phosphorus in Soil Solution. Communications in Soil Science and Plant Analysis, 30, 1909-1917. https://doi.org/10.1080/00103629909370341
- 33. Espinosa, M., Turner, B.L. and Haygarth, P.M. (1999) Preconcentration and Separation of Trace Phosphorus Compounds in Soil Leachate. Journal of Environmental Quality, 28, 1497-1504. https://doi.org/10.2134/jeq1999.00472425002800050015x
- 34. Jenkins, D. (1986) Advanced Chemistry. Oxford University Press, Oxford, 41.
- 35. Nguyen, L. and Sukias, J. (2002) Faecal Contamination and the Removal of Escherichia Coli (E. coli) in Drainage Ditches. In: Currie, L.D. and Loganathan, P., Eds., Dairy Farm Soil Management, Fertilizer and Lime Research Centre, Massey University, Palmerston North, 261-266.
- 36. Aminot, A. and Kérouel, R. (2001) An Automated Photo-Oxidation Method for the Determination of Dissolved Organic Phosphorus in Marine and Fresh Water. Marine Chemistry, 76, 113-126. https://doi.org/10.1016/S0304-4203(01)00052-4
- 37. Sandford, R.C., Exenberger, A. and Worsfold, P.J. (2007) Nitrogen Cycling in Natural Waters Using in Situ, Reagentless UV Spectrophotometry with Simultaneous Determination of Nitrate and Nitrite. Environmental Science & Technology, 41, 8420-8425. https://doi.org/10.1021/es071447b