Journal of Water Resource and Protection
Vol.6 No.8(2014), Article
ID:47286,12
pages
DOI:10.4236/jwarp.2014.68073
Recharge to Blue Lake and Strategies for Water Security Planning, Mount Gambier, South Australia
Nara Somaratne1*, Jeff Lawson2, Glyn Ashman1, Kien Nguyen3
1South Australian Water Corporation, Adelaide, Australia
2Department of Environment, Water and Natural Resources, Mount Gambier, Australia
3Hydraulic Works and Management Division, Directorate of Water Resources, Ministry of Agriculture and Rural Development, Hanoi, Vietnam
Email: *nara.somaratne@sawater.com.au
Copyright © 2014 by authors and Scientific Research Publishing Inc.
This work is licensed under the Creative Commons Attribution International License (CC BY).
http://creativecommons.org/licenses/by/4.0/


Received 9 May 2014; revised 1 June 2014; accepted 17 June 2014
ABSTRACT
Blue Lake, a volcanic crater provides municipal water supply to the city of Mount Gambier, population of 26,000. Current average annual pumping from the lake is 3.6 × 10⁶ m3. The lake is fed by karstic unconfined Gambier Limestone aquifer. Storm water of the city discharges to the aquifer via about 400 drainage wells and three large sinkholes. Average annual storm water discharge is estimated at approximately 6.6 × 10⁶ m3 through drainage wells and sinkholes within 16.8 km2 of the central part of the city. Chemical mass balance for calcium was used to estimate groundwater inflow to the lake at 6.3 × 10⁶ m3, almost equal to the volume of storm water discharge and slightly higher than the previous estimates using environmental isotopes (4.8 - 6.0 × 10⁶ m3). Considering the lake outflow volume of 2.7 × 10⁶ m3, the net inflow to the lake equates to the current annual pumping and therefore it is considered that the current pumping rate is at the upper limit. For meeting the short-term future demand, confined aquifer water may be used and in the longerterm, an additional well field is required outside the Blue Lake capture zone, preferably to the north-east of the city. For water supply security, inflow to the lake along with water quality has to be maintained within the city. Current annual private abstraction within the capture zone is about 4.4 × 10⁶ m3 and in order to maintain aquifer water levels, no additional allocation should be allowed.
Keywords:Blue Lake, Recharge, Water Security Planning, Groundwater, Water Resource Management

1. Introduction
Blue Lake, a picturesque volcanic crater, is the source of drinking water supply to the city of Mount Gambier, a large regional city of South Australia, population about 26,000. Additionally, Blue Lake is an important tourist attraction due to its annual colour change cycle, which is driven by calcite precipitation [1] -[4] . The lake is groundwater-fed through an extensive karst aquifer [5] [6] .
The water balance of this groundwater-fed lake has been altered through urbanisation since settlement in the mid-to-late 1800s [7] . As a result, the average water residence time within the lake declined from 23 ± 2 years to 8 ± 2 years by the late twentieth century [8] . Urbanisation has produced a threefold increase in deposition of calcite in Blue Lake [8] , and it is possible that the annual calcite precipitation cycle provides a mechanism for determining annual inflow to the lake [9] . The average depth of the lake is approximately 72 m and the surface area is 6.1 × 10⁵ m2. Owing to the steep slopes of the crater, the surface water catchment area is limited to 8.6 × 10⁵ m2, only slightly greater than the surface area of the lake itself [3] [7] . A water balance analysis of the lake confirms that the main input is groundwater, of which a considerable portion is storm water recharge. Current annual extraction from Blue Lake for drinking water supply is approximately 3.6 × 10⁶ m3, with a peak annual extraction of 4.2 × 10⁶ m3 during the 1970s (Figure 1).
Estimation of recharge to Blue Lake is critical to water supply security. Few studies compare hydrological and chemical estimates of seepage to and from lakes. The net contribution of groundwater to lakes is commonly estimated as the difference between measured gains and losses of water from stream flow, precipitation, and evaporation [10] [11] . Another approach to determining the groundwater component of lake water balances is to use chemical mass balance of major ions [12] .
A comprehensive evaluation via the flow net approach is possible, where groundwater seepage is a major component of water and chemical balances [13] [14] . For example, a study of Williams Lake, Minnesota, focused on water and chemical balances from 1980 through 1991 [14] .
To estimate recharge to Blue Lake, Turner [15] used environmental isotopes and concludes that 80% of annual inflow to the lake results in leakage from the confined aquifer. Ramamurthy [9] used environmental isotopes 234U and 238U and interpretation of hydrochemical data of the aquifer and lake; in this study, the basic strategy was to compute mass balance calculations of U and Ca in the lake and interpret the results from its recharge regime. Turner et al. [6] re-examined inflow to the lake using environmental isotopes 3H, 2H, 18O and 14C in lake water and groundwater. Similar to Ramamurthy [9] , Turner et al. [6] assumed that only 10% of inflow to the lake comes from the confined aquifer through upward leakage. Herczeg et al. [8] studied alteration in catchment subsurface water balance through land use changes on the lake; and changes to the water and carbon budget of the lake using sediment isotope records (δ18Ocarb, δ13Ccarb, and δ13Corg).
We examined the water balance of the lake using mass balance of the calcium. Investigation includes water sampling and analysis for major ion chemistry of the aquifer, analysis of available sediment core samples for major ion chemistry, and recharge estimation of the capture zone immediately up-gradient to the lake.
2. Study Area
Mount Gambier is the main city in the Lower South East of South Australia (Figure 2), a region dependent
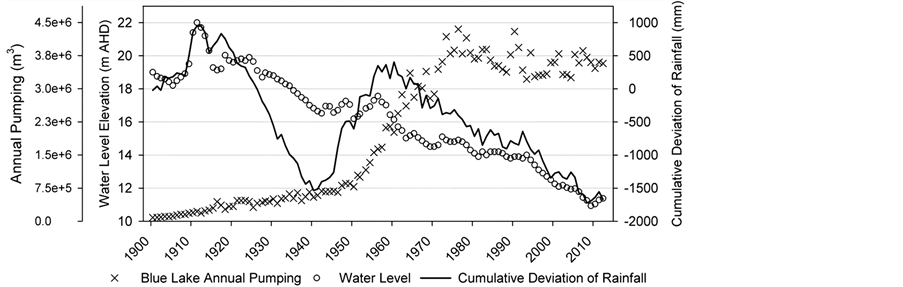
Figure 1. Blue Lake water level, annual pumping and cumulative deviation of mean annual rainfall.
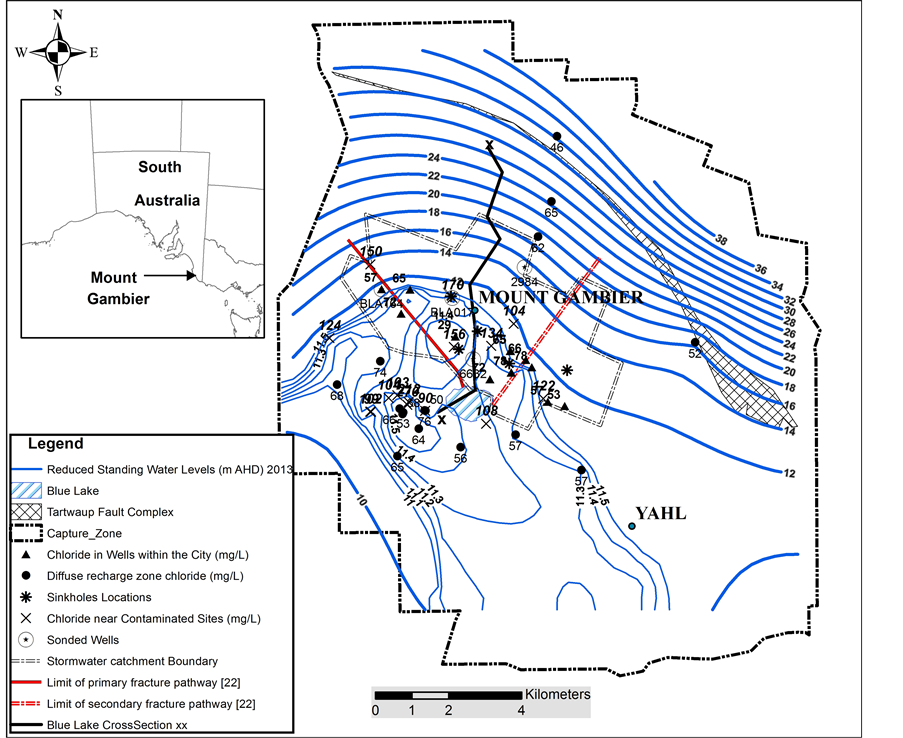
Figure 2. Location map of the Blue Lake and capture zone.
primarily on groundwater for water supply [16] . Since the 1970s, the city has experienced steady growth in population with resultant development activity [17] . Blue Lake is the largest of three lakes formed in a volcanic complex in the Lower South East of South Australia [18] . As is typical of many crater lakes, Blue Lake is steepsloped, has a very small surface catchment, and is relatively deep for its surface area [1] [6] . Blue Lake has a warm monomictic stratification regime (i.e., mixes once a year; Wetzel [19] ), is oligotrophic (i.e., has a low biological productivity), and algal production is probably phosphorus limited [2] . The surrounding region has a temperate climate, with annual mean maximum temperature of 18˚C and mean minimum of 8˚C. Average annual rainfall is 750 mm and pan evaporation is about 1400 mm.
Hydrogeological Setting
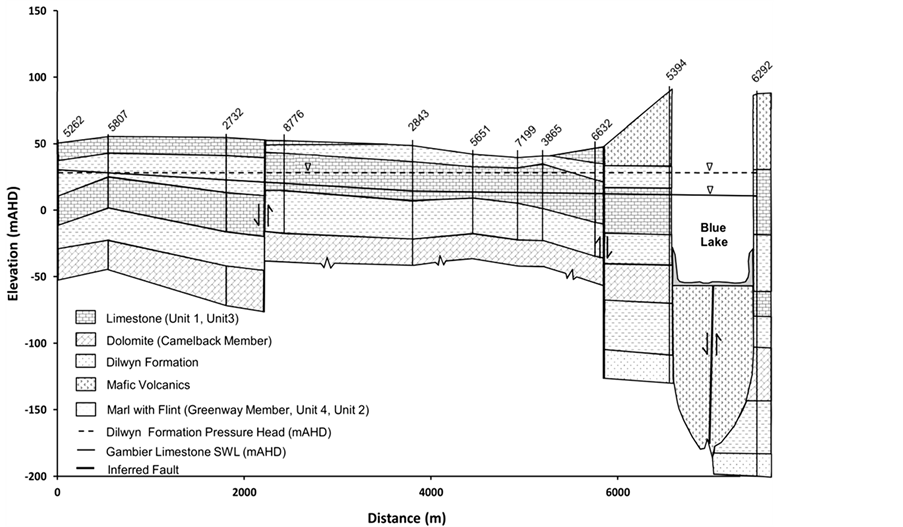
The study area is located within the Gambier Basin, a mixed sequence of marine and terrestrial deposits [20] . The main geological units in the Mount Gambier area, in downward order, consist of Holocene volcanic deposits, the Bridgewater Formation (stranded Pleistocene beach dunes), the Gambier Limestone and the Dilwyn Formation [21] . The unconfined aquifer within the Gambier Limestone is a continuous system and an important supplier of groundwater throughout the region. Karstic features are common within the Gambier Limestone. With the exception of local areas where direct disposal of organic wastes occurs, the aquifer is generally well oxygenated and with relatively low salinity (300 - 600 mg∙L−1). Underlying the Gambier Limestone is the Dilwyn Formation, which comprises a series of unconsolidated sands with carbonaceous clay interbeds (Figure 3). The Dilwyn Formation hosts a confined aquifer with higher salinity than the Gambier Limestone. A major fault underlies the Blue Lake, which is thought to represent a zone of regional structural weakness through which
volcanic activity has occurred.
Recently, Lawson [22] refined the stratigraphy of the Gambier Limestone surrounding the Blue Lake, defining the subunits within the Gambier Limestone in hydrostratigraphic terms (Figure 3). The following are general descriptions of the unconfined aquifer hydrostratigraphic unit characteristics as described by Li et al. [23] .
Green Point Member Unit 1 (Unit 1) is a transmissive bryozoal limestone with marl and flint inclusions. Green Point Member Unit 2 (Unit 2) is composed of marls and flints, has the potential to act as a semi-confining unit and is characterised by generally lower transmissivities with associated low hydraulic conductivity. Green Point Member Unit 3 (Unit 3) is described as an open transmissive bryozoal limestone. It contains minor fracturing and may be partly dolomitised. This unit is characterised by higher aquifer transmissivities and associated hydraulic conductivity. Green Point Member Unit 4 (Unit 4) is typically described as a deep marl section within the limestone. It may act as an aquitard with typically associated lower hydraulic conductivity. Camelback Member is a dual porosity unit, characterised by extensive fracturing at the subunit intersection point. This results in extremely high porosities and hydraulic conductivities. The non-fractured sections of the subunit are composed of fine dolomitic rhombs and have transmissivities probably similar to or lower than bryozoal sections of limestone. Greenways Member is typically described as grey basal marl with resultant low transmissivities and hydraulic conductivity (Figure 3).
3. Methods
3.1. Field Measurements
Existing groundwater data from the capture zone and the Blue Lake were used in this study. Additional groundwater samples for major ion chemistry analysis were taken from the Blue Lake capture zone, within and outside the city, to supplement existing knowledge and to fill data gaps. Groundwater samples for major ion chemistry analysis were collected using the micro-purge (low-flow) sampling procedure [24] along with grab sampling. Micro sampling is employed to gain representative groundwater samples within the open-hole sections of monitoring and drainage wells. Low-flow purging is considered [24] superior to bailing and high-rate pumping and results in a more representative sample than the typical three-volume, well-purge methodology. The assumption when using grab sampling is that the hydrostratigraphy in the well is in hydraulic equilibrium prior to sampling. To collect the sample by this method, an electronic depth sampler connected to a geophysical logging line is advanced to the target sampling depth and the unit is electronically opened, allowing groundwater to enter the sampler. After a short wait, the sampler is closed again. Salinity profiles of monitoring and drainage wells were obtained using Hydrolabsonde [25] connected to a logging truck cable and lowered down the well from the surface to the well base, recording electrical conductivity (EC) data along the way.
3.2. Recharge to the Capture Zone
Gambier Limestone water level contours indicate a potential for ground water flow toward Blue Lake from all points within the lake’s ground water capture zone (Figure 2). Aquifer parameters derived from pumping tests are limited in number and show large variation. The water table fluctuation method for recharge assessment is therefore discounted as a suitable method. Long-term average recharge to the capture zone may be obtained using the conventional chloride mass balance method, but of most interest to this study is recharge in that part of the capture zone, where point recharge through about 400 drainage wells [26] and 3 sinkholes directly recharges the aquifer system in the city. The area selected for this purpose is the inflow area between the primary fracture pathway and secondary fracture pathway (Figure 2) of Lawson [22] . Recharge to the inflow zone of Blue Lake is assessed using the generalized chloride mass balance method described in [27] :
 (1)
(1)
where R (LT−1) is the recharge, P (LT−1) is average annual rainfall, cp+D (ML−3) is chloride concentration of rainfall including contribution from dry deposition, cs (ML−3) is chloride concentration of surface water, Qp (LT−1) is runoff to sinkholes (point recharge source) and cgd (ML−3) is groundwater chloride concentration in the diffuse recharge zone. Note that Qp is expressed as depth of catchment. In the absence of direct measurement, cp+D can be estimated from [28] using:
 (2)
(2)
where “d” is distance in kilometers from the ocean in the prevailing wind direction and cs is taken from surface water sampling for chloride analysis. An important input parameter for Equation (1) is Qp, which is taken from Nguyen [29] . For brevity, a brief description of the modelling procedure is provided below.
As part of the recharge estimation for Blue Lake in Mount Gambier, Nguyen [29] used the urban storm water model MUSIC [30] for quantifying storm water runoff to drainage wells. In that study, rainfall and runoff processes were modelled for the period 2007-2012 using a daily time-step with daily rainfall and evaporation data. For sub-catchments with drainage wells, average percentage of impervious (51%) and pervious (49%) areas were determined from digital maps of the city using geographic information system tools. A rainfall threshold of 1 mm was used for impervious areas. Uniform soil storage capacity and field capacity values of 120 mm and 80 mm were used for the pervious areas. Initial soil storage capacity was set to 30%. Average annual runoff volume from both pervious and impervious areas were calculated as point recharge to drainage wells and sinkholes. A sensitivity analysis indicates field capacity of the soil had the greatest effect on runoff from the previous area [29] . Storm water derived from the central 16.8 km2 of the city area (26.5 km2) is discharged to the unconfined aquifer through three sinkholes and about 400 storm water drainage wells. For the average annual rainfall of 750 mm, 6.6 × 10⁶ m3 of runoff volume flows through drainage wells and sinkholes to groundwater. Out of total runoff volume, about 5.4 × 10⁶ m3 is generated from the impervious areas of the catchment.
3.3. Inflow to Blue Lake
Ramamurthy [9] argues that when the Blue Lake unconfined aquifer water level is compared to the confined aquifer water level, a positive head difference of about 20 m is observed, creating the possibility of upward leakage through a volcanic conduit, if present. An outcome of this scenario would be resultant elevated chloride values in water chemistry sampled from the lake’s base. Conventional through-flow calculation using Darcy’s equation or flow net approach [14] is not followed in this study due to the extreme heterogeneity of the Gambier Limestone aquifer. The transmissivity of the aquifer is in the range of 450 - 24,000 m2·day−1 and specific yield is 0.1 - 0.4 for the Gambier Limestone [31] . As an alternative approach, water and chemical mass balance is used to estimate ground water inflow and outflow for lakes [32] . This is in contrast to the typical water budget approach, which allows only the net ground water flow to be computed. In addition, when using steady-state assumptions, combined with the water budget, the chemical mass balance approach computes long-term estimates of ground water inflow and outflow [32] . The approach used in this study is to compute ground water inflow-outflow using a mass balance calculation of Ca in the lake and to interpret the results with respect to the groundwater flow regime.
Although Na and Cl are conservative elements, large variation in recorded values in the aquifer due to contaminated sites preclude mass balance calculations. In addition to the contribution from contaminated sites, Ramamurthy [9] suggests leaching of Na and Cl ions from basaltic rocks is a likely additional source. As a result, chloride is not used for the chemical mass balance calculation for the lake; this is computed using mass balance of the Ca ion in this study.
Higher Ca2+ concentrations in the surrounding groundwater were observed than those recorded in the lake. This is due to the reaction of calcite with carbon dioxide derived from oxidation of organic matter in the aquifer. The fundamental basis for this is that carbon dioxide reacts with water to form carbonic acid (H2CO3), providing protons (H+), which associate with the carbonate ion ( ) from calcite to form bicarbonate (
 ). The overall reaction between CO2 and CaCO3 is [33] :
 (3)
(3)
 (4)
(4)
This reaction is fundamental to understanding the behaviour of CaCO3 dissolution and precipitation in nature. An increase in CO2 results in dissolution of CaCO3. Removal of CO2 causes CaCO3 to precipitate. This degassing of CO2 in the lake causes CaCO3 to precipitate, therefore reducing Ca2+ in the lake water. Another process of removal of CO2 in lakes is photosynthesis, which consumes CO2. Therefore, with knowledge of Ca2+ in the aquifer, the lake and its removal through pumping and sedimentation, it is possible to calculate inflow to the lake using the water and Ca2+ budgets.
A water budget for the lake can be written as [8] :
 (5)
(5)
where ΔV is average annual change in storage (L3), Δt is time (T), I is annual inflow (L3T−1) to the lake, O is annual outflow volume from the lake (L3T−1), P is annual extraction volume (L3T−1), R is annual volume of rainfall to the lake (L3T−1) and E is annual evaporation (L3T−1).
The general equation for the chemical budget of the lake is [14] :
 (6)
(6)
where S is the amount of ion deposited in the lake sediment (MT−1), c is chemical concentration (ML‑3), subscript l is for lake and subscript “gwi” is for groundwater inflow. Equation (6) assumes any change in c due to R and E is negligible.
4. Results and Discussion
4.1. Water Balance
Water samples for analysis were taken from monitoring wells where stratigraphy had been interpreted. Water chemistry data presented in Table 1 are from the capture zone surrounding Blue Lake and include wells located near historically known contaminated sites. Ramamurthy [9] noted that anomalously high concentrations of Na, Cl and Uranium toward the northwest of the lake were likely caused by leaching of basaltic rocks. Average chloride data indicate consistent distribution across unconfined aquifer subunits, with the value in the Camelback Member markedly lower than the recorded concentrations in the Dilwyn Formation confined aquifer. This indicates that there is no significant upward leakage to the Gambier Limestone aquifer from the confined aquifer despite the pressure head difference being positive. Slightly elevated calcium ion in aquifer Unit 4 is an indication of low hydraulic conductivity of the subunit, where water flow is slow, thus increasing the contact time with limestone.
The large variation in EC may be due to non-uniform mixing with sub-aquifer waters through leakage, diffuse

Table 1 . Water quality parameters of the unconfined aquifer. Sample size, n, is given in bracket [after ]">22].
recharge and point recharge via drainage wells and sinkholes. An interesting point to note is that the lowest EC is found in the deepest sub-aquifer, the Camelback Member, even though the drainage wells are open-hole construction below the water table and generally extend to this subunit. This confirms that the Camelback Member is the major pathway carrying recharge water from drainage wells to the lake. Chloride data obtained in this study is comparable with the Ramamurthy study [9] , where an average chloride value of 81.3 ± 10.4 (n = 10) is reported. Chloride values obtained from monitoring wells away from contaminated sites (63 ± 26, n = 16) are the same as chloride values obtained in the diffuse recharge zone outside the city boundary (Figure 2), 62.9 ± 9 (n = 13), indicating that point recharge through drainage wells has not altered the chloride in the point recharge zone.
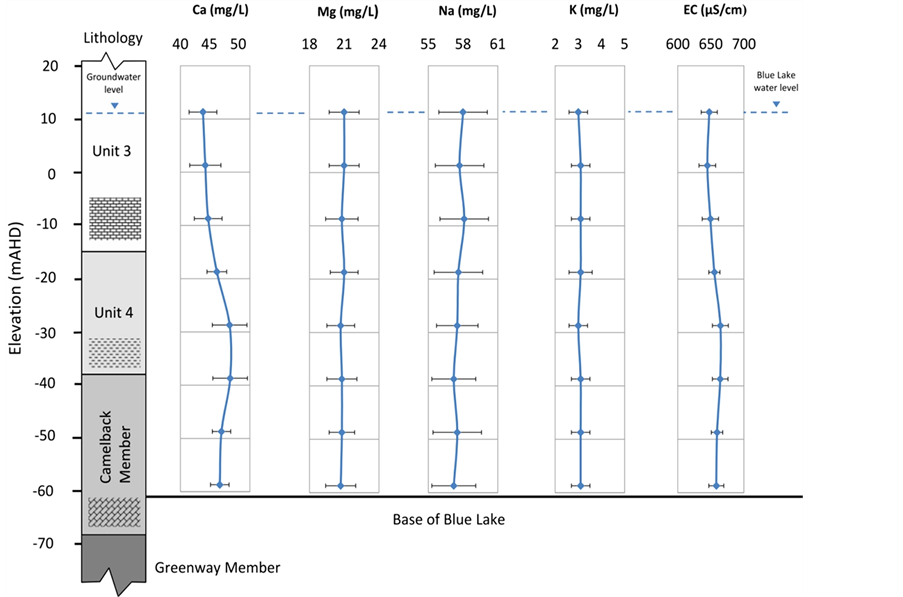
Blue Lake water chemistry data are presented against the stratigraphy of the north wall of the lake (Figure 4). An increased calcium value (Figure 4(a)) at Unit 4 level corresponds to the enhanced Ca ion in the aquifer. Significantly decreased Ca ion in the lake is due to CaCO3 precipitation as CO2 degassing takes place and is reflected in the reduced free CO2 profile in the lake. Other than Ca,  and free CO2, variations of all other parameters in the lake are insignificant, indicating that the lake is well-mixed.
Even though the chloride values within both the lake and outside groundwater are similar (Table 1 and Figure 4), about 82 to 85 mg·L−1, the chloride value in the Dilwyn confined aquifer is significantly higher at around 160 mg/L (160.5 ± 16 mg·L−1). This indicates that upward leakage from the confined aquifer through the volcanicfault is insignificant, and thus an assumption can be made that the lake water is solely derived from the unconfined limestone aquifer.
Groundwater inflow to the lake in this study is based on mass balance Equations (1) and (2). For the chemical mass balance, Ca2+ is taken, because no excessive variation in Ca2+ ion occurs in the aquifer when compared to Na or Cl ions (Table 1). The annual rate of recharge to the lake is calculated on the basis of the calcium ion in the aquifer, the lake and the sedimentation rate in the lake. The mass balance calculation for calcium was done on the basis of a single mean value taken from the aquifer, and the lake. This approach envisages that groundwater inflow to the lake is exclusively from the unconfined aquifer. The amount of Ca precipitated in the lake (Table 2) is calculated for two depositional periods, historical and contemporary. As is evident in Table 2, the sediment accumulation rate has increased in recent years, indicating higher precipitated calcite as CO2 is degassed, implying more groundwater enters the lake.
Herczeg et al. [8] report that the volumetric porosity of sediment cores range between 0.8350 and 0.875 throughout most cores, resulting in a volumetric dry bulk density of 0.125 - 0.165 g∙cm−3. Porosity increases to 0.910 over the top 25 mm, with a corresponding decrease in bulk density to 0.090 g∙cm−3 at the top of the core. With the assumption of dry bulk density of 2.5 g∙cm−3, Herczeg et al. [8] estimate the chronological age of individual sediment layers up to a depth of 130 mm by 210Pb-derived mass accumulation rate estimates. Accordingly,
 (a)
(a)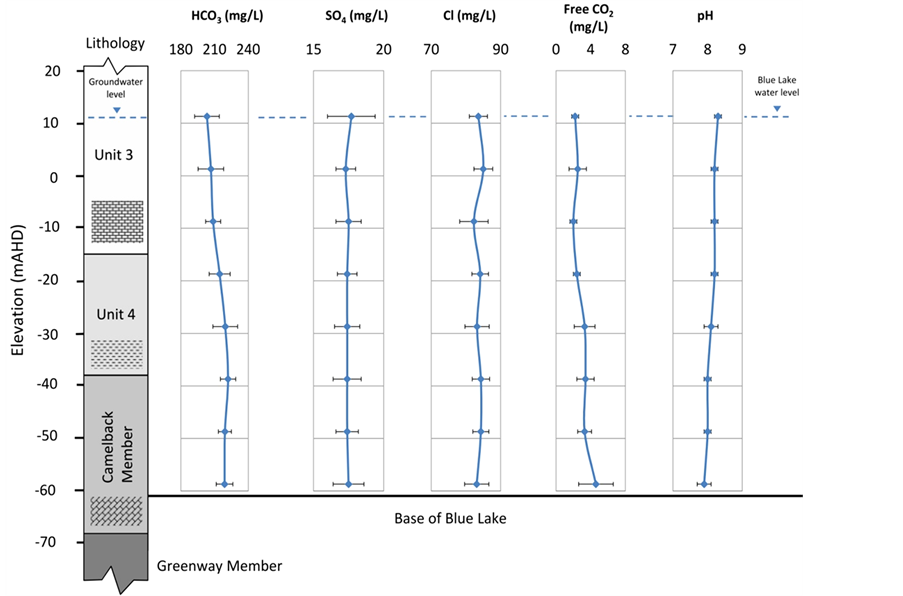 (b)
(b)
Figure 4. Water quality data for Blue Lake (data source: South Australian Environmental Protection Authority, unpublished data). (a) Cations and EC; (b) Anions and free CO2 and pH.
140 mm depth of sediment corresponds approximately with the year 1915. Using the sediment depth versus the year of the deposition relation of [8] , it is estimated that the high accumulation rate began in the 1940-1950 period (78 mm depth), which corresponds to acceleration of pumping, as shown in Figure 1. The 130 mm depth corresponds to approximately a 1920 date of deposition, and therefore, the pumping rate in 1920 (337 × 103 m3·yr−1) was taken as the historical pumping rate for the calculation.
The input parameters and calculated inflow to and outflow from the lake are given in Table3 Based on calcium precipitation, contemporary inflow and outflow calculated in this study are higher than the Herczeg et al. [8] estimate but comparable to the results of [9] and [6] . Ramamurthy [9] calculate the lower limit of annual recharge to the lake at the present time as 4 × 10⁶ m3·yr−1 with an upper limit of 6.6 ×10⁶ m3·yr−1. Turner et al. [6] use the environmental isotopes 3H, 2H, 18O and 14C in the lake and groundwater to estimate the rate of groundwater through-flow in the lake. The water balance calculations of [6] indicate a total groundwater inflow to Blue Lake of between 5.0 and 6.5 ×10⁶ m3·yr−1, which is in good agreement with the Ramamurthy (1983) estimate. Both [9] and [6] consider that 90% of groundwater inflow to the lake comes from the unconfined aquifer, and ignore the possibility of groundwater outflow from the lake.
Based on isotope mass balance of the sediment (δ18Ocarb), Herczeg et al. [8] determine the historical inflow to the lake at 2.8 × 10⁶ m3 and outflow at 2.48 × 10⁶ m3 from the lake, and contemporary inflow of 4.8 × 10⁶ m3 with outflow of 0.73 × 10⁶ m3. Total inflow to the lake calculated using calcite precipitation in the lake is slightly higher than the average total inflow of 6.0 × 10⁶ m3 determined by Ramamurthy [9] and Turner et al. [6] . The net inflow to the lake from calcite precipitation (3.6 × 10⁶ m3) corresponds to current annual pumping and is an indication that the pumping rate has reached its upper limit. Recharge to the aquifer is calculated using equation (1) for the inflow area (14 km2), which corresponds to an area between the primary and secondary fracture
Table 2 . Blue Lake sediment analysis for major ions.
Table 3. Input parameters and inflow and outflow to blue lake.
flow paths []">22] , within the city limits with parameters for Equation (1) taken as: P (750 mm·yr−1), cp+D (14.3 mg·L−1), cgd (69 mg·L−1), Qp (390 mm∙yr−1) and cs (14 mg·L−1). This results in an average annual recharge volume of 6.85 × 10⁶ m3, which is comparable with present day annual inflow to the lake. An interesting point to note is that contemporary inflow to the lake is satisfied by point recharge through drainage wells.
Slightly higher water levels in aquifer Unit 1 in the southern face (Figure 2) also suggest groundwater inflow to the lake as originally reported in [4] . In this study, inflow from subunit 1 is assumed to be minor and is not included in the water balance calculation. In contrast, lower groundwater levels in aquifer subunits 2 and 3 on the southern side suggest these units are the major outflow from the lake []">22] . Turner et al. [6] suggest that the groundwater release zone of flow through lakes can be delineated by mapping the distribution of enriched stable isotope compositions of lake water in the surrounding aquifer. Identification of aquifer subunits that carry outflow from the lake was not carried out, as currently there are insufficient data from the southern side of the lake; this is a subject left for future investigation.
4.2. Management Strategies for Water Security
Determination of a water balance is an important factor in the management of water supplies. This paper indicates that the current level of extraction is at the upper limit of a sustainable yield and that an additional water source is required to satisfy increases in demand. To satisfy an increase in demand, a planning strategy is required that identifies both potential threats and constraints to the water supply and opportunities for additional supply sources. The current town water supply to the city of Mount Gambier is reliant on Blue Lake, with two wells constructed in the confined aquifer as emergency water supply.
Two factors need to be considered for water supply security of the lake. First, maintaining current pumping levels from the unconfined aquifer, and second, protection of water quality. In the absence of surface water supplies in the area, ground water supplies from the unconfined aquifer are used for irrigation. Currently, a total of 4.4 × 10⁶ m3 is extracted for private irrigation use from the capture zone. While there is no significant extraction that directly intercepts flow paths to Blue Lake, an increase in extraction from the south and southeast would affect the flow regime and hence the lake’s water balance. Thus, limiting extraction to current levels is suggested, with no additional allocation permitted within the capture zone.
In a comparison of historical water quality data for Blue Lake and for groundwater in the unconfined Gambier Limestone aquifer with water quality target values, Vanderzalm et al. [34] [35] show no potential for breach of these water quality guideline values. Trace metal and metalloid data illustrate several historical peaks in concentration, but no evidence suggests rising concentrations within Blue Lake, since co-precipitation occurs with the lake’s calcite precipitation process [35] .
Based on average population growth in the city 2001-2006 period of 0.8%, a population increase of up to 33,000 could occur by 2030 [17] . With current extraction from the lake already at its upper limit, alternative water sources need to be developed to satisfy increasing demand. For short-term demand increases, the confined aquifer water is the most likely source. The limitations of this option are the need for the wells to be sited to ensure cost effective chlorination and blending, and the ratio of confined to unconfined water that can be achieved while maintaining acceptable hardness and salinity levels.
For long-term planning, an additional unconfined aquifer wellfield is required targeting the Camelback Member subunit. Location of such a wellfield will be the subject of additional investigations. Establishing a wellfield on the southern side of the lake is dependent on the capacity of the water distribution network. A wellfield on the north side beyond the Tartwarp fault complex is preferred, as the city is expanding toward the north. In the northwestern part of the city, the target subunit Camelback Member occurs at a shallow depth []">22] , and hence is prone to contamination. Therefore, the northeastern side beyond the capture zone boundary may be a potentially suitable area for investigation for a future wellfield.
5. Conclusion
A water balance calculation based on calcite precipitation in Blue Lake provides comparable results with previous water balance studies based on environmental isotopes. Current net inflow to the lake equates to the current extraction level, and recharge through drainage wells equates to the total inflow to the lake. This indicates extraction from the lake has reached its upper limit, and recharge via drainage wells forms an important component of the lake’s water balance. While short-term demand increase can be satisfied from the confined aquifer, an alternative wellfield in the unconfined aquifer is recommended to meet long-term water demand.
Acknowledgements
The authors thank Joanne Vanderzalm for providing Blue Lake sediment core samples for major ion chemistry analyses and discussion on sediment deposition periods. Daryl Morgan of Mount Gambier City Council is thanked for providing catchment data for the rainfall-runoff model. The editor and reviewers are thanked for evaluating the manuscript.
References
- Tamuly, T. (1969) Physical and Chemical Limnology of the Blue Lake of Mount Gambier. School of Physical Sciences, Flinders University, Adelaide, Research Paper No. 28.
- Allison, G.B. and Harvey, P.D. (1983) Freshwater Lakes, in Natural History of South East. In: Tyler, M.J., Twidale, C.R.T., Ling, J.K. and Holmes, J.W., Eds., Royal Society of South Australia, 61-74.
- Telfer, A.L. (2000) Identification of Processes Regulating the Colour and Colour Change in an Oligotrophic, Groundwater-Fed Lake, Blue Lake, Mount Gambier, South Australia.
- Turoczy, N.J. (2002) Calcium Chemistry of Blue Lake, Mount Gambier, Australia, and Relevance to Remarkable Seasonal Colour Changes. Archiv fur Hydrobiologie, 156, 1-9. http://dx.doi.org/10.1127/0003-9136/2002/0156-0001
- Waterhouse, J.D. (1977) The Hydrogeology of the Mount Gambier Area. Department of Mines, Geological Survey of South Australia, Report of Investigations 48.
- Turner, J.V., Allison, G.B. and Holmes, J.W. (1983) Environmental Isotope Methods for the Determination of Lake-Groundwater Relations: Applications to Determine the Effect of Man’s Activities. International Conference on Groundwater and Man, Sydney, 1.
- Lamontagne, S. and Herczeg, A. (2002) Predicted Trends for NO3-Concentration in the Blue Lake, South Australia, Consultancy Report for South Australian Environment Protection Authority, CSIRO Land and Water.
- Herczeg, A.L., Leaney, F.W., Dighton, J.C., Lamontagne, S., Schiff, S.L., Telfer, A.L. and English, M.C. (2003) A Modern Isotope Record of Changes in Water and Carbon Budgets in a Groundwater-Fed Lake: Blue Lake, South Australia. Limnology and Oceanography, 48, 2093-2105. http://dx.doi.org/10.4319/lo.2003.48.6.2093
- Ramamurthy, L.M. (1983) Environmental Isotope and Hydrogeochemical Studies of Selected Catchments in South Australia. Ph.D. Thesis, School of Earth Sciences, Flinders University, Adelaide.
- Likens, G.E. (1985) An Ecosystem Approach to Aquatic Ecology—Mirror Land and Its Environment. Springer-Verlag, New York. http://dx.doi.org/10.1007/978-1-4613-8557-8
- Staubitz, W.W. and Zariello, P.J. (1989) Hydrology of Two Headwater Lakes in the Adirondack Mountains of New York. Canadian Journal of Fisheries and Aquatic Sciences, 46, 268-276. http://dx.doi.org/10.1139/f89-037
- Srauffer, R.E. (1985) Use of Solute Tracers Released by Weathering to Estimate Groundwater Inflow in Seepage Lakes. Environmental Science Technology, 19, 405-411. http://dx.doi.org/10.1021/es00135a003
- Brown, B.E. and Cherkauer, D.S. (1992) Phosphate and Carbonate Mass Balances and Their Relationships to Groundwater Inputs at Beaver Lake, Waukesha County, Wisconsin. Wisconsin Water Research Center.
- LaBaugh, J.W., Winter, T.C., Rosenberry, D.O., Schuster, P.F., Reddy, M.M. and Aiken, G.R. (1997) Hydrological and Chemical Estimates of the Water Balance of a Closed-Basin Lake in North-Central Minnesota. Water Resources Research, 33, 2799-2812. http://dx.doi.org/10.1029/97WR02427
- Turner, J.V. (1979) The Hydrologic Regime of Blue Lake, South Australia. Ph.D. Thesis, School of Earth Sciences, Flinders University, Adelaide.
- Emmet, A.J. (1985) Mount Gambier Storm Water Quality. Department of Engineering and Water Supply Report 84/23.
- Planning, S.A. (2008) Greater Mount Gambier Master Plan. Government of South Australia, Strategic and Social Planning Division, Planning SA.
- Sheard, M.J. (1983) Volcanoes. In: Tyler, M.J., Twidale, C.R.T., Ling, J.K. and Holmes, J.W., Eds., Natural History of Southeast, Royal Society of South Australia, Adelaide, 7-14.
- Wetzel, R.G. (1983) Limnology. 2nd Edition, Saunders College Publishing, Philadelphia.
- Drexel, J.F. and Preiss, W.V. (1995) The Geology of South Australia, Vol. 2, The Phanerozoic.
- Love, A.J. (1991) Groundwater Flow Systems: Past and Present, Gambier Embayment, Otway Basin, South-East Australia. Ph.D. Thesis, Flinders University of South Australia, Adelaide.
- Lawson, J.S. (2013) Water Quality and Movement of the Unconfined and Confined Aquifers in the Capture Zone of the Blue Lake, Mount Gambier, South Australia and Implications for Their Management. Master’s Thesis (Unpublished), The University of South Australia, South Australia.
- Li, Q., McGowran, B. and White, M.R. (2000) Sequences and Biofacies Packages in the Mid-Cenozoic Gam-Bier Limestone, South Australia: Reappraisal of Foraminiferal Evidence. Australian Journal of Earth Sciences, 47, 955-970. http://dx.doi.org/10.1046/j.1440-0952.2000.00824.x
- Vail, J. (2011) Groundwater Sampling, U.S. Environmental Protection Agency, Science and Ecosystem Support Division, Athens, Georgia.
- Eco Environmental (2013) Salinity Sonde, Environmental Monitoring and Sampling Equipment.http://ecoenvironmental.com.au
- EPA (2007) EPA Guidelines for Stormwater Management in Mount Gambier. Environment Protection Authority, South Australia.
- Somaratne, N. (2012) Pitfalls in the Application of the Chloride Mass Balance Method to Groundwater Basins Dominated by Point Recharge. SA Water Hydrogeological Research Report, SA Water/2012/1 (Unpublished).
- Hutton, J.T. (1976) Chloride in Rainwater in Relation to Distance from Ocean. Search, 7, 207-208.
- Nguyen, K. (2013) Estimating the Annual Storm Water Yield in the Blue Lake Capture Zone, South Australia. M. Eng thesis, Unpublished, University of South Australia, South Australia.
- MUSIC Development Team (2009) Model for Urban Stormwater Improvement Conceptualization (MUSIC). eWater CRC.
- Mustafa, S. and Lawson, J.S. (2002) Review of Tertiary Aquifer Properties, Gambier Limestone, Lower Southeast, South Australia. Department of Water, Land and Biodiversity Conservation, Report DWLBC 2002/24, Adelaide.
- Sacks, L.A., Herman, J.S., Konikow, L.F. and Vela, A.L. (1992) Seasonal Dynamics of Groundwater-Lake Interactions of Donana National Park, Spain. Journal of Hydrology, 136, 123-154. http://dx.doi.org/10.1016/0022-1694(92)90008-J
- Appelo, C.A.J. and Postma, D. (2007) Geochemistry, Groundwater and Pollution. 2nd Edition, A.A. Balkema Publishers, Leiden.
- Vanderzalm, J.L., Dillon, P.J., Page, D., Marvanek, S., Lamontagne, S., Cook, P., King, H., Dighton, J., Sherman, B. and Adams, L. (2009) Protecting the Blue Lake from Land Use Impacts. CSIRO Water for a Healthy Country National Research Flagship.
- Vanderzalm, J.L., Dillon, P.J., Hancock, G.J., Leslie, C., Dighton, J., Smith, C. and Pearce, G. (2013) Using Elemental Profiles in the Sediment of a Lake Used to Supply Drinking Water to Understand the Impacts of Urban Storm Water Recharge. Marine and Fresh Water Research, CSIRO Publishing. http://www.publish.csiro.au/?paper=MF12215
NOTES

*Corresponding author.