Journal of Water Resource and Protection
Vol.5 No.8A(2013), Article ID:35681,7 pages DOI:10.4236/jwarp.2013.58A004
Importance of Bromine-Substituted DBP’s in Drinking Water
Water Resources Research Center, University of Missouri-Columbia, Columbia, USA
Email: *clevengert@missouri.edu
Copyright © 2013 Lisa Wulff et al. This is an open access article distributed under the Creative Commons Attribution License, which permits unrestricted use, distribution, and reproduction in any medium, provided the original work is properly cited.
Received May 29, 2013; revised July 3, 2013; accepted August 6, 2013
Keywords: disinfection by-products; bromine; Missouri River; treatment; chlorination; chloramination
ABSTRACT
Significant fractions of bromine-substituted disinfection byproducts (DBPs)—particularly trihalomethanes (THMs)— have been observed to form during treatment of water from the Missouri River. THM speciation was also noted to follow a seasonal pattern during a 2.5-year period, during which samples were collected multiple times per month. Although some treatment processes were effective at reducing the chloroform formation potential, no treatment used at this utility significantly reduced the formation of the three bromine-substituted THM species. Using chloramination rather than free chlorination for secondary disinfection, however, was effective at limiting increases in the concentration of all four regulated THM species in the distribution system.
1. Introduction
Disinfection byproducts have been a contaminant of concern in drinking water since studies first were published on trihalomethane (THM) occurrence and formation during water treatment in the mid-1970s [1-3]. Information concerning the relationship between exposure to these compounds and an increased likelihood of developing certain types of cancers soon followed [4], and THMs became regulated in US drinking water in 1979 at a concentration of 100 parts per billion (ppb) as the sum of all four THM species (TTHM) [5]. In more recent years, this allowable concentration has first been lowered to 80 ppb [6], and the method for determining compliance with this maximum concentration has been modified to better ensure all water system customers will likely be receiving water that meets this standard [7]. Haloacetic acids have also become regulated at 60 ppb as the sum of the concentrations of five particular species (HAA5) as a part of these regulations.
Although the regulatory strategy in the US and many other countries has only established a limit for TTHM as a group, studies have suggested that individual THM species pose varying degrees and types of health risks. Based on this information, the World Health Organization has suggested guidelines for maximum allowable concentrations of individual THM species [8]; although meeting these guideline values could potentially allow for greater TTHM concentrations than current US regulations, it is an acknowledgement that all THM species do not have the same effect on the human body. Cancer potency factors determined by the US EPA indicate that, at minimum, exposure to bromodichloromethane (BDCM) or dibromochloromethane (DBCM) poses an order of magnitude greater risk to human health than does chloroform; bromoform exposure presents a similar risk to that of chloroform [9]. An estimation of the relative risks that would be posed by concentrations of bromine-substituted HAAs, however, is less straightforward. HAA5 regulations include only two of the possible brominesubstituted HAA species: monobromoacetic acid (MBAA) and dibromoacetic acid (DBAA). Monochloroacetic acid (MCAA), dichloroacetic acid (DCAA), and trichloroacetic acid (TCAA) are also included in the regulation; the latter two of these species, however, are the only HAA species for which a cancer classification has been assigned by the US EPA [10]. Even if no regulatory changes are made, the incorporation of bromide present in source water into formed DBPs can simply affect mass-based TTHM and HAA5 values because of the larger mass of the bromide ion relative to the chloride ion.
Studies have shown that reaction of organics with hypobromous acid (HOBr) occurs at a faster rate than reaction with hypochlorous acid (HOCl) [11,12]; rates of bromination have been found to be approximately an order of magnitude faster than chlorination at pH values applicable to most water treatment operations [13,14]. Even faster relative formation rates have been found in studies using model compounds [15]. Therefore, brominesubstituted THMs and HAAs could be formed more quickly than could their chlorine-substituted counterparts. Bromine-substituted THM formation has also been shown to be less sensitive to temperature than chloroform formation [16], perhaps making such compounds more of a year-round concern.
Bromide has also been observed to preferentially be incorporated into halogenated DBPs to a much greater extent than would be predicted by available bromine/ chlorine ratios in the water [12,17,18]. It was initially suggested by the work of Rook et al. [19] that, in water where both are present in excess concentrations, chlorine more often acts as an oxidant while bromine becomes a halogenating agent; subsequent spectroscopic measurements have supported this theory [13]. This apparent faster halogenation observed with bromine atoms over chlorine atoms is therefore the most likely reason for the preferred bromine substitution observed during the formation of halogenated disinfection byproducts. Conventional treatment processes have been found to increase yields of bromine-substituted THM species [20,21]; this presumably occurs primarily because the bromide ion: TOC ratio is increased by removal of TOC but not bromide during treatment.
Although bromine-substituted THMs may not be a significant regulatory concern at all drinking water utilities, they could potentially represent a significant fraction of TTHM for other utilities using source waters that contain both moderate DOC concentrations and sufficient bromide to yield appreciable concentrations of these DBPs. Bromide in surface water is not an issue confined to water bodies in or near coastal areas; concentrations of bromide have been found to be high enough in some major US inland waterways to yield large fractions of bromine-substituted THMs upon disinfection with free chlorine [22]. Use of a large surface water body such as the Missouri River as a water source may then be associated with higher concentrations of bromine-substituted THM species than is typically observed from other water sources in the central US. A better understanding of how concentrations of bromine-substituted THMs may vary over time in this water could assist in decisionmaking processes to keep these and other water systems in compliance with current and future DBP regulations.
2. Methods and Materials
2.1. Selected Water Treatment Plant Study
As part of a more in-depth study of the changes in bromine substitution over time at a drinking water utility treating exclusively Missouri River water, samples were collected from both the treatment process and the distribution system of Boonville, MO. This system serves approximately 10,000 customers in central Missouri and typically treats an average of 5.7 million L/day, although it has a design capacity of approximately 17.4 million L/day. During the study period, plant operations proceeded as normal so that the effects of typical operation could be observed. Because of the distribution system’s large available storage capacity relative to its customers’ usual daily demands, the treatment process usually only needs to be operated for several hours each day; water in an intermediate stage of treatment at the end of the operating day remains in the basin until treatment operations resume the following day.
Table 1 lists the major process units at this facility and locations from which samples were collected as a part of this study. The multiple sedimentation processes employed during treatment at this facility are a result of plant upgrades that resulted in the availability of additional treatment basins; current operating plans involve use of both these older and newer sets of basins to accomplish desired treatment objectives.
2.1.1. Monitoring
Between January 2007 and June 2009, samples were collected on a weekly basis from several locations within both the treatment process and in the distribution system. In-plant sampling sites were selected to measure the effect of individual treatment processes on THM formation, while distribution system sampling sites were selected with the intent of observing worst-case concentrations of these regulated DBPs in the system. Distribution system locations expected to have long retention times—and therefore high TTHM concentrations—were identified by plant personnel for sample collection. The location that appeared to consistently have the highest concentrations was then selected for data analysis and will be discussed as “the distribution system site” in later sections.
A significant operational change that was made during the study period was a switch from free chlorine to chloramines for secondary (residual) disinfection in late 2007. This change was made to help improve regulatory compliance by limiting formation of TTHM and HAA5 in the distribution system while the treatment process was being examined for other ways of potentially reducing DBP formation. As no free chlorine had been added prior to filtration for the majority of the study period, no significant concentrations of any THM species were present in samples collected prior to this stage of treatment; however, the final stages of treatment included free chlorine addition, which allowed for monitoring the extent of THM formation at two points prior to water entering the
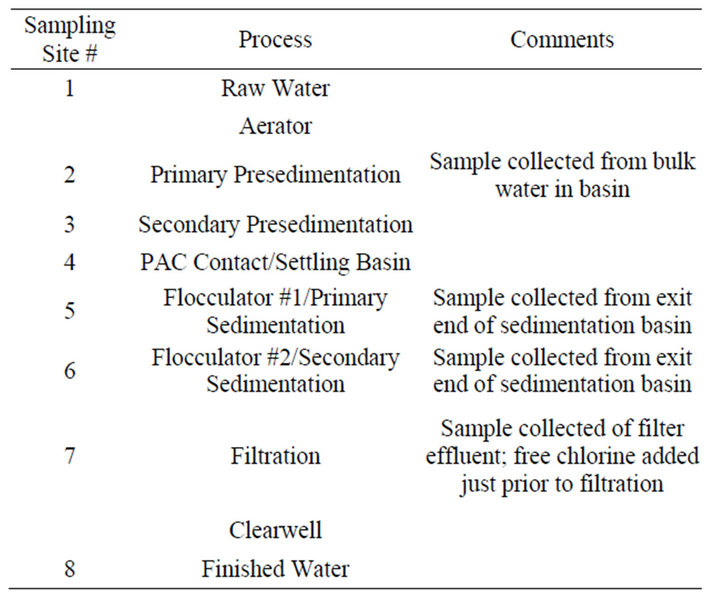
Table 1. Treatment process overview and sample site locations.
distribution system.
2.1.2. Formation Potential
To observe the effectiveness of particular treatment processes at decreasing regulated DBP precursor concentrations, additional water was collected from all in-plant sampling locations listed in Table 1 five times between mid-May and mid-July of 2009 for laboratory analysis of formation potential. Samples were tested for DBP formation potential using the Uniform Formation Conditions (UFC) method given by Summers et al. [16]. This is a measurement of 24-hr formation potential under controlled conditions designed to represent the conditions in an average distribution system. Water was incubated for 24 hours in the dark at 20˚C and pH of 8 with free chlorine added to yield a concentration of 1 mg/L at the end of the incubation period.
2.1.3. Sample Analysis
When obtaining samples to be analyzed for instantaneous DBP concentration, water samples were collected in glass containers at each location. Free chlorine remaining in each sample was then quenched with ammonium chloride (NH4Cl) to yield a concentration in the sample of at least 100 mg/L to inhibit further DBP formation. Samples of chloraminated water were also treated with NH4Cl to ensure no free chlorine remained in the sample. After all samples had been collected, they were transportedback to the laboratory and stored in a refrigerator at 4˚C until analysis within 14 days of sample collection. The same preservation procedure was followed for formation potential tests at the end of the required 24-hour incubation period. THM species concentrations were determined using a Tekmar 3000 purge and trap system, a Varian 3800 gas chromatograph, and a Varian Saturn 2000 mass spectrometer similarly to EPA Method 524.2. Samples were measured for UV254 absorbance following Standard Method 5910 B using a Varian Cary 50 Conc UV-Visible Spectrophotometer.
2.2. Government Agency Database Data
The United States Geological Survey (USGS) maintains a network of surface water flow gauging stations around the US [23]; available data typically include at least daily average flow rates measured. One such gauge station is located in Boonville, MO, near the location where source water is withdrawn from the Missouri River by the municipal utility for treatment. This information allows for determination of whether observed DBP concentrations correlate to the flows recorded in the river.
3. Results and Discussions
3.1. Seasonal Variation in Bromine-Substituted THM Species Concentration
Although the regulatory compliance data discussed previously is collected seasonally, it is limited to information collected during only four sampling events each year. To better be able to conclude any seasonal variation noticed is truly reflective of seasonal changes, samples were collected on a weekly basis for analysis of quarterly trends. In this analysis, results were grouped into threemonth intervals corresponding to each regulatory compliance period as shown in Figure 1. For comparison, the USGS data for Missouri River flow rate was also examined on a quarterly basis over the period of seasonal data collection to determine the extent of any relationship between these parameters.
Because of modifications to the utility’s secondary disinfection method in late 2007 to limit further THM formation in the distribution system (Figure 2), a comparison of THM speciation over the entire study period is not possible using distribution-system water samples. However, finished water entering the distribution system has been subjected to the same free-chlorine contact time throughout the period and is therefore a suitable substitute. In the corresponding regulatory compliance data, THM species concentrations have appeared stable over this time interval; therefore, it is likely that any changes observed are reflective of short-term fluctuations in source water quality or typical seasonal changes in treatment process operation.
Different trends between chloroform, BDCM, and combined DBCM/bromoform concentrations are also apparent on a seasonal basis in this water system. BDCM remains relatively constant throughout the year, with perhaps only small increases in the July-September interval when temperatures are highest and promote increased THM formation overall. Chloroform and DBCM/
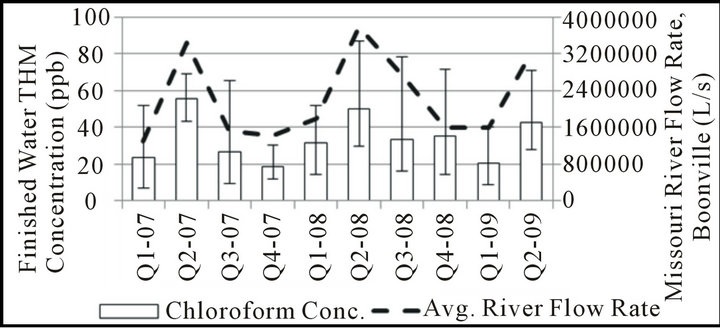
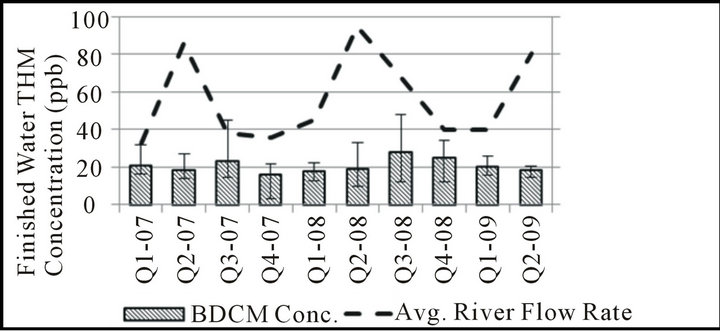
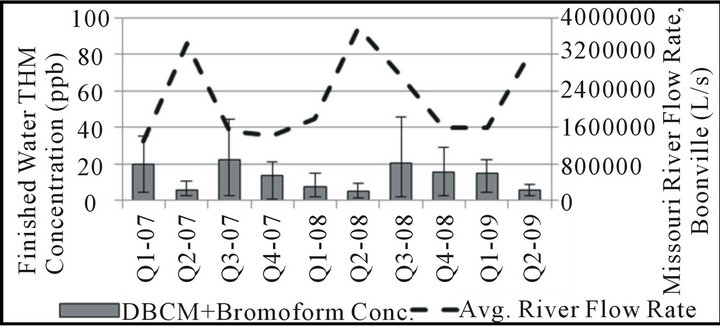
Figure 1. Seasonal THM speciation, finished water.
romoform concentrations follow opposite trends during the 2nd and 3rd quarters, with the 2nd quarter typically representing the highest concentrations of chloroform and lowest concentrations of DBCM/bromoform in the entire year. As shown in Figure 2, the months of the year in which river flow rate is typically highest tend to have the lowest fraction of bromine-substituted THM species. This apparent relationship is consistent with observations made using regulatory compliance data.
It is possible that the bromide found in the Missouri River results from a relatively consistent groundwater input year round, and that the higher volumes of surface runoff found in the river during the spring would then dilute bromide concentrations during this time of year. Although some seasonal variation in source-water bromide concentration may exist, many have noted a much higher substitution efficiency of the bromide ion over the chloride ion [12,13,18,19] such that even low bromide levels may be adequate to yield bromine-substituted THMs. The THM speciation pattern observed may also reflect either a change in organic precursor reactivity and/or quantity relative to available bromide; a seasonal change in organic precursors would also be consistent with the results of studies in other water systems [24-26] .
Measurement of changes in THM precursor quantity
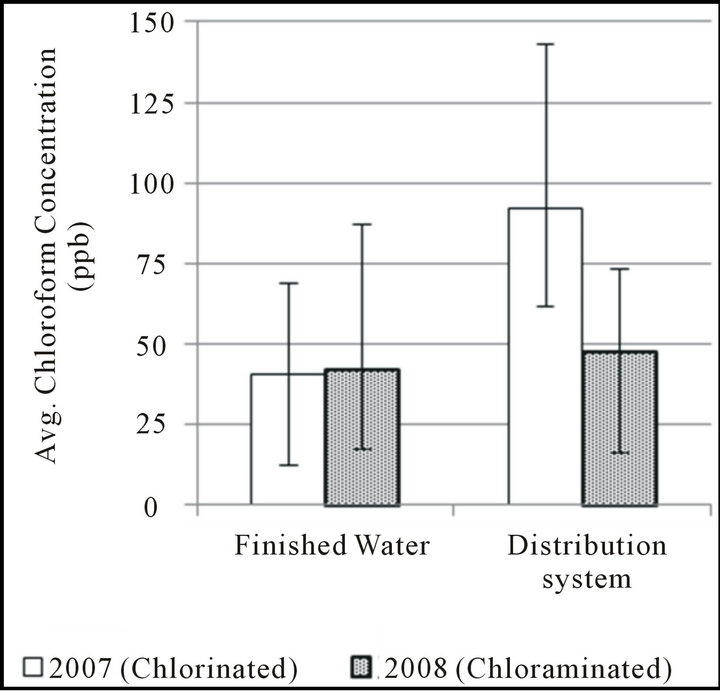
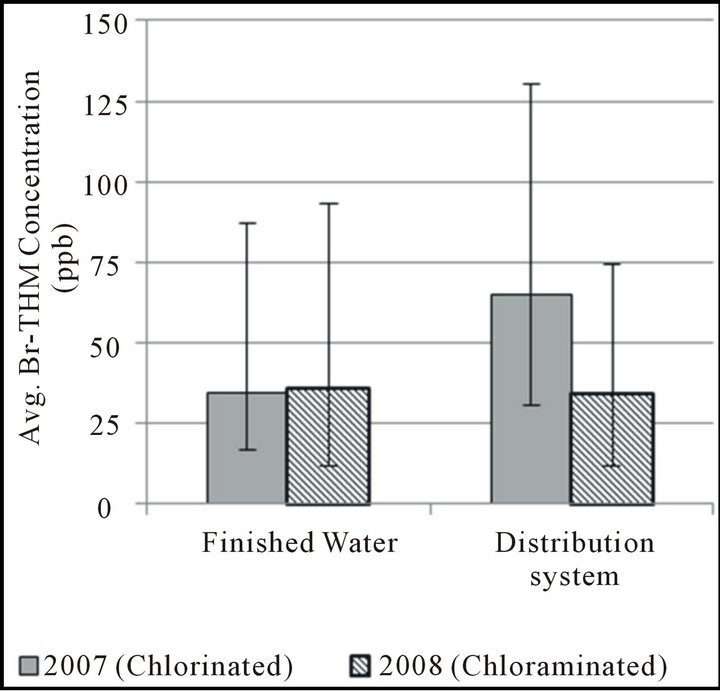
Figure 2. THM formation during distribution, april-september.
and/or type can be measured through a comparison of UV254 absorbance values. Although UV254 absorbance was noted to be consistently reduced by treatment (see Figure 3), no clear seasonal trends appeared in raw or treated water samples to indicate a large shift in precursor characteristics as an explanation for the observed changes in speciation. Correlations between UV254 absorbance and THM species formation in finished water were also found to be relatively weak in this water system, with no seasonal effects on relationship effectiveness. If bromine is reactive with more aliphatic/drophilic structures whereas chlorine may be more reactive with more aromatic/hydrophobic structures as the collective results of some studies seem to suggest [27-29], a lack of observed relationship between concentrations of bromine-substituted THM species and a parameter that primarily measures aromatic organic properties would be expected. A more detailed examination of seasonal changes in organic DBP precursors in the Missouri River would be needed to more fully understand the reasons for
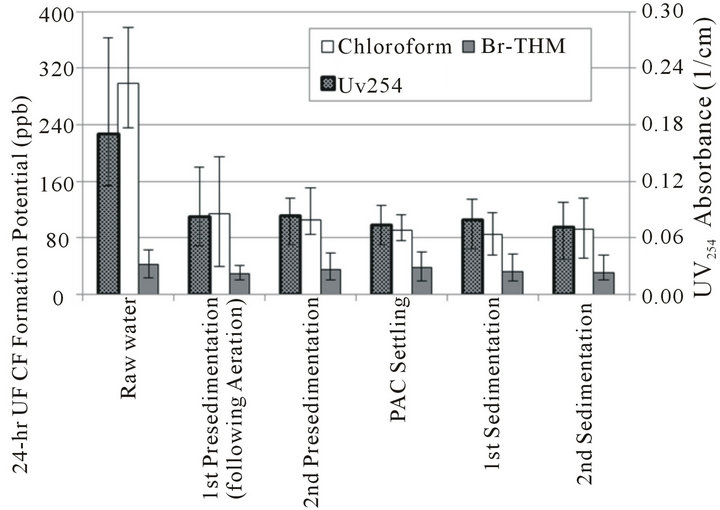
Figure 3. Formation potential through treatment, chloroform vs. Br-THM.
the observed seasonal changes in THM speciation.
3.2. Effects of Water Treatment and Distribution on THM Speciation
3.2.1. Impact of Treatment Processes on THM Speciation
To observe the effect of treatment processes on the formation of chloroform and bromine-substituted THM species prior to any chlorine addition, a 24-hour formation potential test was conducted on water collected from major treatment processes at the Boonville, MO water treatment plant between May and July 2009 according to the UFC protocol outlined by Summers et al. [16]. A summary of the results is given in Figure 3, showing all three bromine-substituted THMs collectively as Br-THM. These results show that a significant decrease in TTHM precursor concentrations is achieved by the initial aeration and sedimentation processes at this facility, but that the majority of the observed decrease in THM formation potential results from a decrease in chloroform potential. A similar overall ineffectiveness of treatment processes on the formation potential of bromine-substituted THM species was recently noted in another facility by Farré et al. [30]
A fraction of the total organic molecules present in source water—particularly more-hydrophobic molecules—should be removed by these conventional water treatment processes; in contrast, bromide in source water is considered conservative in such processes. Furthermore, it has been shown that in at least some cases that the smaller [31] or aliphatic [28,32] organic molecules which can be more difficult to remove during water treatment may also be more susceptible to bromination. Conversely, a slight preference for chloroform formation over bromine-substituted THM formation has previously been noted with some model aromatic compounds [29]. However, it is also possible that the limitation on Br-THM formation is the concentration of bromine available to react with THM precursors such that a reasonably similar concentration of Br-THM would be expected to form regardless of the nature of the precursors remaining in solution. Whether the observed larger decrease in chloroform formation vs. bromine-substituted THM species formation is a result of the types of precursors actually being removed by treatment or results from a limited supply of HOBr cannot fully be explained without more detailed study. These experimental results do illustrate that decreasing the formation of bromine-substituted THM species is less straightforward for a utility than decreasing chloroform formation. Systems that typically have bromide present in source water may have more difficulty meeting current mass-based TTHM regulations due to the higher molecular weights of Br-THM species relative to chloroform.
3.2.2. Control of Chloroform and Bromine-Substituted THM Formation in Distribution System by Chloramination
THM concentrations in finished water and the selected worst-case distribution system site in the distribution system of Boonville, MO are shown in Figure 2. Generally, DBP formation is greatest during warmer months due to the increased temperatures and increased organic precursor availability; for this reason, data from AprilSeptember (finished water temperature generally >15˚C) from both 2007 and 2008 were selected for comparison. In all cases, free chlorine has been added as water enters the final filtration step preceding disinfection contact time. In late fall 2007, the utility began also adding ammonia to finished water to form a chloraminated residual in its distribution system; therefore, data collected from the same season in 2008 should be representative of these new conditions. Because of similarities in their formation patterns over the long reaction times found in the distribution system, data for the three bromine-substituted THM species are again expressed as Br-THM, the sum of these three compounds.
When comparing finished water and distribution system samples from the time period in which free chlorine was used as the disinfectant, it can be seen that concentrations of both chloroform and the group of brominesubstituted THMs increases during distribution. However, the average concentration of chloroform was observed to increase by 126% while the average for bromine-substituted THMs only increased by 87%. A larger increase in chloroform concentration than in bromine-substituted THM concentration might be expected based on the faster reaction rate for THM precursors with HOBr observed in laboratory studies; however, it is worth noting that the formation of bromine-containing THMs still appears far from complete after a few hours of free-chlorine contact time when water enters the distribution system.
For both chloroform and the group of bromine-substituted THMs, chloramination appeared to be effective at limiting additional THM formation in the distribution system; on average, chloroform increased by 14% while Br-THM increased by only 5% when the distribution system was chloraminated. The results of several studies have shown monochloramine to be effective at limiting TTHM formation overall [33-36], although a study by Hua and Reckhow [37] indicates that this effectiveness may decrease slightly with increased bromine substitution. However, this decreased effectiveness may only occur under very high bromide concentrations.
In this study, both chloroform and Br-THM show little to no increase during distribution while the distribution system is chloraminated. During this period of study, finished water DBCM concentrations were frequently at or below 10 ppb and bromoform generally less than 5 ppb; therefore, the effects of any less-limited formation of these compounds may not have been of enough significance to be detected.
4. Conclusions
Chloramination appears to be equally effective at limiting additional formation of both chloroform and bromine-substituted THMs in the utility’s distribution system. Formation potential results show that the initial treatment processes of aeration and sedimentation do reduce TTHM formation; however, the decrease predominantly is a reduction in chloroform. Because the conventional treatment processes used at the facility would not be expected to remove bromide found in source water, the observed increase in the fraction of bromine-substituted THMs as water moves through treatment would be expected.
Variations in the THM species distribution were observed on a seasonal basis. Although limited data were available to characterize source water quality over a several-year period, an examination of the data collected for regulatory compliance determination showed that chloroform concentrations tended to be lower while DBCM and bromoform concentrations increased during periods of lower river flow rate. BDCM concentrations remained relatively independent of river flow rate; this is presumably due to at least sufficient bromide in the river at all times to easily support substitution of only one bromine atom during THM formation.
5. Acknowledgements
Funding for this project was provided by the US EPA office of ground water and drinking water. This study has not been subjected to EPA administrative review and may not reflect the view of the agency; no official endorsement should be inferred.
REFERENCES
- T. A. Bellar, J. J. Lichtenberg and R. C. Kroner, “The Occurrence of Organohalides in Chlorinated Drinking Waters,” Journal (American Water Works Association), Vol. 66, No. 12, 1974, pp. 703-706.
- J. J. Rook, “Formation of Haloforms during Chlorination of Natural Waters,” Water Treatment and Examination, Vol. 23, 1974, pp. 234-243.
- W. W. Bunn, B. B. Haas, E. R. Deane and R. D. Kleopfer, “Formation of Trihalomethanes by Chlorination of Surface Water,” Environmental Letters, Vol. 10, No. 3, 1975, pp. 205-213. doi:10.1080/00139307509435822
- National Cancer Institute, “Report on the Carcinogenesis Bioassay of Chloroform,” National Cancer Institute: Bethesda, 1976.
- US Environmental Protection Agency, “National Interim Primary Drinking Water Regulations: Control of Trihalomethanes in Drinking Water,” Federal Register, Vol. 44, No. 231, 1979, pp. 68624-68632.
- US Environmental Protection Agency, “National Primary Drinking Water Regulations: Disinfectants and Disinfection Byproducts,” Federal Register, Vol. 63, No. 241, 1998, pp. 69390-69476.
- US Environmental Protection Agency, “National Primary Drinking Water Regulations: Stage 2 Disinfectants and Disinfection Byproducts Rule,” Federal Register, Vol. 71, No. 2, 2006, pp. 388-493.
- World Health Organization, “Guidelines for Drinking Water Quality,” 3rd Edition, World Health Organization, Geneva, 2008.
- US Environmental Protection Agency, “Drinking Water; National Primary Drinking Water Regulations: Disinfectants and Disinfection Byproducts,” Federal Register, Vol. 59, No. 145, 1994, pp. 38668-38829.
- R. M. Clark and B. K. Boutin, “Controlling Disinfection By-Products and Microbial Contaminants in Drinking Water,” National Risk Management Research Laboratory, Office of Research and Development, Cincinnati, 2001.
- J. M. Symons, S. W. Krasner, L. A. Simms and M. Sclimenti, “Measurement of THM and Precursor Concentrations Revisited: The Effect of Bromide Ion,” Journal (American Water Works Association), Vol. 85, No. 1, 1993, pp. 51-62.
- C. J. Nokes, E. Fenton and C. J. Randall, “Modeling the Formation of Brominated Trihalomethanes in Chlorinated Drinking Waters,” Water Research, Vol. 33, No. 17, 1999, pp. 3557-3568. doi:10.1016/S0043-1354(99)00081-0
- P. Westerhoff, P. Chao and H. Mash, “Reactivity of Natural Organic Matter with Aqueous Chlorine and Bromine,” Water Research, Vol. 38, No. 6, 2004, pp. 1502- 1513. doi:10.1016/j.watres.2003.12.014
- G. Hua, D. A. Reckhow and J. Kim, “Effect of Bromide and Iodide Ions on the Formation and Speciation of Disinfection Byproducts during Chlorination,” Environmental Science & Technology, Vol. 40, No. 9, 2006, pp. 3050-3056. doi:10.1021/es0519278
- J. L. Acero, P. Piriou and U. von Gunten, “Kinetics and Mechanisms of Formation of Bromophenols during Drinking Water Chlorination: Assessment of Taste and Odor Development,” Water Research, Vol. 39, No. 13, 2005, pp. 2979-2993. doi:10.1016/j.watres.2005.04.055
- R. S. Summers, S. M. Hooper, H. M. Shukairy, G. Solarik and D. Owen, “Assessing DBP Yield: Uniform Formation Conditions,” Journal (American Water Works Association), Vol. 88, No. 6, 1996, pp. 80-93.
- H. Pourmoghaddas, A. A. Stevens, R. N. Kinman, R. C. Dressman, L. A. Moore and J. C. Ireland, “Effect of Bromide Ion on Formation of HAAs During Chlorination,” Journal (American Water Works Association), Vol. 85, No. 1, 1993, pp. 82-87.
- B. G. Oliver, “Effect of Temperature, pH, and Bromide Concentration of the Trihalomethane Reaction of Chlorine with Aquatic Humic Material,” In: R. L. Jolley, W. A. Brungs and R. B. Cumming, Eds., Water Chlorination: Environmental Impact and Health Effects, Ann Arbor Science, Inc., Ann Arbor, 1980, pp. 141-149.
- J. J. Rook, A. A. Gras, B. G. van der Heijden and J. de Wee, “Bromide Oxidation and Organic Substitution in Water Treatment,” Journal of Environmental Science and Health, Part A, Vol. 13, No. 2, 1978, pp. 91-116. doi:10.1080/10934527809374796
- Y. C. Soh, R. Roddick and J. van Leeuwen, “The Impact of Alum Coagulation of the Character, Biodegradability, and Disinfection By-Product Formation Potential of Reservoir Natural Organic Matter (NOM) Fractions,” Water Science and Technology, Vol. 28, No. 6, 2008, pp. 1173- 1179.
- D. Gang, T. E. Clevenger and S. K. Banerji, “Effects of Alum Coagulation on Speciation and Distribution of Trihalomethanes (THMs) and Haloacetic Acids (HAAs),” Journal of Environmental Science and Health, Part A: Toxic/Hazardous Substances & Environmental Engineering, Vol. 40, No. 3, 2005, pp. 521-534. doi:10.1081/ESE-200046555
- R. E. Rathbun, “Speciation of Trihalomethane Mixtures for the Mississippi, Missouri, and Ohio Rivers,” Science of the Total Environment, Vol. 180, No. 2, 1996, pp. 125-135. doi:10.1016/0048-9697(95)04938-X
- US Geological Survey, “Surface-Water Data for the Nation,” 2012. http://waterdata.usgs.gov/nwis/sw
- R. C. Hoehn, C. W. Randall, F. A. Bell and P. T. B. Shaffer, “Trihalomethanes and Viruses in a Water Supply,” Journal of Environmental Engineering Division ASCE, Vol. 103, No. EE5, 1977, pp. 803-814.
- M. D. Arguello, C. D. Chriswell, J. S. Fritz, L. D. Kissinger, K. W. Lee, J. J. Richard and H. J. Svec, “Trihalomethanes in Water: A Report on the Occurrence, Seasonal Variation in Concentrations, and Precursors of Trihalomethanes,” Journal (American Water Works Association), Vol. 71, No. 9, 1979, pp. 504-508.
- J. N. Veenstra and J. L. Schnoor, “Seasonal Variations in Trihalomethane Levels in an Iowa River Water Supply,” Journal (American Water Works Association), Vol. 72, No. 10, 1980, pp. 583-590.
- L. Liang and P. C. Singer, “Factors Influencing the Formation and Relative Distribution of Haloacetic Acids and Trihalomethanes in Drinking Water,” Environmental Science & Technology, Vol. 37, No. 13, 2003, pp. 2920- 2928. doi:10.1021/es026230q
- L. Heller-Grossman, J. Manka, B. Limoni-Relis and M. Rebhun, “Formation and Distribution of Haloacetic Acids, THM and TOX in Chlorination of Bromide-Rich Lake Water,” Water Research, Vol. 27, No. 8, 1993, pp. 1323- 1331. doi:10.1016/0043-1354(93)90219-8
- S. D. Boyce and J. F. Hornig, “Reaction Pathways of Trihalomethane Formation from the Halogenation of Dihydroxyaromatic Model Compounds for Humic Acid,” Environmental Science & Technology, Vol. 17, No. 4, 1983, pp. 202-211.
- M. J. Farré, J. Reungoat, F. X. Argaud, M. Rattier, J. Keller and W. Gernjak, “Fate of N-Nitrosodimethylamine, Trihalomethane and Haloacetic Acid Precursors in Tertiary Treatment Including Biofiltration,” Water Research, Vol. 45, No. 17, 2011, pp. 5695-5704. doi:10.1021/es60157a014
- J. L. Schnoor, J. L. Nitzschke, R. D. Lucas and J. N. Veenstra, “Trihalomethane Yields as a Function of Precursor Molecular Weight,” Environmental Science & Technology, Vol. 13, No. 9, 1979, pp. 1134-1138.
- P. C. Singer, H. S. Weinberg, K. Brophy, L. Liang, M. Roberts, I. Grisstede, S. Krasner, H. Baribeau, H. Arora and I. Najm, “Relative Dominance of Haloacetic Acids and Trihalomethanes in Treated Drinking Water,” Awwa Research Foundation/American Water Works Association, Denver, 2002.
- T. S. Norman, L. L. Harms and R. W. Looyenga, “The Use of Chloramines to Prevent Trihalomethane Formation,” J. AWWA, Vol. 72, No. 3, 1980, pp. 176-180.
- S. A. Hubbs, D. Amundsen and P. Olthius, “Use of Chlorine Dioxide, Chloramines, and Short-term Free Chlorination as Alternative Disinfectants,” Journal (American Water Works Association), Vol. 73, No. 2, 1981, pp. 97- 101.
- G. Hua and D. A. Reckhow, “DBP Formation during Chlorination and Chloramination: Effect of Reaction Time, pH, Dosage and Temperature,” Journal (American Water Works Association), Vol. 100, No. 8, 2008, pp. 82-95. doi:10.1016/j.jhazmat.2008.05.058
- J. Lu, T. Zhang, J. Ma and Z. Chen, “Evaluation of Disinfection By-Products Formation during Chlorination and Chloramination of Dissolved Natural Organic Matter Fractions Isolated from a Filtered River Water,” Journal of Hazardous Materials, Vol. 162, No. 1, 2009, pp. 140- 145. doi:10.1016/j.watres.2007.01.032
- G. Hua and D. A. Reckhow, “Comparison of Disinfection Byproduct Formation from Chlorine and Alternative Disinfectants,” Water Research, Vol. 41, No. 8, 2007, pp. 1667-1678.
NOTES
*Corresponding author.