Journal of Water Resource and Protection
Vol.5 No.9(2013), Article ID:37325,9 pages DOI:10.4236/jwarp.2013.59088
Boron Removal by Electrocoagulation Using Full Factorial Design
UR11ES17 Traitement et Dessalement des Eaux, Faculté des Sciences de Tunis, Université de Tunis El Manar, Tunis, Tunisie
Email: *misskawla13@gmail.com
Copyright © 2013 Khaoula Missaoui et al. This is an open access article distributed under the Creative Commons Attribution License, which permits unrestricted use, distribution, and reproduction in any medium, provided the original work is properly cited.
Received April 26, 2013; revised May 28, 2013; accepted June 22, 2013
Keywords: Boron Removal; Electrocoagulation; Full Factorial Design
ABSTRACT
Saline waters treatment has become increasingly important for drinking water supply in a greater part of the world. However, some serious limitations had recently been discovered during water treatment, among them the boron problem seems to have a critical meaning. According to the WHO regulations (2011), the boron concentration should be reduced to less than 2.4 mg/L for drinking water. The purpose of this study is to investigate the feasibility of electrocoagulation (EC) as a pretreatment process to remove boron from saline waters. To optimize the experimental conditions of boron removal, the effects of some parameters were studied such as inter-electrode distance (die), electrode connection mode, (S/V) ratio, pHi and initial conductivity of the solution (si). Subsequently, an experimental design methodology was implemented to evaluate statistically the most significant operating parameters. The effects of current density, EC time and initial boron concentration and their mutual interaction were investigated using 23 full factorial design. At optimal conditions, boron removal from synthetic aqueous solutions containing initial boron concentrations of 5 and 50 mg/L reached 81% and 79%, respectively. Applied to boron removal from seawater samples, EC reduces boron concentration to less to 2.4 mg/L with excessive energy consumption under optimal parameters.
1. Introduction
Boron is an element that naturally occurs throughout the environment. It can be found mainly in the form of boric acid or borate salts. Boron is widely distributed in surface and ground waters mainly in the form of boric acid or borate salts depending on the pH of the water [1]. When the acid dissociation constant of boric acid (at 25˚C; pka = 9.24) is considered, it can be predicted that H3BO3 is the predominant form at neutral and low pHs whereas B(OH)4 is expected to be present at high pHs [2].
Naturally occurring boron is present in groundwater primarily as a result of leaching from rocks and soils containing borates and borosilicates. Concentrations of boron vary widely and depend on the surrounding geology and wastewater discharges. The majority of Earth’s boron occurs in the oceans, with an average concentration of 4.5 mg/L [3].
Generally, boron has been found to have a dual effect on the living systems on Earth. In the case of plants, the effect of boron has the unambiguous meaning. It was shown that there is a small range difference between boron deficiency and boron toxicity levels. There are some plants that are more sensitive to boron than others [4]. A very low boron content is required in irrigation water for certain metabolic activities, but if its concentration is only slightly higher, plant growth will exhibit effects of boron poisoning, which are yellowish spots on the leaves and fruits, accelerated decay and ultimately plant expiration. Sensitive plants can tolerate irrigation waters with only 0.3 mg/L boron, while very tolerant plants may be able to survive for 4 mg/L of boron concentration [5]. High boron levels in drinking water can be toxic to humans as boron has been shown to cause male reproductive impediments in laboratory animals [6]. Boron has virulence for reproduction and causes disease of the nervous system.
The World Health Organization for many years had recommended the drinking water limits for boron as low as 0.5 mg/L. Lately, the Expert Group on Guidelines for Desalination recommended that the guideline for boron should be reconsidered in the light of new thinking on the toxicity, as boron levels are quite high in seawater and boron removal is difficult [7]. Therefore, the DrinkingWater Quality Committee, at its meeting of 9-13 November 2009, recommended revising the Boron Guideline Value to 2.4 mg/L. The revised Guideline Value was incorporated into the Guidelines for Drinking-Water Quality, 4th Edition, that was published in 2011 [8].
As the requirement for fresh water increases worldwide, there is a need for implementation of more advanced technologies that are able to treat non-conventional water sources. Such chance we note for seawater that has become an important non-conventional source of water in many arid regions. However, seawater contains approximately 5 - 6 mg/L of boron [4].
In order to prevent the environmental problems of high concentration of boron in waters, their boron contents should be removed by a suitable method. There is no easy method for removing boric acid and borates from aqueous solution. As has already been stated in the literature [2], conventional water treatment (coagulation, sedimentation, filtration) does not significantly remove boron, and special methods need to be used in order to remove high boron concentrations. Besides, ion exchange and reverse osmosis processes may enable substantial reduction but are likely to be prohibitively expensive [8]. Electrochemical technology contributes in many ways to a cleaner environment and covers a very broad range of technology [9,10]. Electrocoagulation (EC) is an efficient method used for treating various process effluents and investigated as a new technology for boron [10,11].
In an electrocoagulation (EC) process, no addition of chemicals is necessarily needed. Small volume of sludge is produced, comparing with that in classical chemical process, which can be easily removed by decantation. EC involves the generation of coagulants in situ by dissolving electrically either aluminum or iron ions from, respectively, aluminum or iron electrodes. The metal ion generation takes place at the anode; hydrogen gas is released from the cathode. EC is a complex process occurring via serial steps such as electrolytic reactions at electrode surfaces, formation of coagulants in aqueous phase, adsorption of soluble or colloidal pollutants on coagulants which are removed by sedimentation or flotation [11]. The most widely used electrode materials in EC process are aluminum and iron. In the case of aluminum, main reactions are as:
• At the anode:
![]() (1)
(1)
• At the cathode:
 (2)
(2)
Al3+ and OH− ions generated by electrode reactions (1) and (2) react to form various monomeric species such as ;
; ;
; ;
;  and polymeric species such as
 ;
; ;
; ;
; ;
;  which transform finally into
  according to complex precipitation kinetics [10].
![]() (3)
(3)
Freshly formed amorphous  “sweep flocks” have a large surface area which is beneficial for a rapid adsorption of soluble organic compounds and trapping of colloidal particles. Finally, these flocks are removed easily from aqueous medium by sedimentation or H2 flotation [11].
The aim of the present study was to optimize the experimental conditions of boron removal by EC, such as inter-electrode distance (die), electrode connection mode, (S/V) ratio, pHi and initial conductivity of the solution (si). Consequently, an experimental design methodology, 23 full factorial, was used to investigate the influence of the principal experimental parameters (current density, EC time and initial boron concentration). Lastly the effectiveness of EC treatment for boron removal from seawater samples was evaluated.
2. Material and Methods
2.1. Analytical Methods
Molecular Absorption Spectrometry in the UV-visible range using Azomethine-H as a colorimetric reagent according to the procedure of López et al. [12] was used for boron analysis. Azomethine-H is not considered a standardised reagent for boron analysis in waters. However, it has been selected owing to its simplicity and competitiveness over other spectrophotometric reagents, according to Fuente and Munoz [13]. Boron concentrations were obtained by absorbance measurement at a wave length of 420 nm [14].
2.2. Electrocoagulation Test
A laboratory-scale reactor used to conduct EC experiments was a beaker with a working volume of about 1 L. Electrode assembly is the heart of the present treatment facility. Two groups of alternating electrodes being cathode and anode, made from plates of aluminum with dimensions of (18 - 8 - 0.02 cm) were arranged vertically. The immerged active surface of each electrode was Sa = 176 cm2. The electrodes assembly was connected to DC power supply (elc AL 924A) providing current and voltage in the range of 0 - 10 A and 0 - 30 V. A gentle magnetic stirring rate of about 200 rpm was applied to the electrolyte in all tests. Electrolyte volume used was 1 L. All experiments were performed at around 25˚C and were triplicated. Electrocoagulation unit is schematically shown in Figure 1.
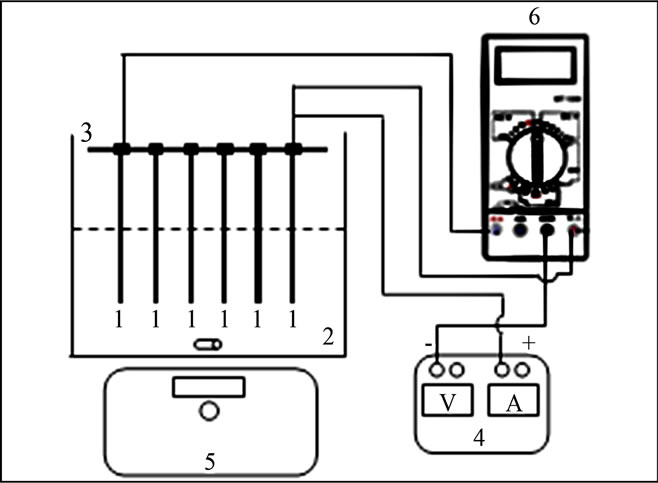
Figure 1. Schematic diagram of electrocoagultion unit, ((1) aluminium electrodes; (2) treated solution; (3) electrodes support; (4) DC power supply; (5) magnetic stirrer; (6) multimmeter).
Before the EC test and in order to avoid any interference and ensure surface reproducibility, electrodes were prepared as follows:
• Mechanically polished underwater with abrasive paper• Cleaned in NaOH solution (2 mol/L) for 2 min• Rinsed with distilled water• Cleaned in HCl solution (2 mol/L) for 2 min• Rinsed with distilled water• Dried with absorptive paper.
The initial pH of the solutions was adjusted by adding either HCl (0.1 mol/L) or NaOH (0.1 mol/L). NaCl was used as supporting electrolyte to adjust the initial conductivity of the solution. For each experiment, the residual boron concentrations in the samples filtered through 0.45 micron filter paper (Millipore) were determined. The percentage of boron removed (%B) is given as:
 (4)
(4)
Where  and
and  are the initial and residual boron concentration in the solution.
3. Results and Discussion
Operating parameters such as inter-electrode distance (die), electrode connection mode, the (S/V) ratio: surface area on solution volume, pH and conductivity of the solution (si) were optimized for an initial boron concentration of 5 mg /L.
3.1. Optimal Inter-Electrode Distance Determination
Several tests were first performed to understand how EC efficiency varies with inter-electrode distance. Boron removal efficiency and energy consumption was examined for inter-electrode distance ranged from 1.0 to 7.0 cm. The effect of inter-electrode distance on the boron removal efficiency is shown in Figure 2.
When the inter-electrode distance decreases, the boron removal efficiency increases slightly. The increasing of boron removal in the less distance is probably resulting from the increase of electrostatic interactions [15].
Furthermore, in an electrochemical process, the most important economical parameter is energy consumption W (kWh/m3). This parameter is calculated from the following expression:
 (5)
(5)
where U is the applied tension (V), I is the current intensity (A), tEC is the time of EC (s) and V is the volume (m3) of boron solution.
Applied tension could be explained with the following equation:
 (6)
(6)
where R is the resistance (Ohm).
From Equations (5) and (6), the following equation could be obtained:
 (7)
(7)
Inter-electrode distance has an effect on the amount of electrical energy introduced into the system to generate an electric field and induce motion of ions [16].
Figure 3 depicts the evolution of the energy consumption vs. inter-electrode distance. Globally, energy consumption increases with inter-electrode distance. This could be explained by the increase of the solution resistance, according to the following expression:
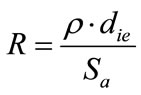 (8)
(8)
where r is the resistivity (Ohm cm), die is the inter-electrode distance (cm) and Sa is the total active surface (cm2).
Obtained results showed that the highest boron removal with the lowest energy consumption was reached for die = 1 cm. Therefore, all EC experiments were conducted at optimal die = 1 cm.
3.2. Optimal (S/V) Ratio and Electrode Connection Mode Determination
The (S/V) ratio defined by the total active surface of electrodes divided by the volume of treated solution (or the number of pair of electrodes) and electrode connection mode are among the factors that may greatly influence the effectiveness of EC process. In order to improve the boron removal, the number of pair of electrodes was investigated under the same current density at
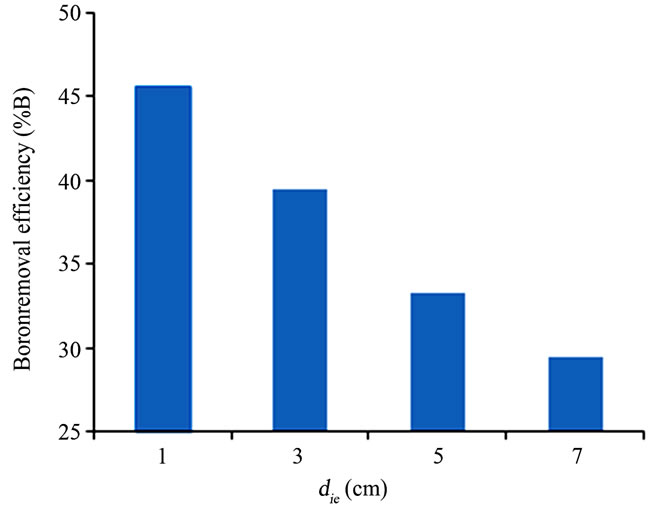
Figure 2. Effect of inter-electrode distance on boron removal %B, (pHi = 8; J = 11.4 mA/cm²; tEC = 30 min and si = 32.5 mS/cm).
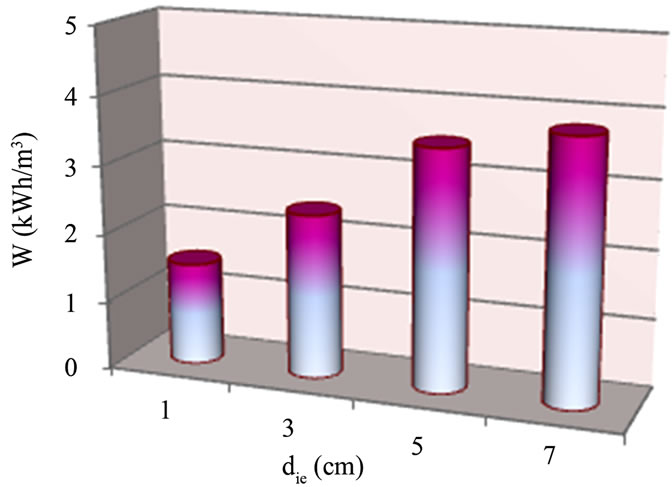
Figure 3. Evaluation of the effect of inter-electrode distance on energy consumption, (pHi = 8; J = 11.4 mA/cm2; tEC = 30 min and si = 32.5 mS/cm).
1; 2 and 3 pair(s) for (S/V) ratio respectively at (17.6; 35.2 and 52.8 m2/m3). Two different electrode connections (mono-polar (M.P) and bi-polar (B.P)) were examined for choosing the better alternative. Schematic diagram of (M.P) and (B.P) electrochemical cell is shown in Figure 4.
It is basic to mention that in the B.P connection (Figures 4(b)-(c)) multiple electrodes were used while only the extreme electrodes are connected to the power supply. Every electrode excluding the electrodes at the end acts as an anode on one side and cathode on the other side. Each adjacent electrode pair acts as single unit. In such condition, induced polarization took place when voltage was applied to the end electrodes so that the inner electrodes started acting as a secondary cells. Therefore, the total assembly was bipolarized with a primary and a secondary cells acting together. Effect of (S/V) ratio and electrode connection mode for the boron removal by EC is shown in Figure 5.
The results confirmed that the (B.P) connection with
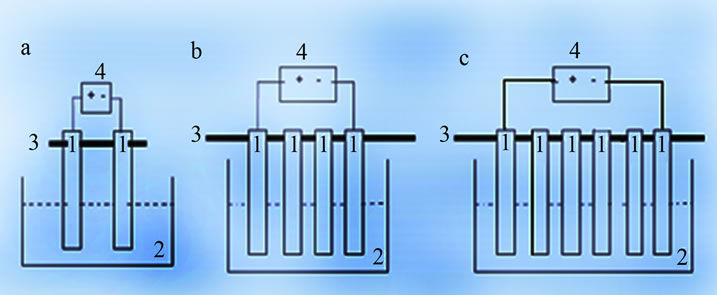
Figure 4. Schematic diagram of electrochemical cell. (a) M.P connection (1 pair); (b) B.P connection (2 pairs) and (c) B.P connection (3 pairs), (1) aluminium electrodes; (2) treated solution; (3) electrode support; and (4) DC power supply.
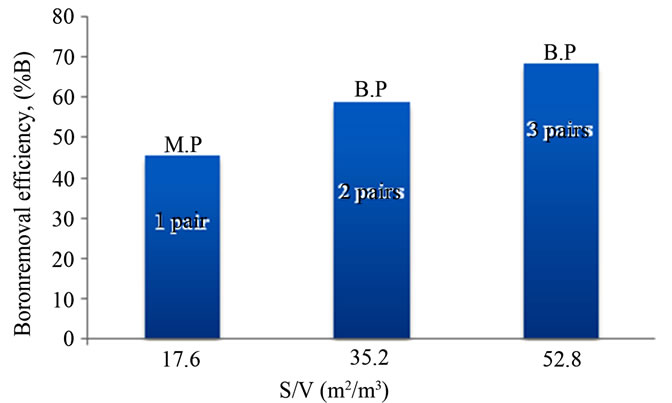
Figure 5. Effect of (S/V) ratio and electrode connection mode on boron removal %B, (pHi = 8; J = 11.4 mA/cm2; tEC = 30 min and si = 32.5 mS/cm).
multiple electrodes can serve better boron removal than the (M.P) connection with two electrodes. In (B.P) connection, several electrochemical cells acted together for which higher surface area compared to that of (M.P) connection favored the adequate anodic oxidation. As a result, with the same current density applied for both kind of connection, the intensity is higher in the bipolar connection. It is also seen from Figure 5 that when the number of pairs of electrodes increases (2 - 3 pairs), and so the (S/V) ratio increases (35.2 - 52.8 m2/m3), boron removal increases. The reason of this observation is thought to be the workable rate of metal dissolution.
According to [17], the use of electrodes with large surface area is required and performance improvement has been achieved by using EC cells either with (M.P) electrodes or with (B.P) electrodes. However, to keep the EC system simple, the electrode plates are usually connected in (B.P) mode [18]. Experimental results showed that the high boron removal efficiency was obtained at (S/V) = 52.8 m2/m3 using 3 pairs of electrodes and (B.P) connection. The effect of the number of pairs of electrodes on energy consumption was also evaluated at 1, 2 and 3 pair(s).
Our results showed that energy consumption increased by increasing the number of pairs of electrodes as shown in Figure 6.

Figure 6. Evaluation of the effect of the number of pair of electrodes on energy consumption, (pHi = 8; J = 11.4 mA/cm2; tEC = 30 min and si = 32.5 mS/cm).
When the number of electrodes pairs increases, the number of electrode pair acting as single EC unit increases. Thus, the total cell voltage (that is the sum of the individual unit voltages) and the electrical energy consumed are increased. Accordingly, all EC experiments were conducted at (S/V) = 52.8 m2/m3 using 3 pairs of electrodes and (B.P) connection.
3.3. Optimal pHi Determination
It has been established that the pH has a considerable influence on the performance of EC process. Indeed, the nature and the efficiency of the involved electrochemical and chemical reactions are intimately related to the pH level in the system. To investigate this effect, a series of experiments were carried out with an initial pH varying in the range pH 5 - 10.
Figure 7 depicts the evolution of boron removal as function of the initial pH.
From Figure 7, it was observed that boron removal efficiency increased with initial pH up to 8.0, and then decreased. If activity—pH diagram for Al(III) species in equilibrium with Al(OH)3(s) is investigated, it will be seen that dominant Al(III) species is in the form of Al(OH)3(s) at pH 5.0 - 8.5 interval.  forms at the higher pH and
  is a dissolving form and does not form flocks [19]. The highest boron removal efficiency was obtained at pH = 8 because boron was at
  form and the formation Al(OH)3(s) was a quite high at this pH. Therefore, all EC experiments were conducted at pHi = 8.
3.4. Optimal Initial Conductivity Determination
The conductivity of the solution was adjusted to the desired levels upon addition of supporting electrolyte NaCl. The presence of the chloride ions in solution has been reported to decrease passivation of the aluminium surface and thereby increase the efficiency of electrocoagulation
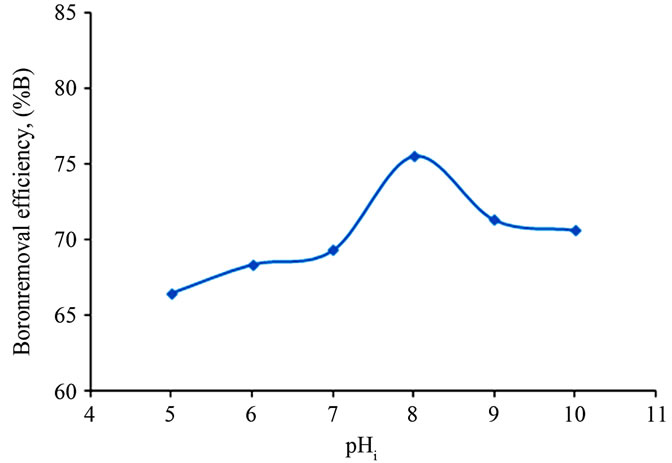
Figure 7. Effect of pHi on boron removal %B, (J = 7 mA/cm2; tEC = 60 min and si = 32.5 mS/cm).
processes [20].
The effect of initial conductivity on the boron removal was examined. From Figure 8, experimental results showed that boron removal increased slowly with increasing initial conductivity up to 32.5 mS/cm and then decreased.
The effect of initial conductivity on the energy consumption was evaluated (Figure 9). The addition of NaCl would also lead to the decrease in power consumption because of the increase in conductivity [10].
Obtained results confirmed that high conductivity values result in low energy consumption under the same current density. Increasing initial conductivity leads to energy consumption decrease due to relationship between conductivity and resistance: the conductivity stated as the inverse of the resistivity and according to Equation (8) the resistance is proportional to the resistivity. To improve boron removal efficiency and minimize energy consumption, all EC experiments were conducted at an initial conductivity around 32.5 mS/cm.
4. Experimental Design Methodology
We have investigated the influence of three main parameters: current density, EC time and initial boron concentration using the experimental design methodology by means of factorial matrix (2k) [21]. In these types of designs, variables (k) are set at two levels: low and high normalized as (−1) and (+1). With these designs, it was possible to calculate the average and the principle effects of each factors and their interaction.
The experimental response associated to a 2k factorial design (for 3 variables) is represented by a linear polynomial model equation:
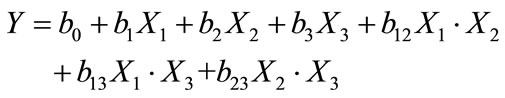 (9)
(9)
where Y: experimental response,
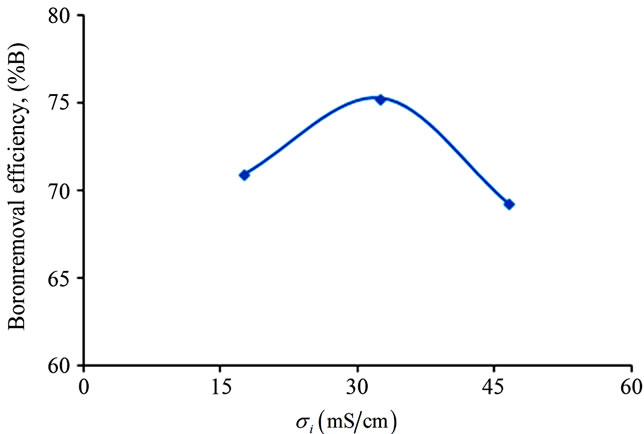
Figure 8. Effect of initial conductivity on boron removal %B, (pHi = 8, J = 7 mA/cm2; tEC = 60 min).
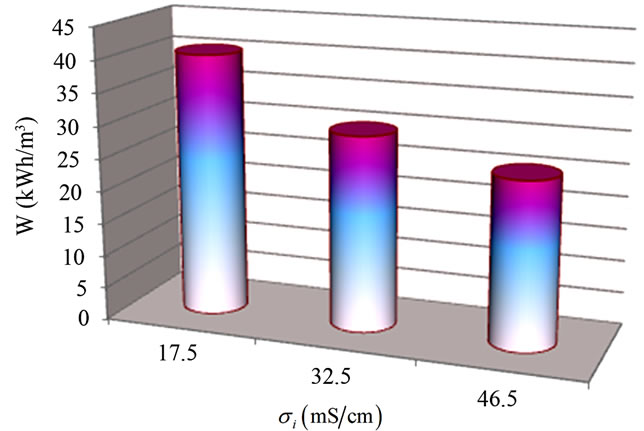
Figure 9. Evaluation of the effect of initial conductivity on energy consumption, (pHi = 8; J = 7 mA/cm2 and tEC = 60 min).
Xi: coded variable (−1 or +1)bi: estimation of the principal effect of the factor i for the response Ybij: estimation of interaction effect between factor i and j for the response Y.
The response investigated is the percentage of boron removal. The coefficients of the equation model were calculated in the experimental field listed in Table 1.
The experimental design and results are represented in Table 2.
According to the results obtained, the coefficients of the polynomial model were calculated using the NemrodW Software:
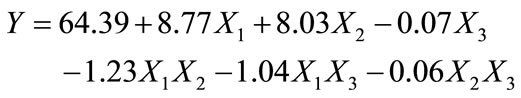 (10)
(10)
The effects and interactions of the various investigated factors are represented in Figure 10.
It was concluded that current density (J) has the highest effect. The effect of current density is positive, so it seems that removed boron level increases when current density increases. Similar effect was seen with the parameter of EC time (tEC), it’s the second important factor with a positive effect but slightly lower than current den-
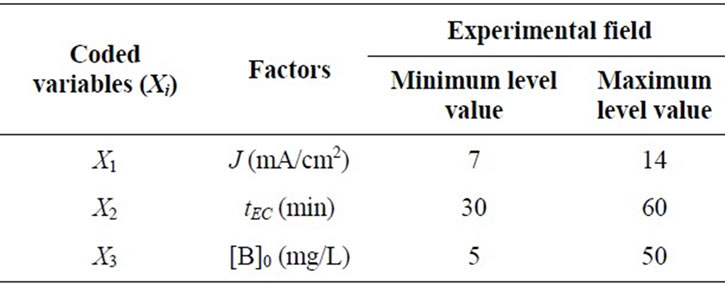
Table 1. Experimental region investigated for boron removal by EC.

Table 2. Factorial experimental design, experimental plan and results.
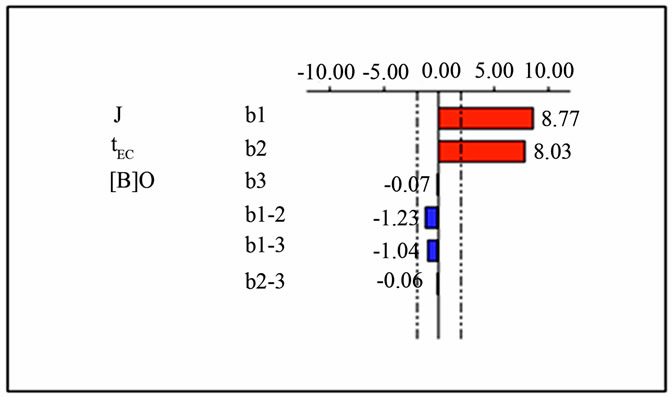
Figure 10. Graphical analysis of the effect of: J, tEC and the [B]0 on boron removal by EC.
sity effect. The initial boron concentration [B]0 has a negative effect but is not significant, in fact the coefficient associated has an low negative value (−0.07). Also the interactions among the various investigated factors are not so significant and have negative small degree.
Pareto analysis [22] gives more significant information to interpret these results. In fact, this analysis calculates the percentage effect of each factor on the response, according to the following relation:
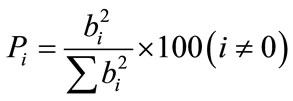 (11)
(11)
where bi represent the estimation of the principal effect of the factor i for the response.
Figure 11 represents the Pareto graphic analysis.
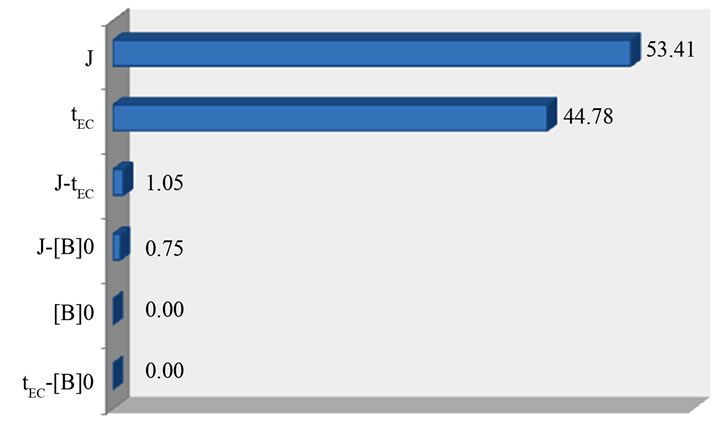
Figure 11. Graphical Pareto analysis.
It shows that current density (J) and EC time (tEC) are the most determining factors on the removal of boron by EC; their effect is 98.19% on the investigated response. Therefore, more than 99% of the response are bringing by these two factors and their interaction. However, initial concentration of boron [B]0 and the other interactions have a negligible effect, they represent a small degree lower than 1% of the response. As a consequence, the best removal of boron by EC conditions were obtained (J = 14 mA/cm2) and (tEC = 60 min), in the experimental region investigated. These results were also reported by different authors [23,24] where they deduced that the removal efficiency of boron by EC increases with increasing of current density and EC time.
5. Application
In order to study the applicability of the process, experiments were conducted to determine the effectiveness of EC treatment for boron removal from seawater samples. Before starting EC tests, we proceeded to determine the main quality parameters of the three seawater samples. The variation of physico-chemical characteristics was studied after EC treatment at optimum conditions. The results are summarized in Table 3.
From Table 3, it is necessary to mention that not only EC can remove boron from seawater but all initial parameters decreased. The reason of the hardness decreasing is thought to be the calcium carbonate CaCO3 precipitation and the magnesium hydrydroxide Mg(OH)2 precipitation [25]. Boron removal and energy consumption at optimum conditions for seawater samples water containing boron are summarized in Table 4.
Under optimal parameters residual boron concentration achieves about 2.3 mg/L corresponding to removal efficiency almost 55% and an energy consumption up to 65 kWh/m3. So it can be concluded that when EC process is used for boron removal from seawaters, it is possible to reach the limit of recommended by WHO for boron concentration in drinking water (2.4 mg/L). From energy consumption viewpoint, EC is not suitable for seawater desalination. Indeed, based on the cost 1 kWh—0.06 $ [26], water purification cost from boron is 3.9 $/m3. For comparison, the cost of desalination of seawater by reverse osmosis with the residual boron concentration in the permeate 0.2 - 0.3 mg /L is only 0.53 $/m3. So EC may be suitable for boron removal from geothermal brackish and wastewaters [11,19,23,24].
6. Conclusions
The results of this study showed that EC process could be applied in the treatment of water containing boron. Based on the results of experiments, the following conclusion may be obtained:
• Optimization of the experimental conditions of boron removal showed that optimal boron removal was achieved for: die = 1 cm, bipolar connection mode, (S/V) = 52.8 m2/m3, pHi = 8, σi = 32.5 mS/cm.
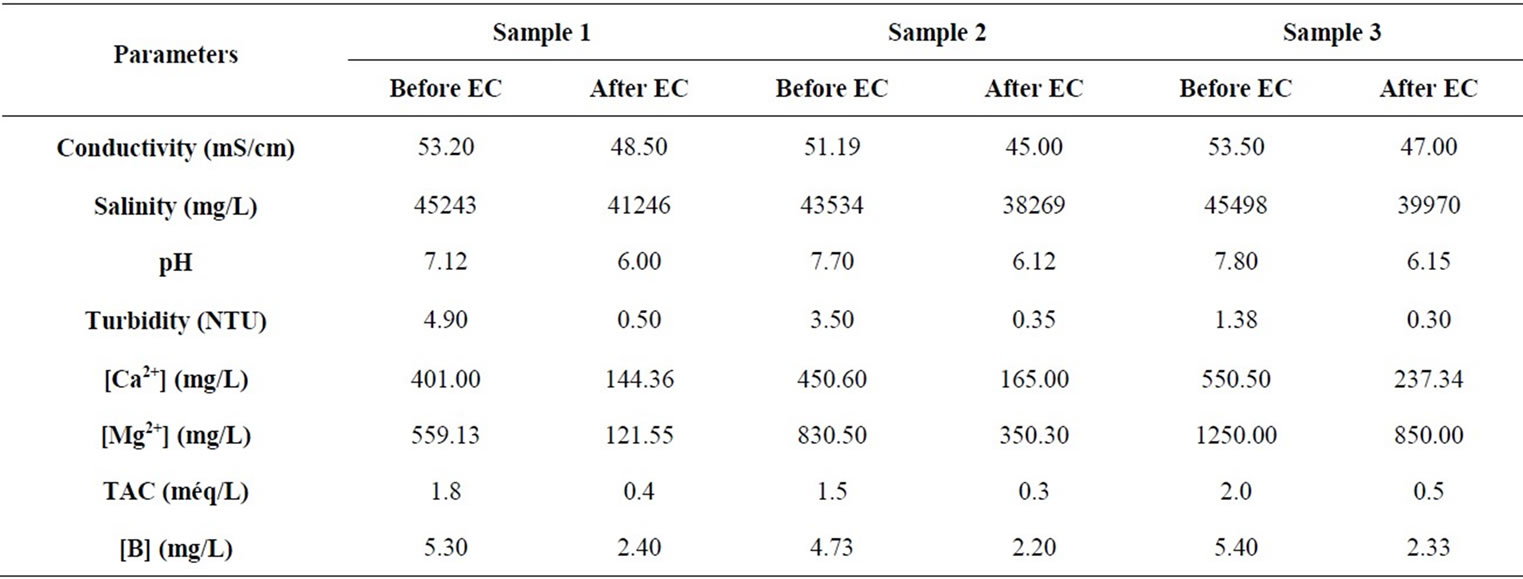
Table 3. Physico-chemical characteristics of seawater samples before and after treatment by electrocoagulation (EC) treatment.
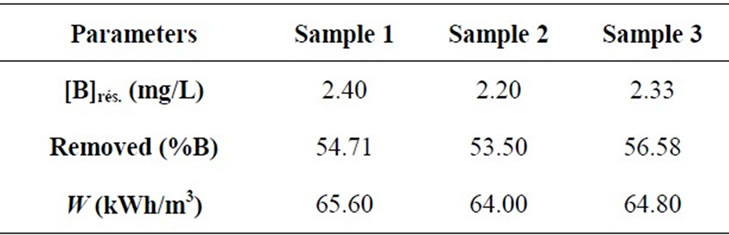
Table 4. Boron removal and energy consumption at optimum conditions for seawater samples water containing boron.
• The statistical analysis of experimental design methodology showed that current density (J) and EC time (tEC) had a considerable effect on boron removal by EC. Initial boron concentration was estimated as unimportant factor. Experimental data showed that optimum operating conditions were J = 14 mA/cm2 and tEC = 60 min.
• At optimal conditions, boron removal from synthetic aqueous solutions containing initial boron concentrations of 5 and 50 mg/L reached 81% and 79%, respectively.
In order to study the applicability of the process, experiments were conducted to determine the effectiveness of EC treatment for boron removal from seawater samples. Removal efficiency up to 55% was achieved under optimal parameters. But energy consumption was high. So it can be concluded that when EC process is used for boron removal from seawater, it is possible to reach the limit recommended by WHO for boron concentration in drinking water, 2.4 mg/L with huge consumption of electricity.
REFERENCES
- I. Yilmaz Ipek, R. Holdich, N. Kabay, M. Bryjak and M. Yuksel, “Kinetic Behaviour of Boron Selective Resins for Boron Removal Using Seeded Microfiltration System,” Reactive & Functional Polymers, Vol. 67, No. 12, 2007, pp. 1628-1634. doi:10.1016/j.reactfunctpolym.2007.07.027
- W. Bouguerra, A. Mnif, B. Hamrouni and M. Dhahbi, “Boron Removal by Adsorption onto Activated Alumina and by Reverse Osmosis,” Desalination, Vol. 223, No. 1-3, 2008, pp. 31-37. doi:10.1016/j.desal.2007.01.193
- WHO, “Boron in Drinking-Water, Background Document for Development of WHO Guidelines for Drinking-Water Quality,” 2009, pp. 1-15.
- N. Kabay, E. Güler and M. Bryjak, “Boron in Seawater and Methods for Its Separation—A Review,” Desalination, Vol. 261, No. 3, 2010, pp. 212-217. doi:10.1016/j.desal.2010.05.033
- R. Keren and F. T. Bingham, “Boron in Water, Soils, and Plants,” Advances in Soil Science, Vol. 1, 1985, pp. 229- 276. doi:10.1007/978-1-4612-5046-3_7
- W. Bouguerra, I. Marzouk and B. Hamrouni, “Equilibrium and Kinetic Studies of Adsorption of Boron on Activated Alumina,” Water Environment Research, Vol. 81, No. 12, 2009, pp. 2455-2459.
- WHO, “Boron in Drinking-Water, Background Document for Preparation of WHO Guidelines for Drinking-Water Quality. Geneva, World Health ORGANIZATION,” 2003, pp. 1-10.
- WHO, “Guidelines for Drinking-Water Quality,” 4th Edition, 2011, pp. 323-324.
- G. C. Cushnie, “Electroplating Wastewater Pollution Technology,” Noyes Publications, NJ, 1985.
- M. A. Zazouli and M. Taghavi, “Phenol Removal from Aqueous Solutions by Electrocoagulation Technology Using Iron Electrodes: Effect of Some Variables,” Journal of water Resource and Protection, Vol. 4, 2012, pp. 980-983.
- A. E. Yilmaz, R. Boncukcuoglu, M. Muhtar Kocakerim and B. Keskinler, “The Investigation of Parameters Affecting boron Removal by Electrocoagulation Method,” Journal of Hazardous Materials, Vol. B125, No. 1-3, 2005, pp. 160-165. doi:10.1007/978-1-4612-5046-3_7
- F. J. López, E. Jiménez and F. Hernández, “Analytical Study on the Determination of Boron in Environmental Water Samples,” Fresenius’ Journal of Analytical Chemistry, Vol. 346, No. 10-11, 1993, pp. 984-984. doi:10.1007/BF00322763
- M. M. de la Fuente and E. Mùnoz, “Boron Removal from Industrial Wastewaters by Ion Exchange: An Analytical Control Parameter,” Desalination, Vol. 181, No. 1-3, 2005, pp. 207-216. doi:10.1007/BF00322763
- J. Rodier, “L’Analyse de l’eau,” 8th Edition, DUNOD, Paris, 1997, pp. 175-181.
- N. Daneshvar, “Pretreatment of Brackish Water Using DC-Electrocoagulation-Method and Optimization,” Iranian Journal of Chemistry & Chemical Engineering, Vol. 21, No. 1, 2002, pp. 13-20.
- S. Vasudevan, J. Lakshmi and G. Sozhan, “Electrochemically Assisted Coagulation for the Removal of Boron from Water Using Zinc Anode,” Desalination, Vol. 310, 2012, pp. 122-129.
- H. Liu, X. Zhao and J. Qu, “Electrocoagulation in Water Treatment,” Electrochemistry for the Environment, Springer Science + Business Media, LLC., 2010.
- G. Chen, “Electrochemical Technologies in Wastewater Treatment,” Separation and Purification Technology, Vol. 38, No. 1, 2004, pp. 11-41. doi:10.1016/j.seppur.2003.10.006
- A. E. Yilmaz, R. Boncukcuo˘glu, M. M. Kocakerim, M. T. Yilmaz and C. Paluluo˘glu, “Boron Removal from Geothermal Waters by Electrocoagulation,” Journal of Hazardous Materials, Vol. 153, No. 1-2, 2008, pp. 146- 151. doi:10.1016/j.jhazmat.2007.08.030
- K. Bensadok , S. Benammara, F. Lapicque and G. Nezzal, “Electrocoagulation of Cutting Oil Emulsions Using Aluminium Plate Electrodes,” Journal of Hazardous Materials, Vol. 152, No. 1, 2008, pp. 423-430. doi:10.1016/j.jhazmat.2007.06.121
- J. Goupy, “La Méthode des Plans d’Expériences,” DUNOD, Paris, 1996, pp. 9-27.
- D. P. Haaland, “Experimental Design in Biotechnology,” Marcel Dekker Inc., New York, 1989.
- A, E. Yilmaz, R. Boncukcuoğlua and M. M. Kocakerim and E. Kocadağistan, “An Empirical Model for Kinetics of Boron Removal from Boron Containing Wastewaters by the Electrocoagulation Method in a Batch Reactor,” Desalination, Vol. 230, No. 1-3, 2008, pp. 288-297. doi:10.1016/j.desal.2007.11.031
- G. Sayinera, F. Kandemirlib and A. Dimogloa, “Evaluation of Boron Removal by Electrocoagulation Using Iron and Aluminum Electrodes,” Desalination, Vol. 230, No. 1-3, 2008, pp. 205-212. doi:10.1016/j.desal.2007.11.031
- A. Saiba, S. Kourdali, B. Ghernaout and D. Ghernaout, “In Desalination, from 1987 to 2009, the Birth of a New Seawater Pretreatment Process: Electrocoagulation—An Overview,” Desalination and Water Treatment, Vol. 16, No. 1-3, 2010, pp. 201-217. doi:10.5004/dwt.2010.1094
- Val. S. Frenkel “Seawater Desalination: Trend and Technologies Desalination, Trends and Technologies,” InTech, 2011, pp. 119-128. doi:10.5772/583
NOTES
*Corresponding author.