Journal of Water Resource and Protection
Vol.4 No.3(2012), Article ID:17947,7 pages DOI:10.4236/jwarp.2012.43016
Vulnerability of Groundwater System in Central Jordan Valley/Pollution Indicators and Decontamination Process
1University of Jordan, Amman, Jordan
2The University of Mustansiriyah, Baghdad, Iraq
3Al al-Bayt University, Mafraq, Jordan
4Straight Light Consultants, Amman, Jordan
Email: m.raggad@ju.edu.jo
Received December 11, 2011; revised January 13, 2012; accepted February 14, 2012
Keywords: Jordan Valley; Groundwater Vulnerability; Solar Distillation
ABSTRACT
More than 60% of the water demand in Jordan is covered by groundwater. Due to the accelerated population growth and development in all sectors including agriculture, more water has been pumped and more fertilizers have been supplied to the natural system. In the Jordan Valley; Agriculture is practiced along the year according to the agro climatic conditions as well intensive patterns of farming are carried out to satisfy the growing food demand in Jordan. Thus, Groundwater quality analysis proved that groundwater quality is relatively polluted with respect to  and salinity. The pollution hot spots are mapped to be the vulnerable areas according to the considered variables (Geology, topography, land use …etc.). Within this work groundwater quality was evaluated according to the global standards to be moderately polluted and not drinkable in more than 50% of the analyzed samples. The groundwater vulnerability map indicates that the pollution sources in the study area are mainly due to the agricultural return flow. To assure safe water supply for rural farmers a solar still was designed and implemented in the area for two months. The discharged water from the still proved to be suitable for drinking with no
  content and economically it can be handled by locals.
1. Introduction
Living in the fourth driest country on earth raised the flag for the need to achieve the terms of IWLM (Integrated Water and Land Management). In order to enhance the connection between science and policy making, researchers need to connect their comprehensive knowledge with policy makers through simplifying the real world. This can be achieved through visualization of natural resources using water management tools such as Geographic Information System (GIS). Mapping of vulnerability plays a key role in simulation of natural systems and evaluate the effect of urban development on our limited precious water resources.
Groundwater vulnerability maps can reduce the effect of man activities on water resources by drawing attention of decision makers and land use planners to the sensitive areas to be protected in the development projects [1].
Jordan valley represents the green basket of Jordan according to the suitable agro climatic conditions. Intensive irrigation combined with over pumping of groundwater added new stresses over local community and farmers. With the growing fresh water demand in the area, new resources have to be explored to sustain groundwater stocks for future generation’s right.
Aquifer vulnerability through hydro chemical assessment can pave the way for better understanding of the natural systems response to the man made activities. The main goal of this study is to delineate the aquifer vulnerability zones in Jordan Valley against contamination; In order to achieve the aim of the study; we use modeling of pollution indicators such as  to be connected with possible adaptive mitigation measures such as solar distillation.
2. Data Collection and Analysis
In order to evaluate the groundwater quality situation, water samples from different wells and springs in the study area were collected and chemically analyzed. Data were subjected to statistical analysis then transformed into GIS environment (Geographic Information Systems) for further subsequent analyses.
For aquifer vulnerability purposes, geographical, hydro geological and land use maps were collected, evaluated and transformed into GIS geo database.
3. Aquifer Vulnerability
According to global vulnerability terms, DRASTIC index can be used as a strong indicator for pollutants transfer to the aquifer system [2].
The governing equation for the DRASTIC index was defined by Knox et al., [3]; Fortin et al., [4]; and Fritch et al. [5]., as the following:
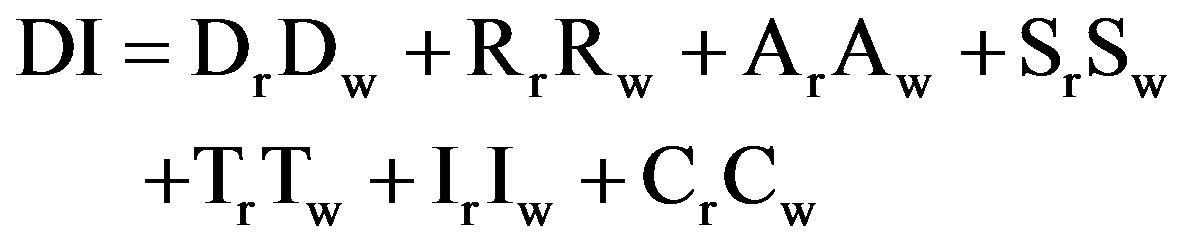
The main factors of this index are:
Ÿ Depth to water table (D)
Ÿ Recharge to the groundwater (R).
Ÿ Aquifer Media (A)
Ÿ Soil media (S)
Ÿ Topographic slope (T)
Ÿ Vadose zone (I)
Ÿ Hydraulic Conductivity (C)
Ÿ Drastic Index (DI).
The subscripts (r) and (w) are denoting to the factor rate and weight respectively (Table 1).
In order to assure accurate vulnerability modeling, Jasem (2010) [6] has modified the DRASTIC-Index model by taking the structural setting as a new parameter into consideration. The geological structures such as faults, joints are playing a significance role in enhancing vertical conductivity and later on the movement of pollutants within the aquifer system.
In this study, a second modification of the DRASTIC index took place by involvement of irrigation volumes which will increase the groundwater recharge to the shallow aquifer system.
As the surface geology can protect or expose the aquifer system to different pollutants, it was added to the final modified index.
According to the modified DRASTIC index the involved parameters were given weights and rates based on their role in increasing or decreasing aquifer vulnerability.
The considered variables with their appropriate weights and rates are shown in Table 1.
4. Data Interpolation and Modeling
The detailed procedure followed in this study was based on data collection and field investigations as shown in Figure 1.
All the needed data were extracted from different sources such as reports, maps, tables and field work.
All the data were integrated and classified according to their vulnerability potential using GIS 9.3.
5. Model Results
The combination process was based on 10 m grid size to
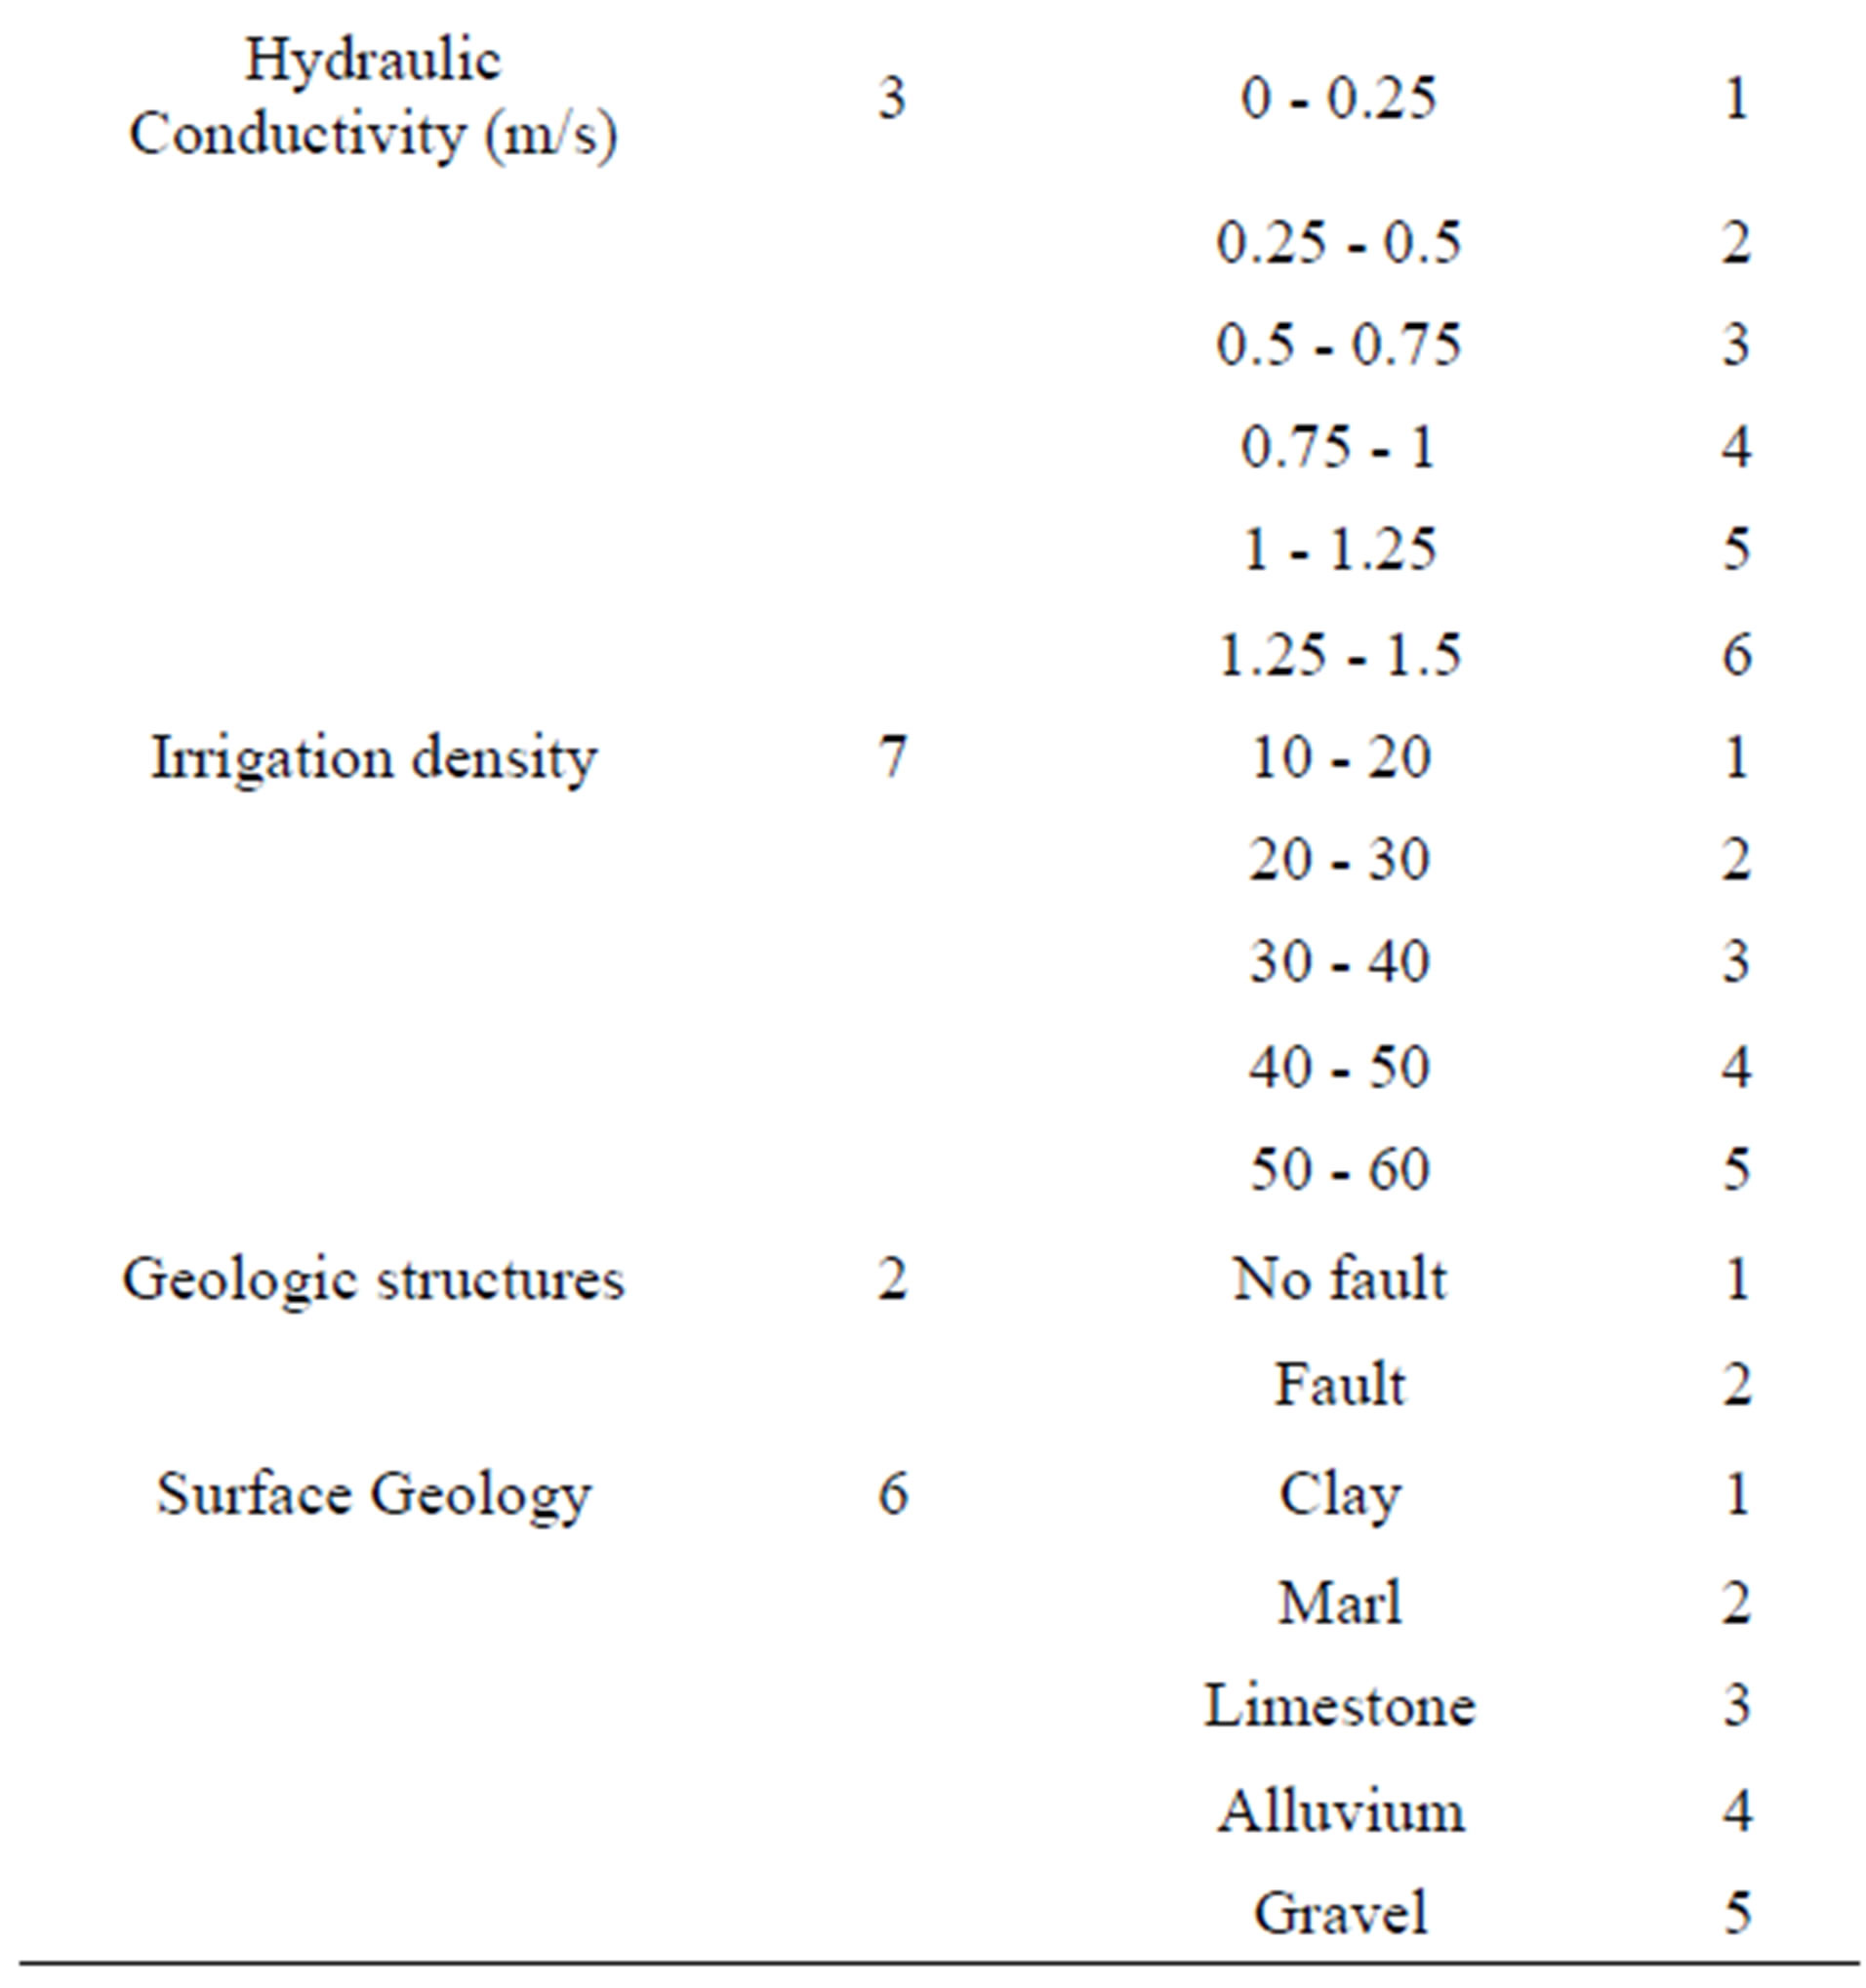
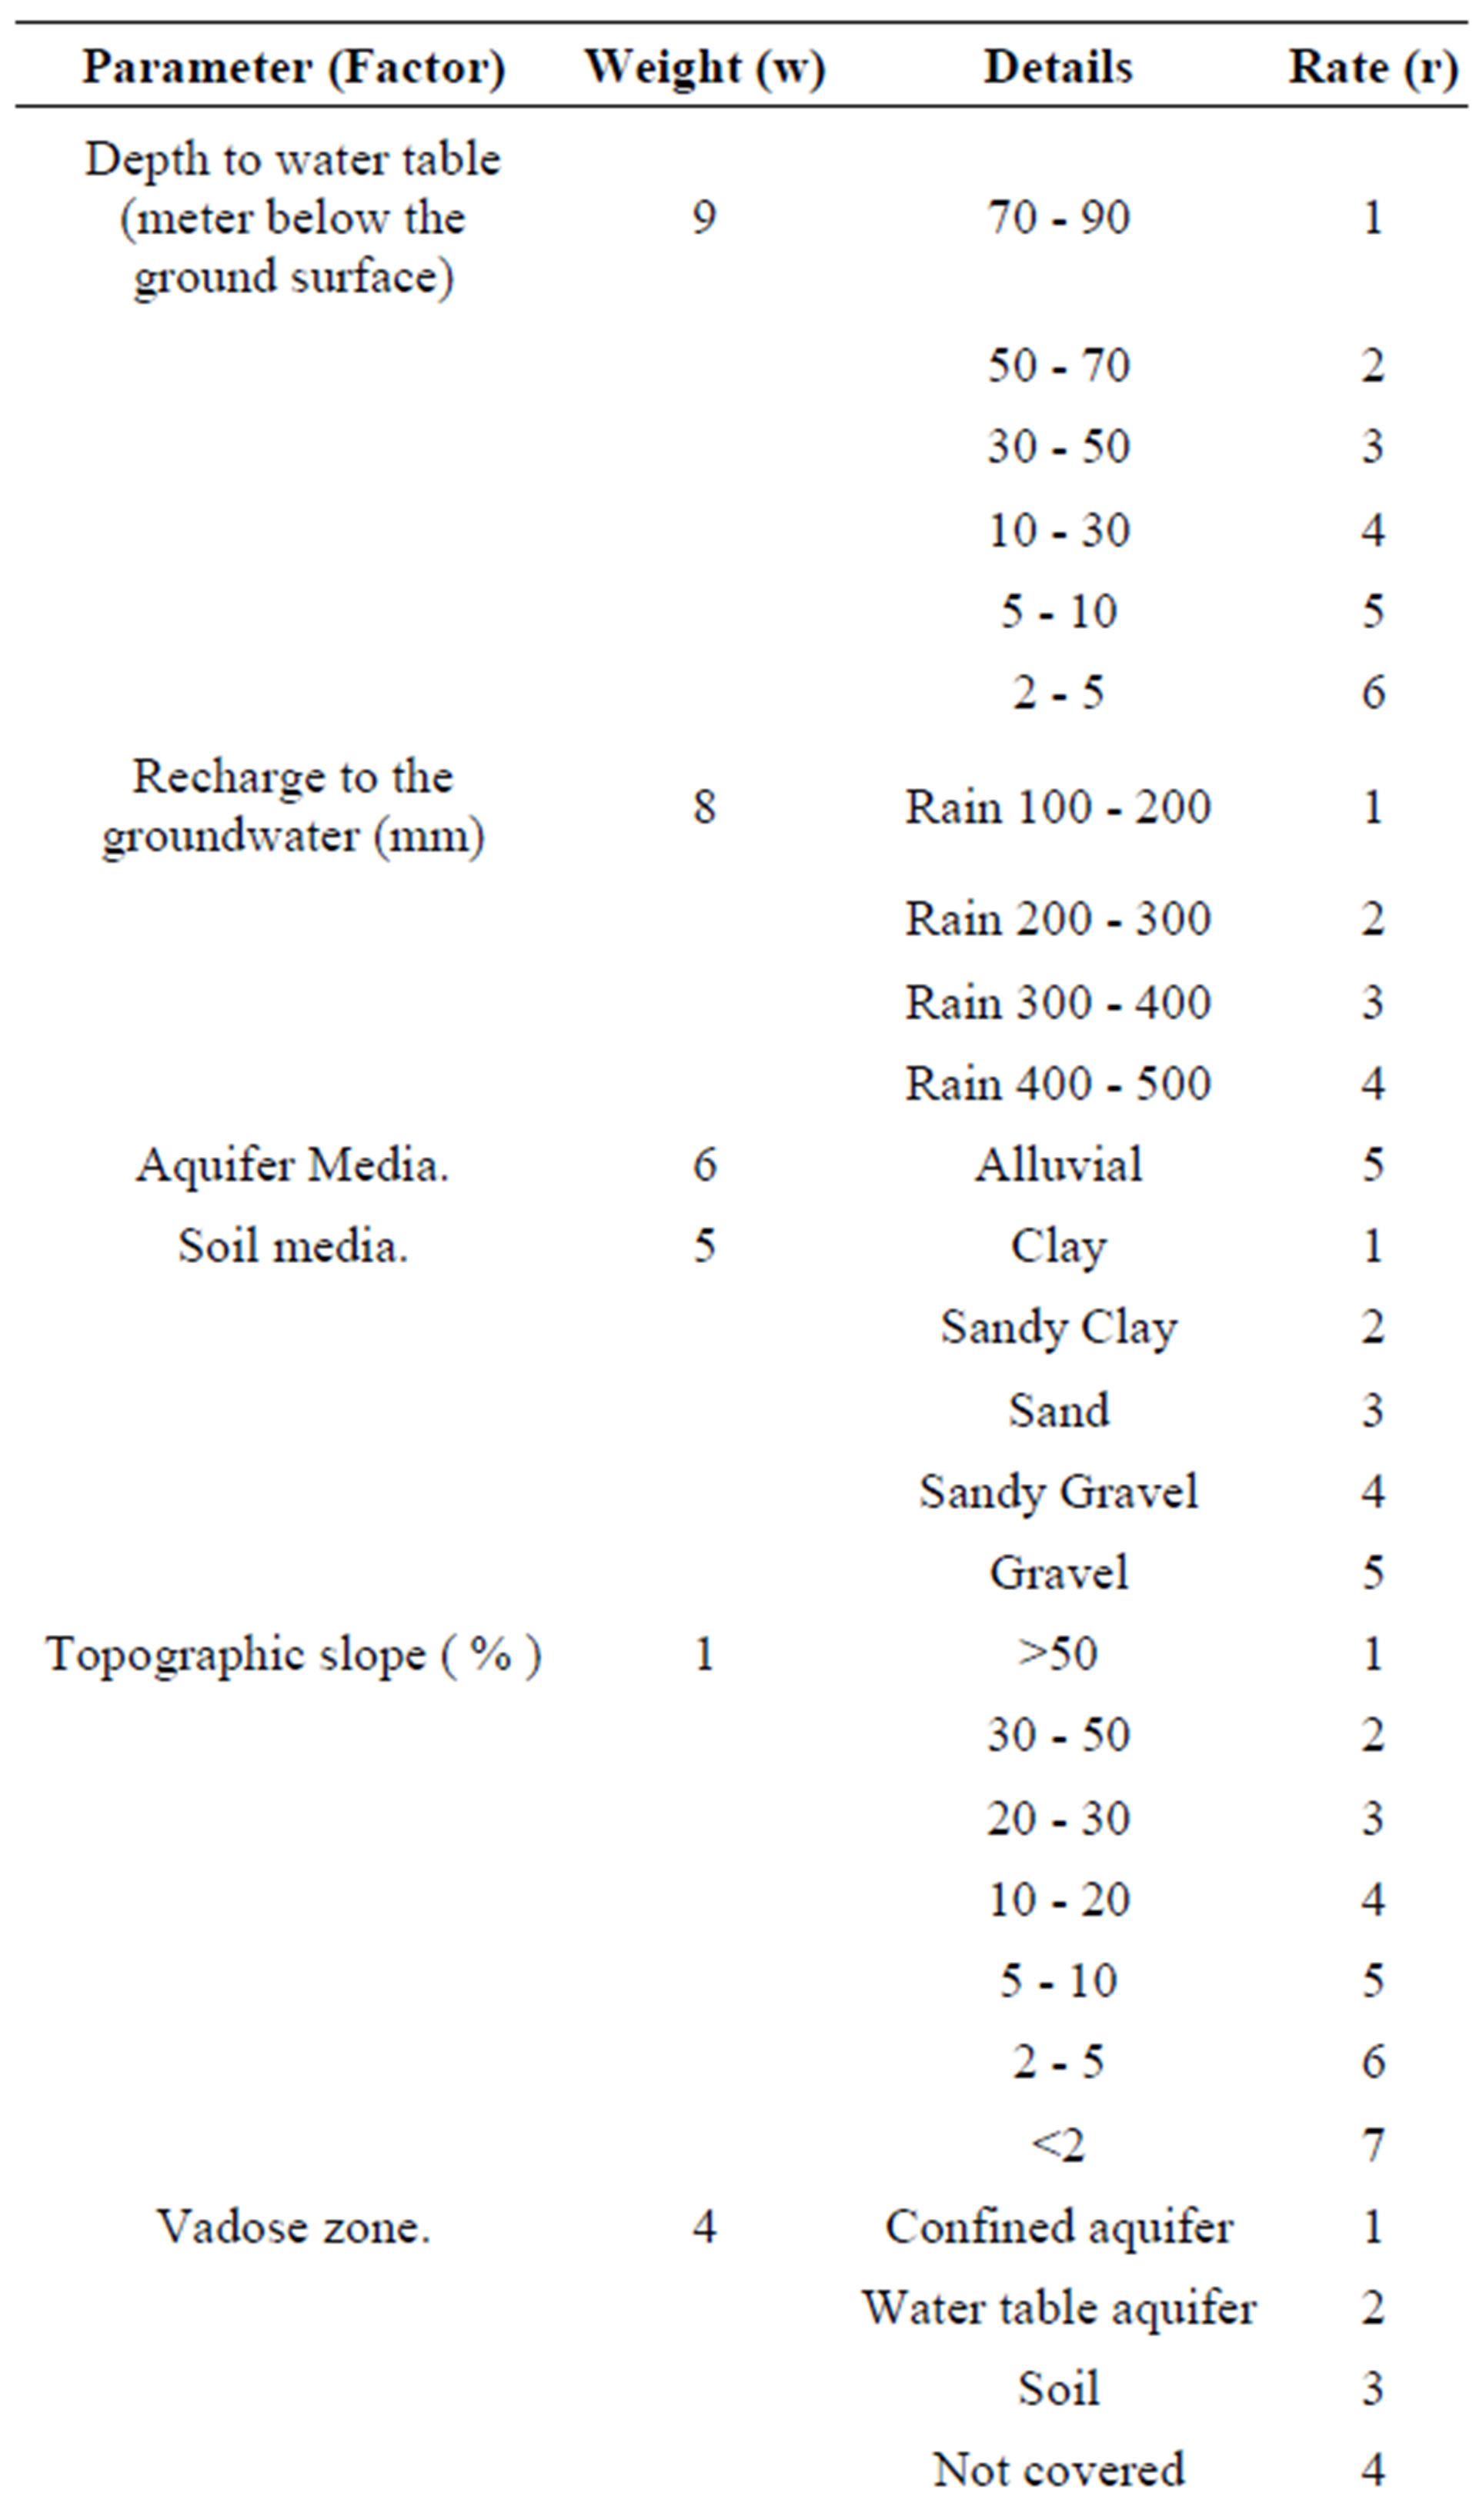
Table 1. Rated variables of modified DRASTIC index.
Figure 1. The adopted procedure for the vulnerability mapping.
assure high output resolution. The resulted final map is shown in Figure 2.
Based on the vulnerability map (Figure 2), it was found that the most vulnerable area is located at the northern part of the study area. On the other hand, central parts of the study area represent moderate vulnerability zones. The presence of sand mixed with minor amounts of clay reduces pollutant vertical movement in the soil profile.
In the eastern parts of the study area, the vulnerability was found to be low because the ground water is deep and the land slope is relatively high.
In the western parts of the study area, clay deposits are the most dominant in the soil profile resulting in a low vulnerability area.
Statistically 49% of the study area was found to have a moderate vulnerability, and more than 14% of the study area was found to have high and very high vulnerability t as to pollution as shown in Table 2.
6. Model Validation
According to aquifer vulnerability terms, natural system can provide protection to the aquifer due to the fact that areas with higher protection are expected to have low pollutions indicators concentrations such as .
.
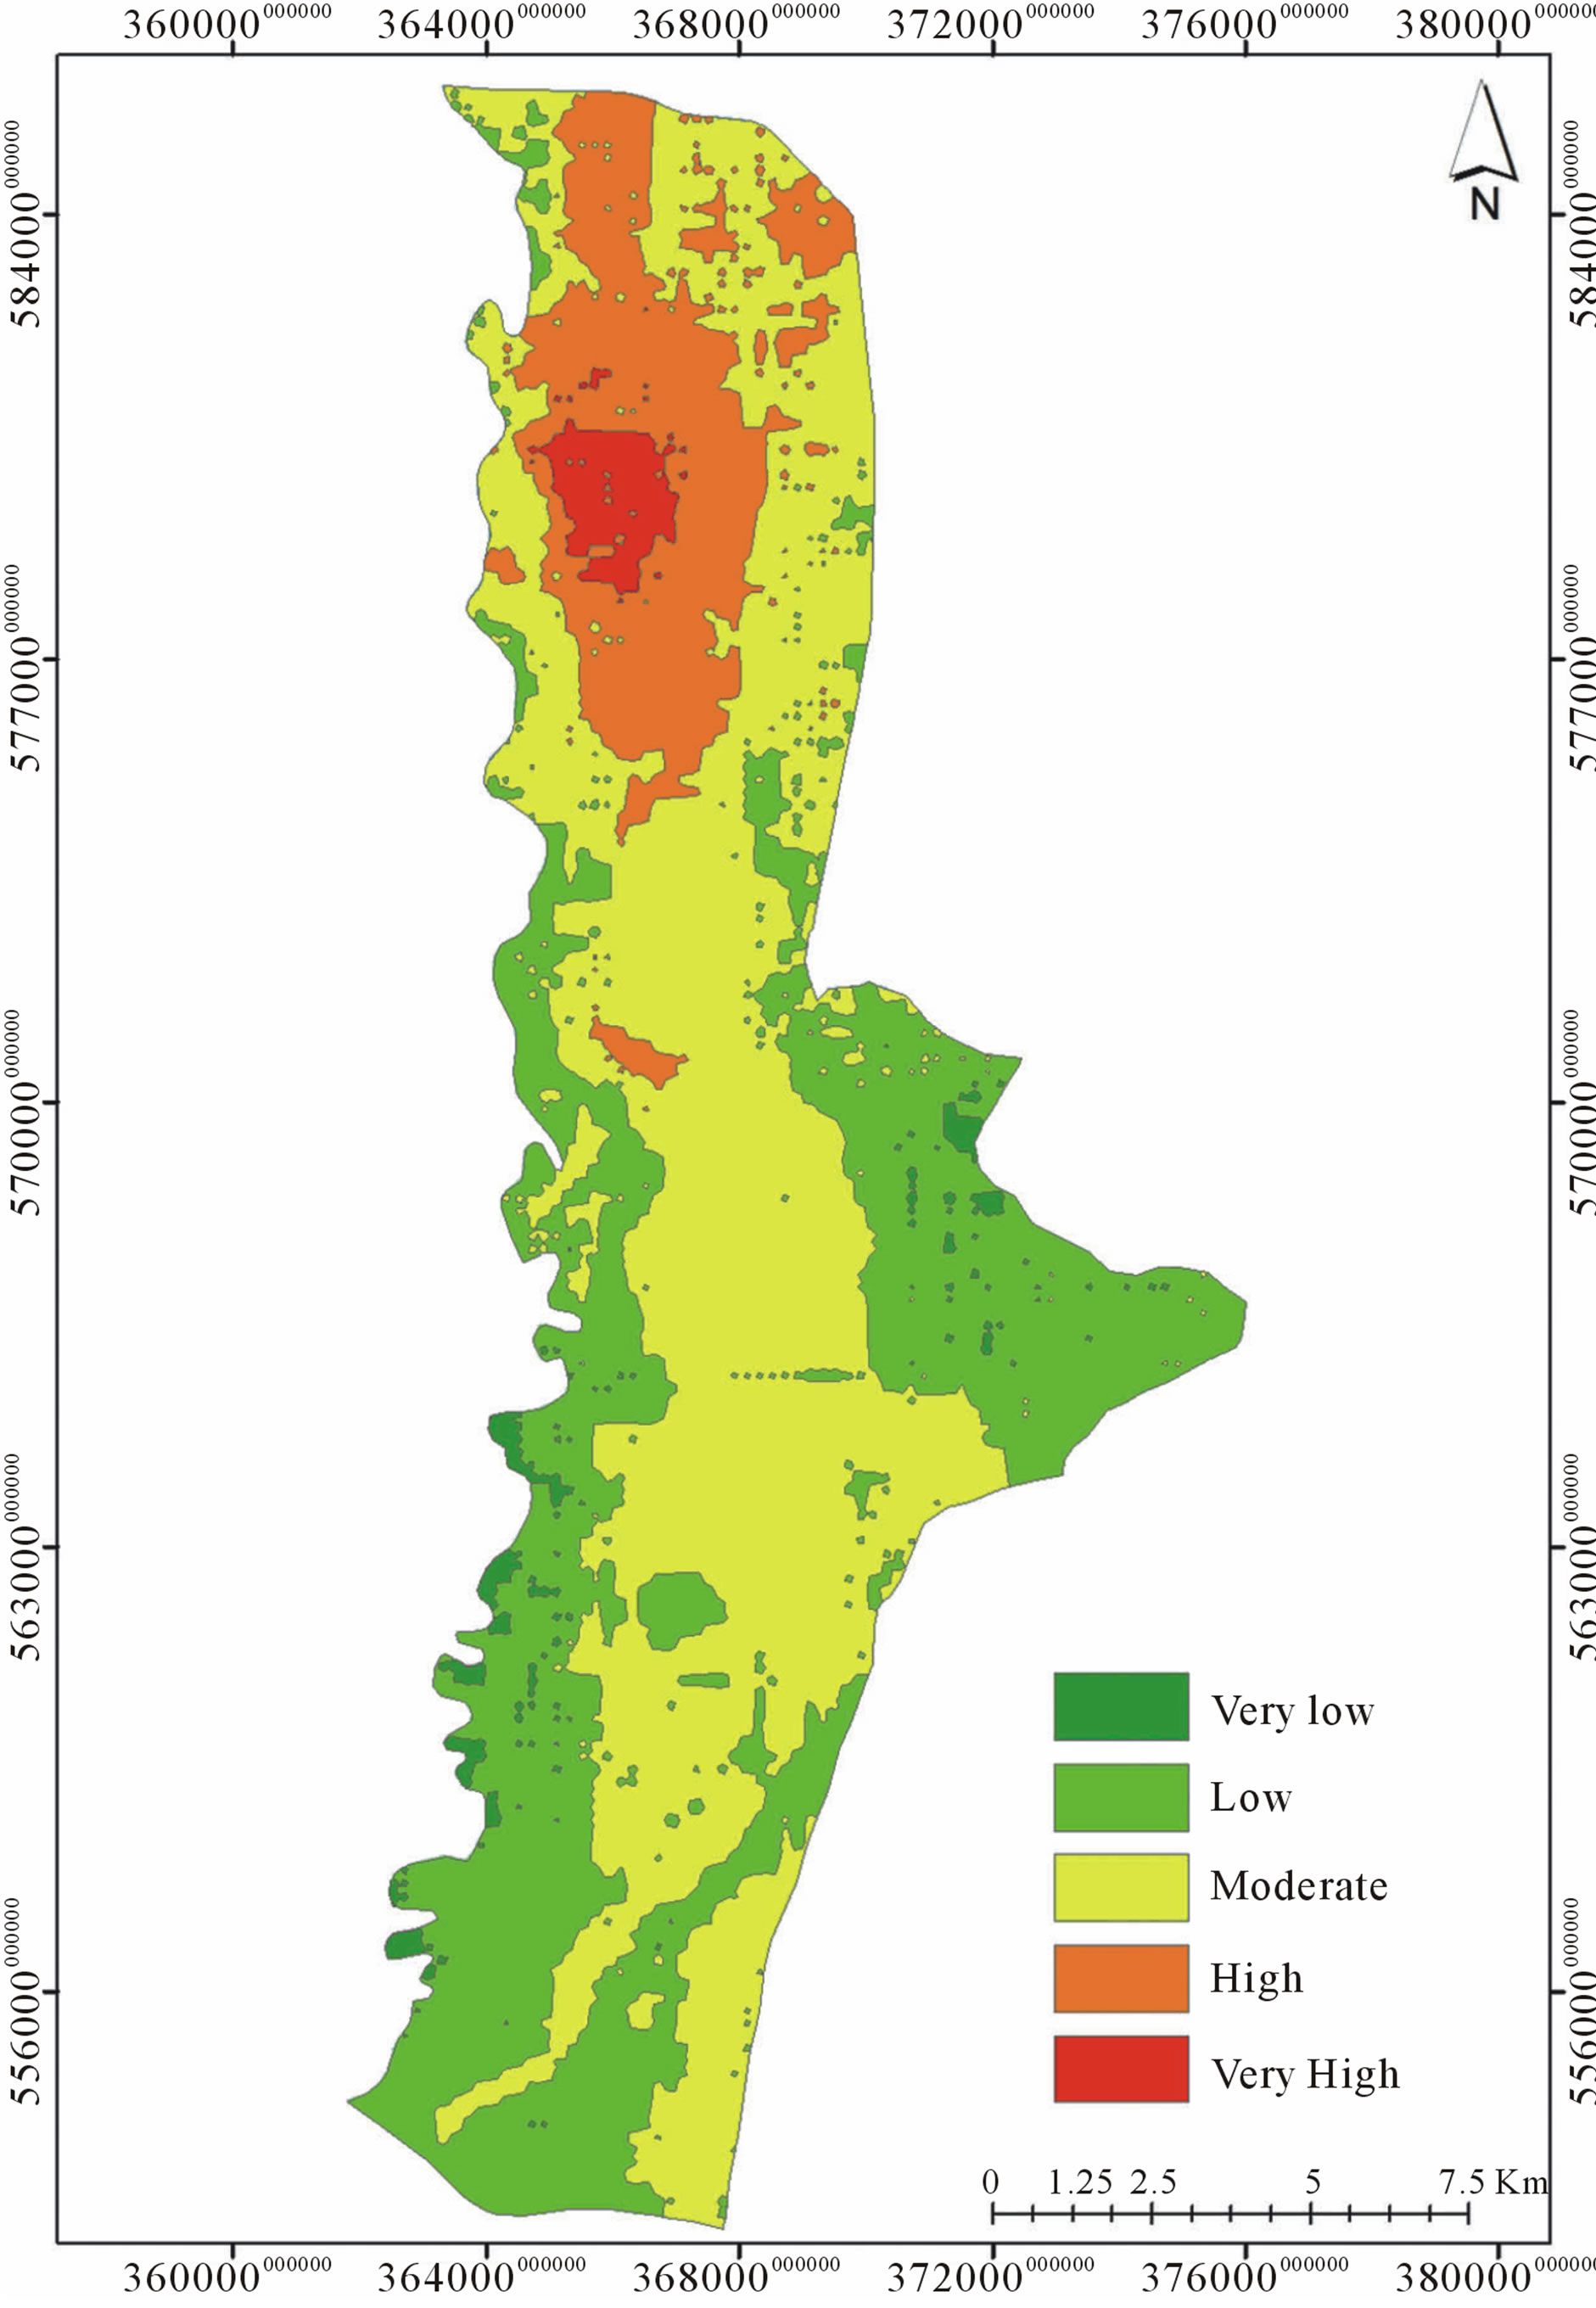
Figure 2. The resulted vulnerability map.
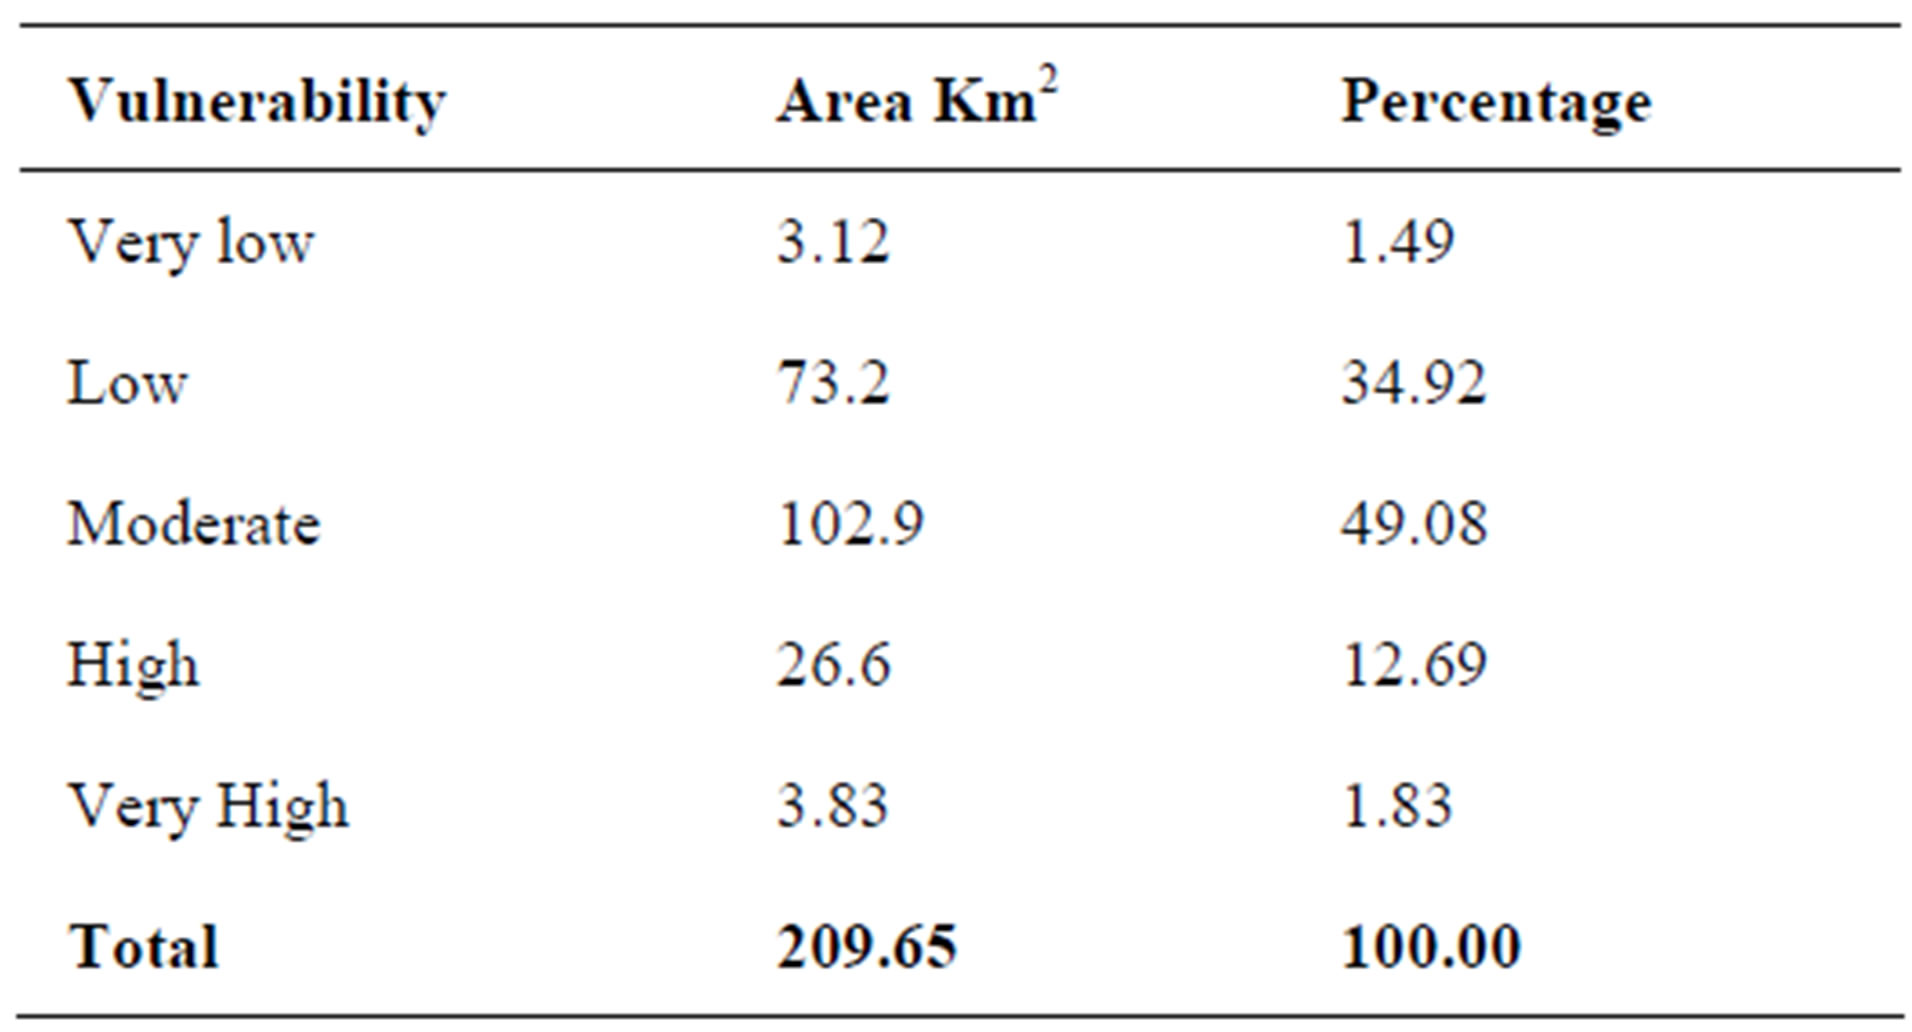
Table 2. Statistics of aquifer vulnerability zones.
In order to evaluate the outcomes of the groundwater vulnerability, field investigation was conducted to collect 17 groundwater samples to assess the quality parameters within the aquifer system.
This study proved that, high vulnerable zones have a relationship with the high Nitrate  concentrations in groundwater samples. The highest concentrations of
  were found in the northern parts of the study area. On the other hand, groundwater in the eastern and southern parts has lower Nitrate concentrations as shown in Figure 3. This figure shows the vulnerability map and the contour map that represent the
  concentration.
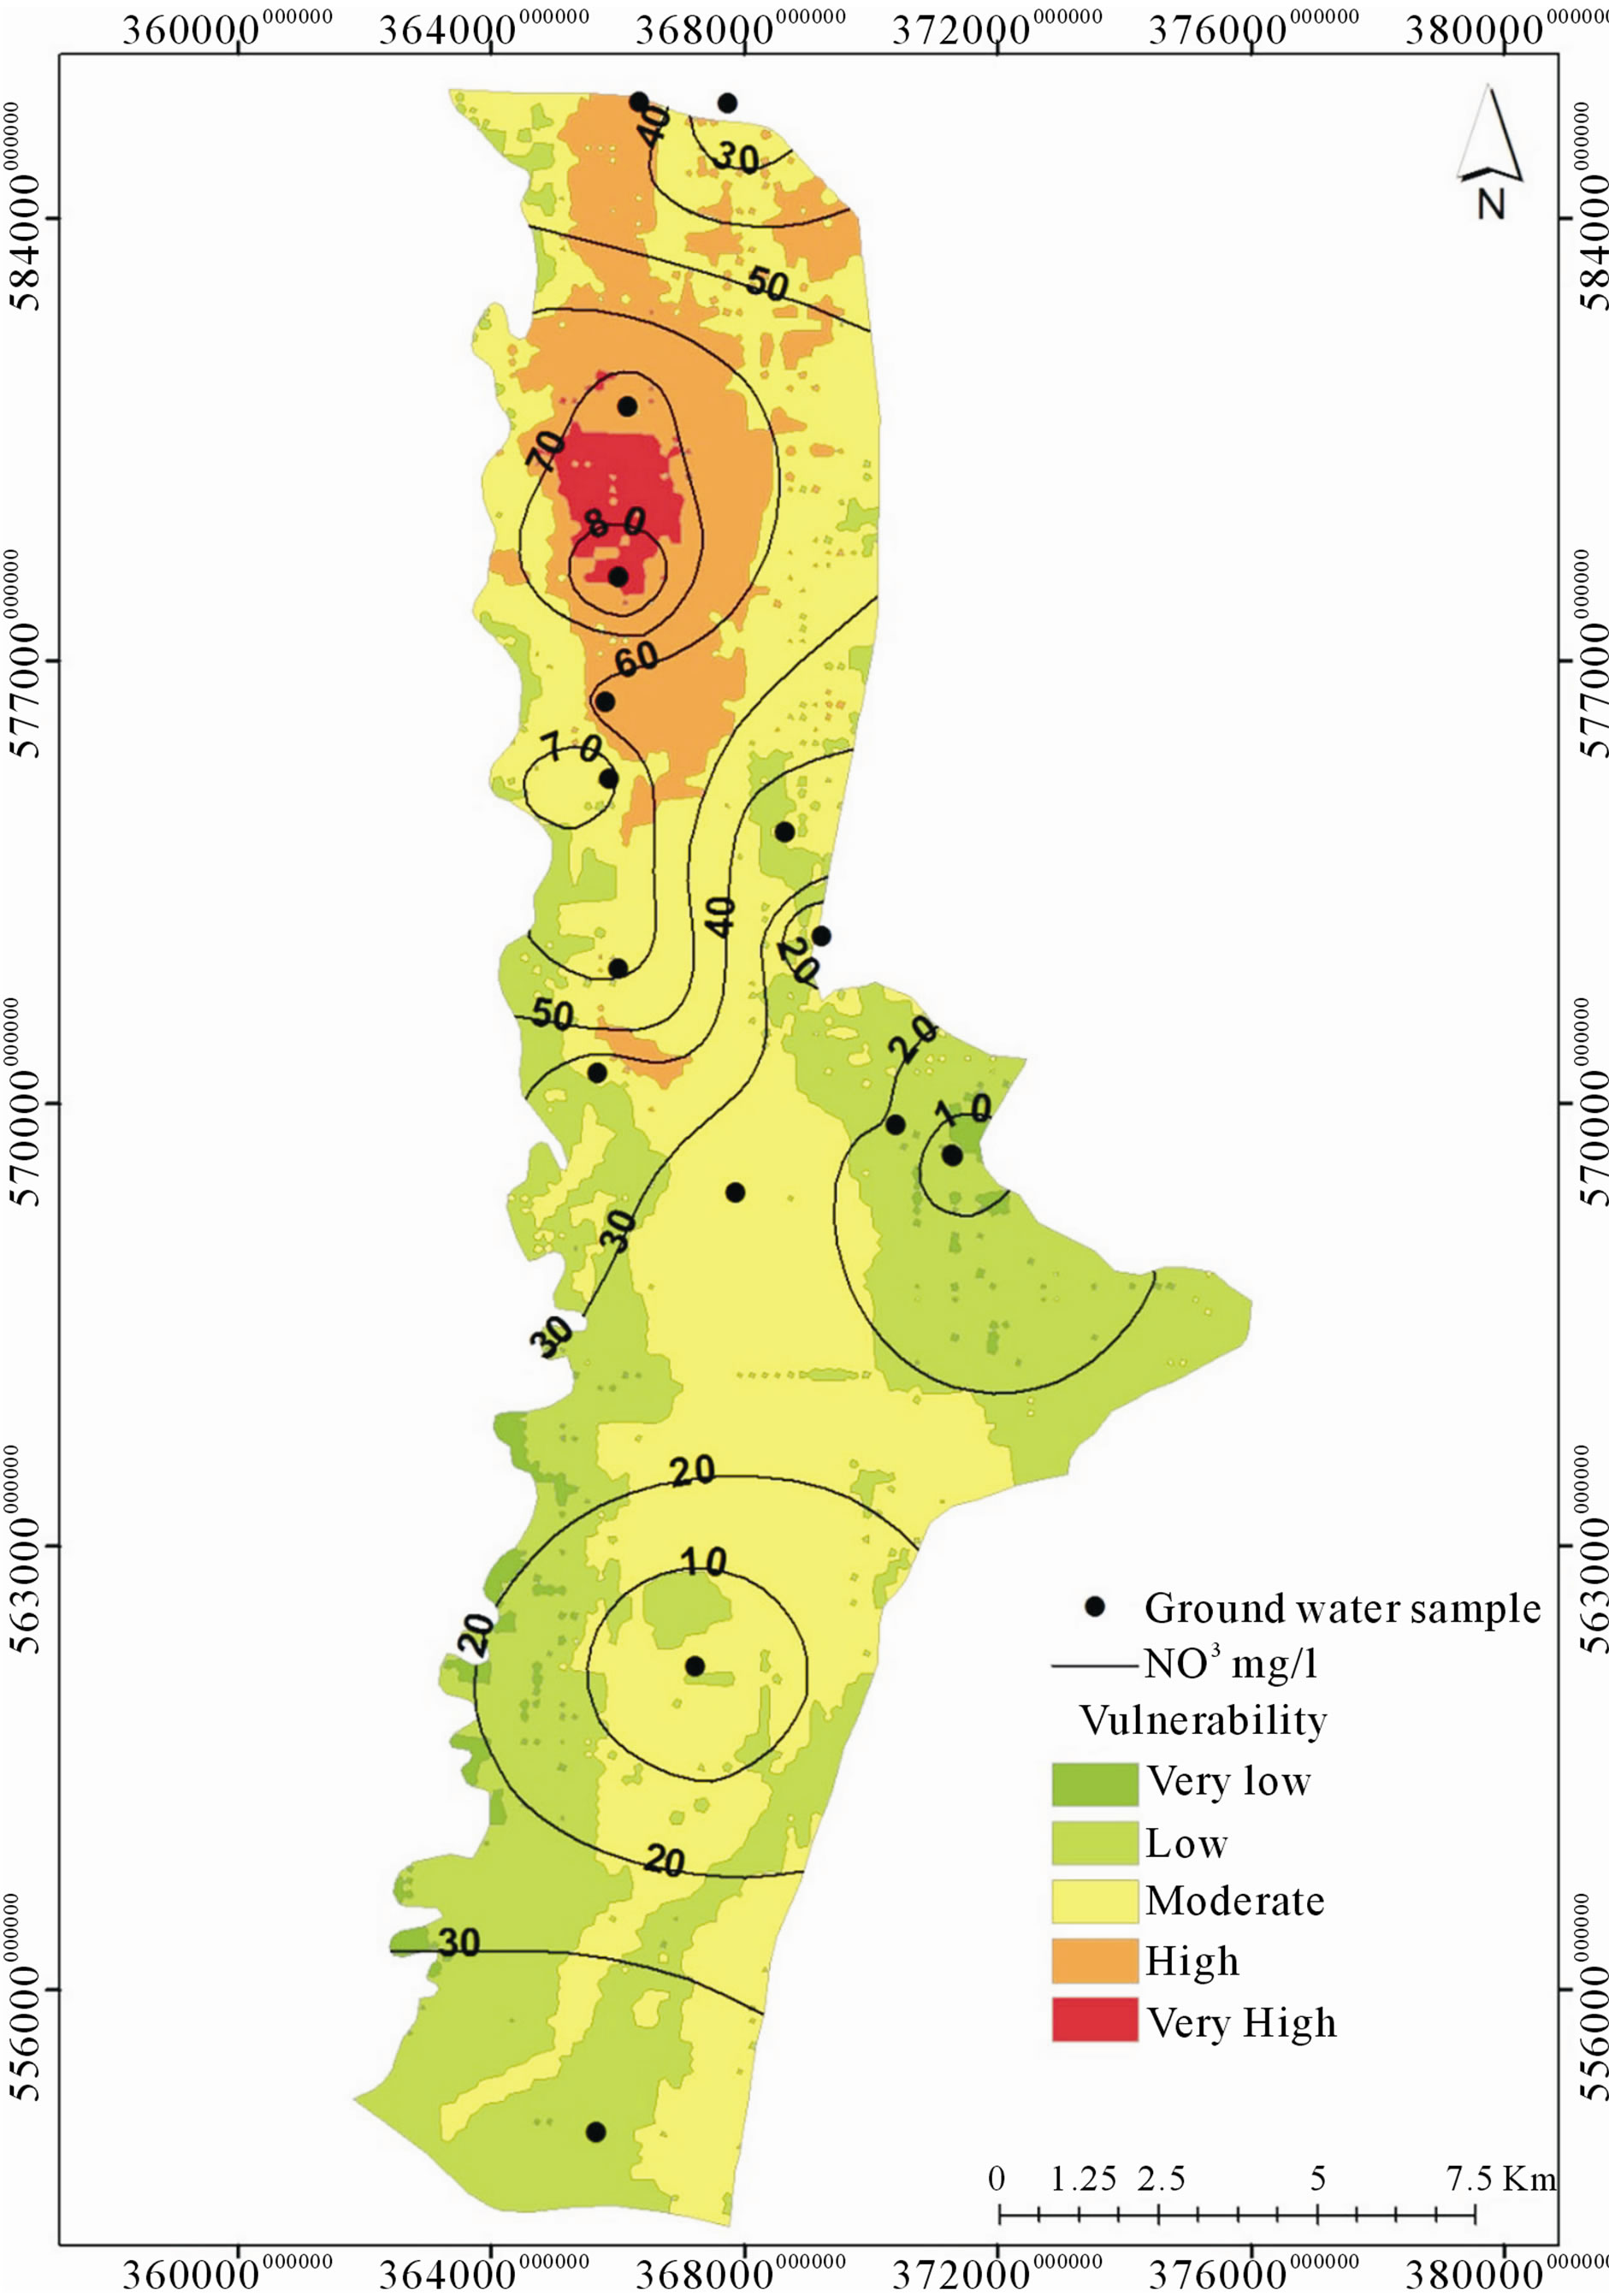
Figure 3. Vulnerability map validated with  concentrations.
In addition, the southern and western parts have low  concentration which supports the results of Aquifer vulnerability mapping.
7. Hydrochemistry
Water is considered as a good solvent for many types of salt and rock forming minerals, as a result of its dielectric constant. As groundwater flows in the rock’s pore spaces a water-rock interaction takes place and hence the groundwater contains, that cause a wide variety of dissolved solids and dominant less dissolved organic matter [7].
Hydrochemical analysis for the 17 groundwater samples was carried out to find major anions and cations in these samples as listed in Table 3.
Moreover, statistical analysis for hydro-chemical data was carried out using SPSS 16.0 [8] and Microsoft Excel software and according to USGS guidelines [9].
Table 4 provides a summary for the descriptive statistics (mean, maximum, minimum and standard deviation) for the upper and deep water aquifers.
8. Classification of Groundwater
Wilcox diagrams [10] are widely used to classify water
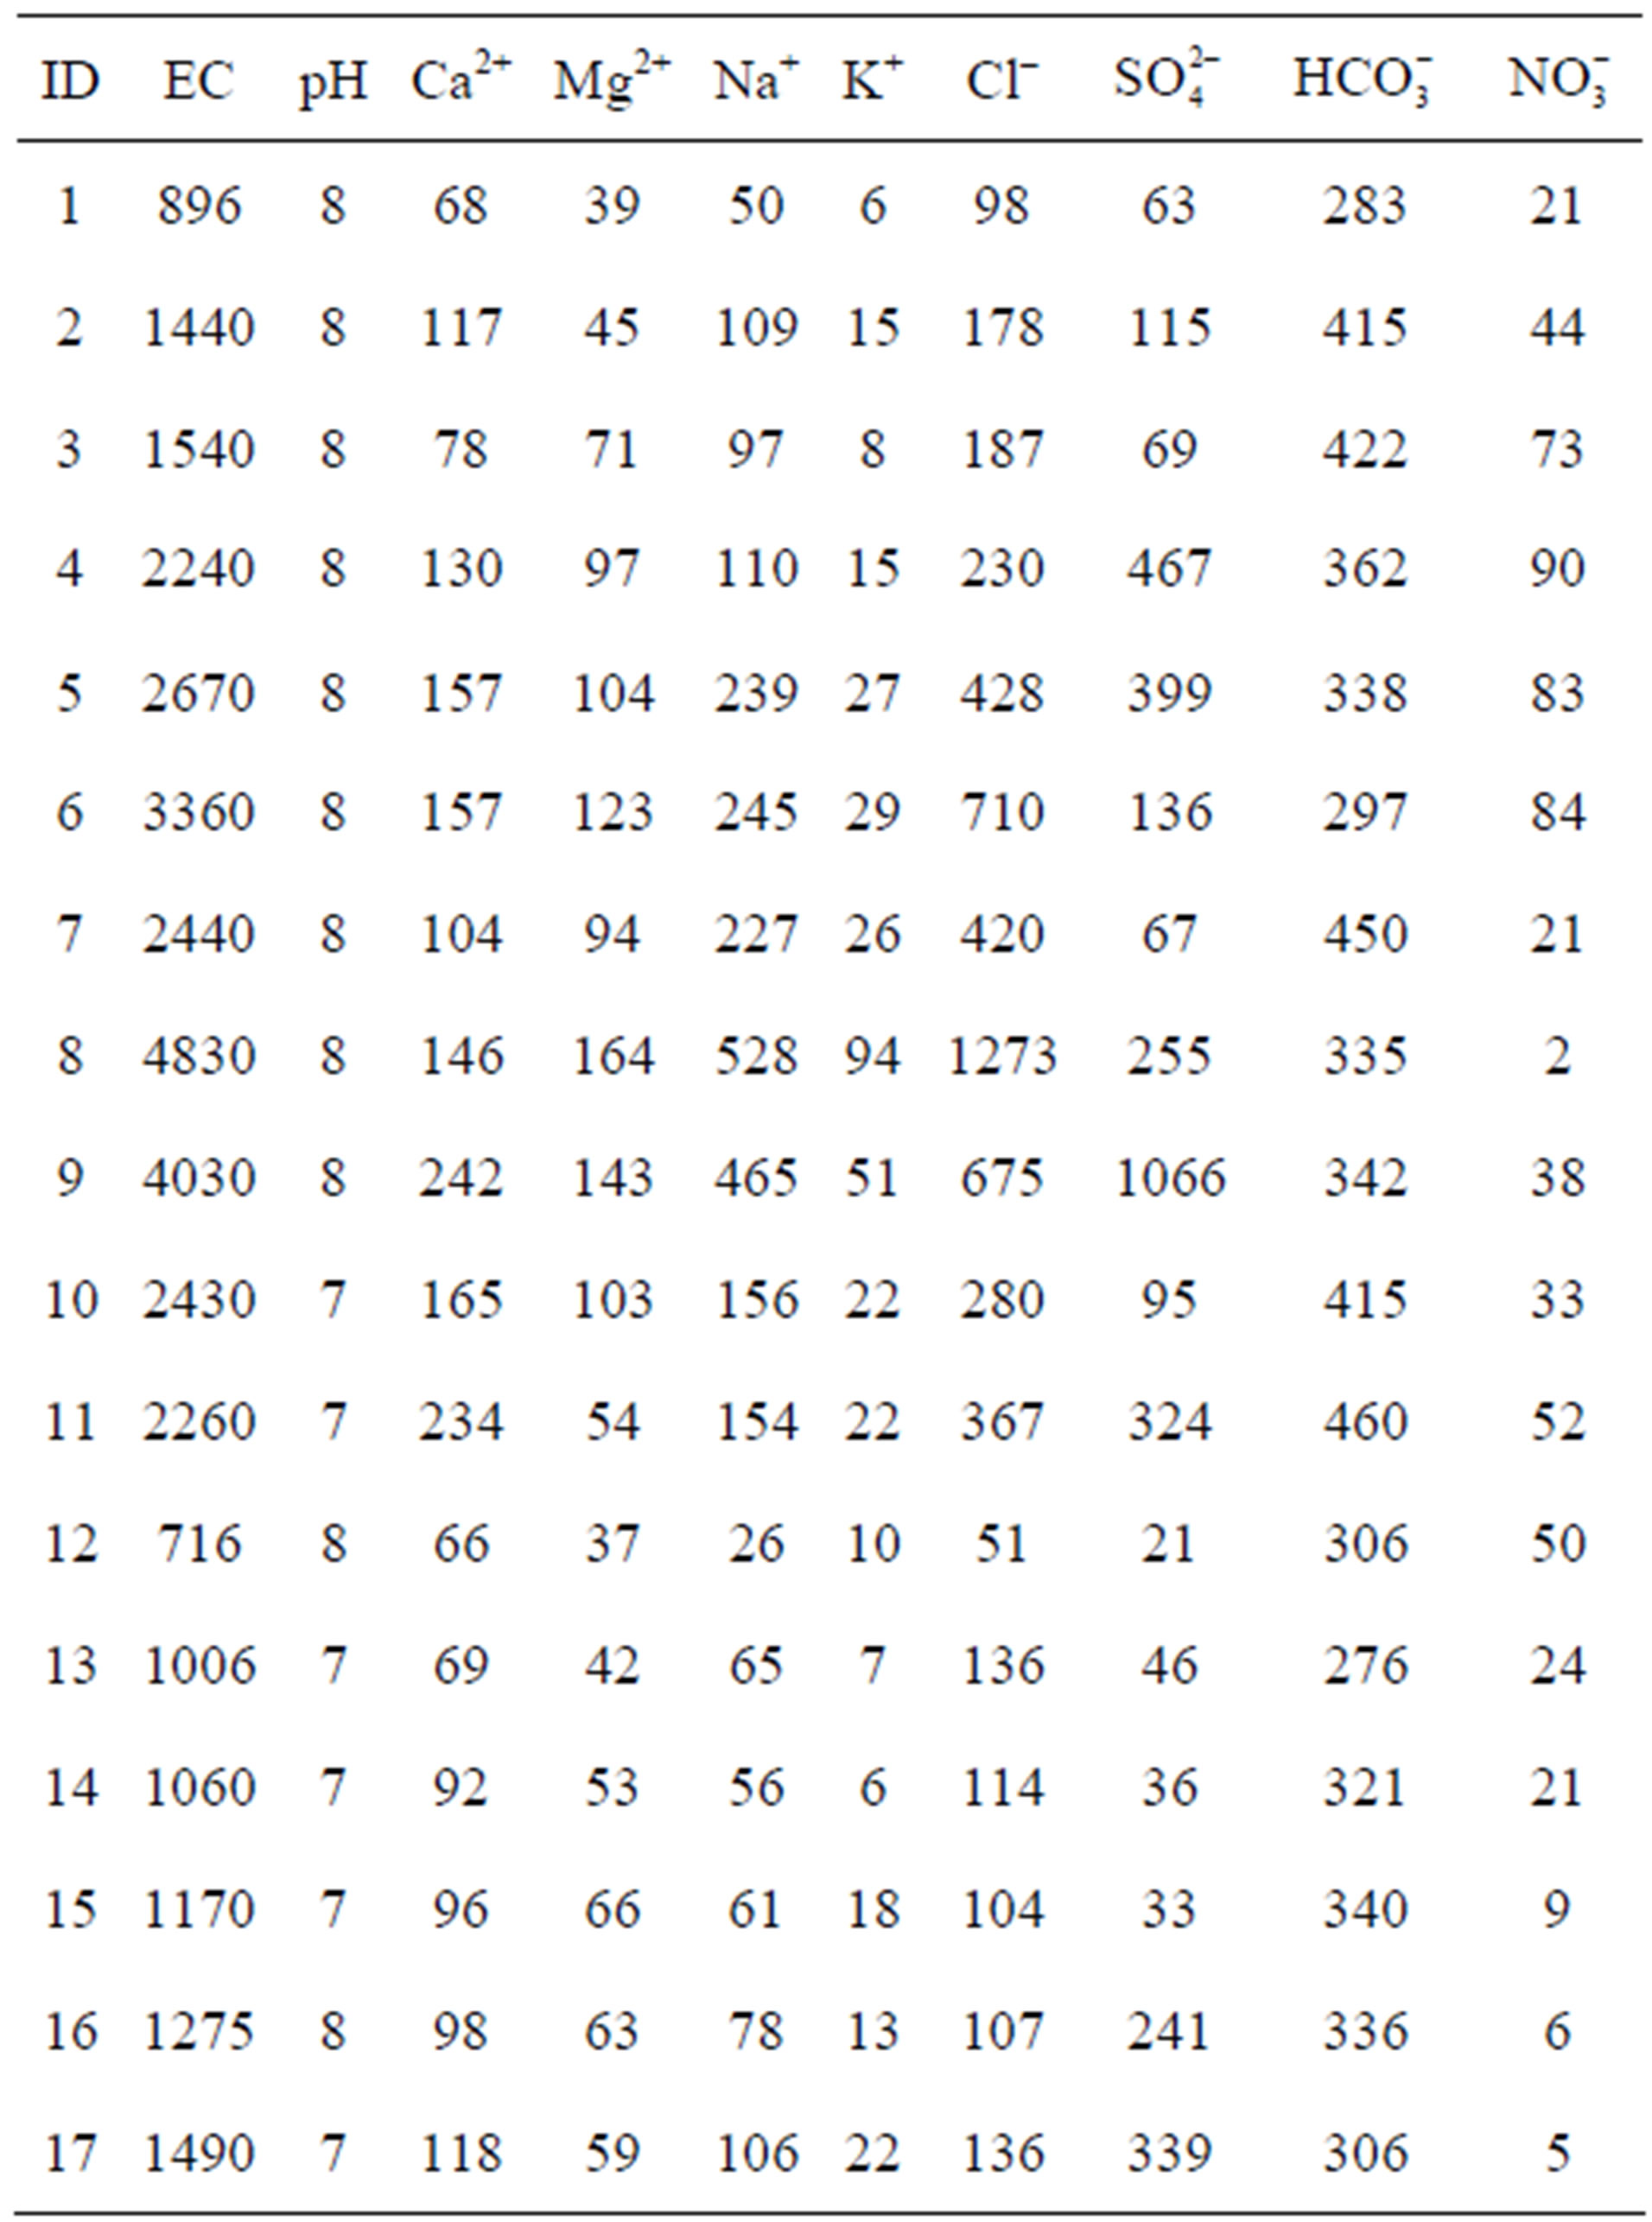
Table 3. Chemical composition of the collected water samples (mg/l).
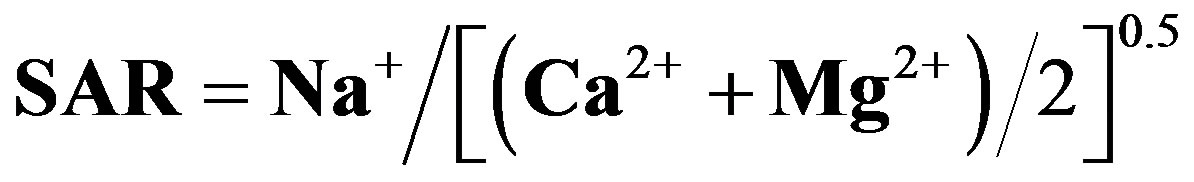
according to salinity hazard and Sodium Adsorption Ratio (SAR) for agricultural use. Excess salinity causes a reduction in the osmotic activity of plants and thus interferes with the absorption of water and nutrients from the soils [11]. SAR represents the alkali hazard and can be calculated through the following relation [12,13]:
(Concentrations are in meq/l)
If groundwater is rich in sodium and poor with respect to calcium, the cation exchange system will witness sodium enrichment which can destroy the soil structure owing to dispersion of clay particles [14].
Wilcox diagram for the analyzed samples (Figure 4) showed that 47% of the groundwater samples are located within S1C3, which means low sodium and high salinity water can be used for irrigating almost all types of soils and crops with little danger of development exchangeable sodium and salinity.
The rest of water samples were classified to have very high salinity hazard and Sodium hazard ranging from low to high. This type of water can be used for limited crops that resist salinity [12,13].
Mainly domestic supply and agriculture are the water uses in the study area. Such an economically depressed
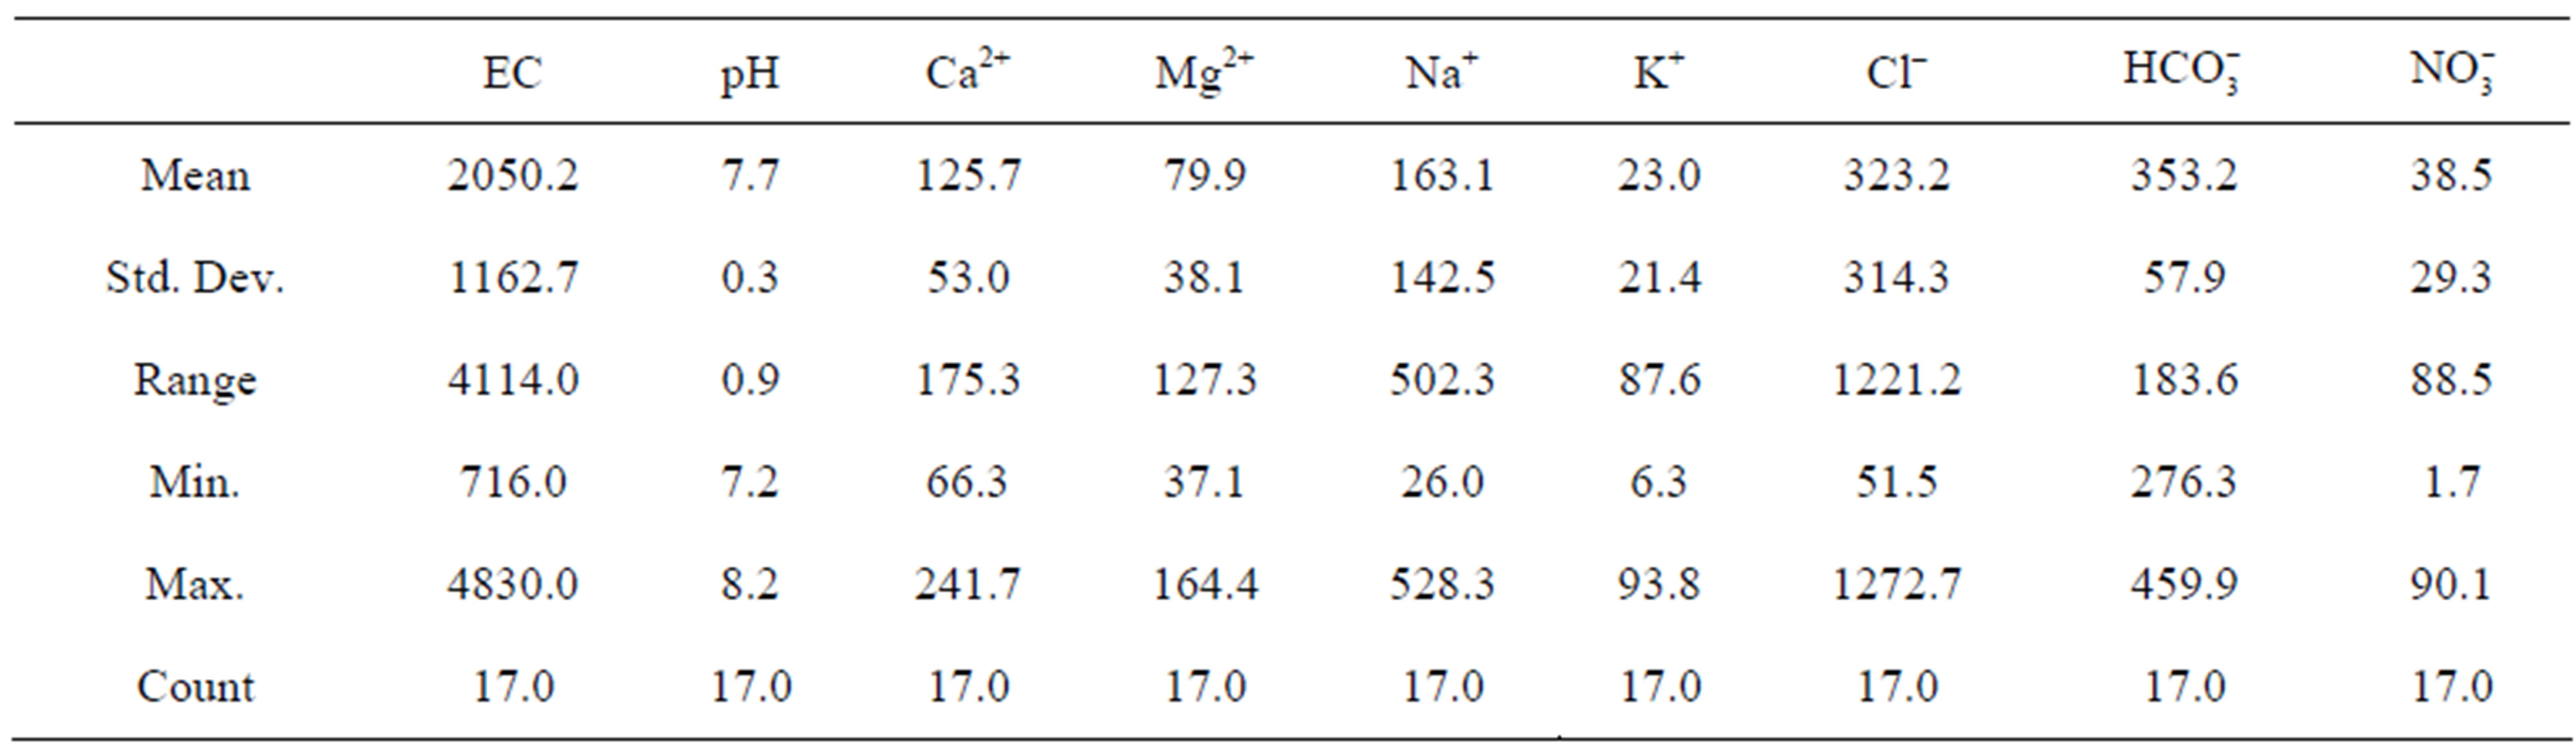
Table 4. Descriptive statistics of the analyzed water samples.
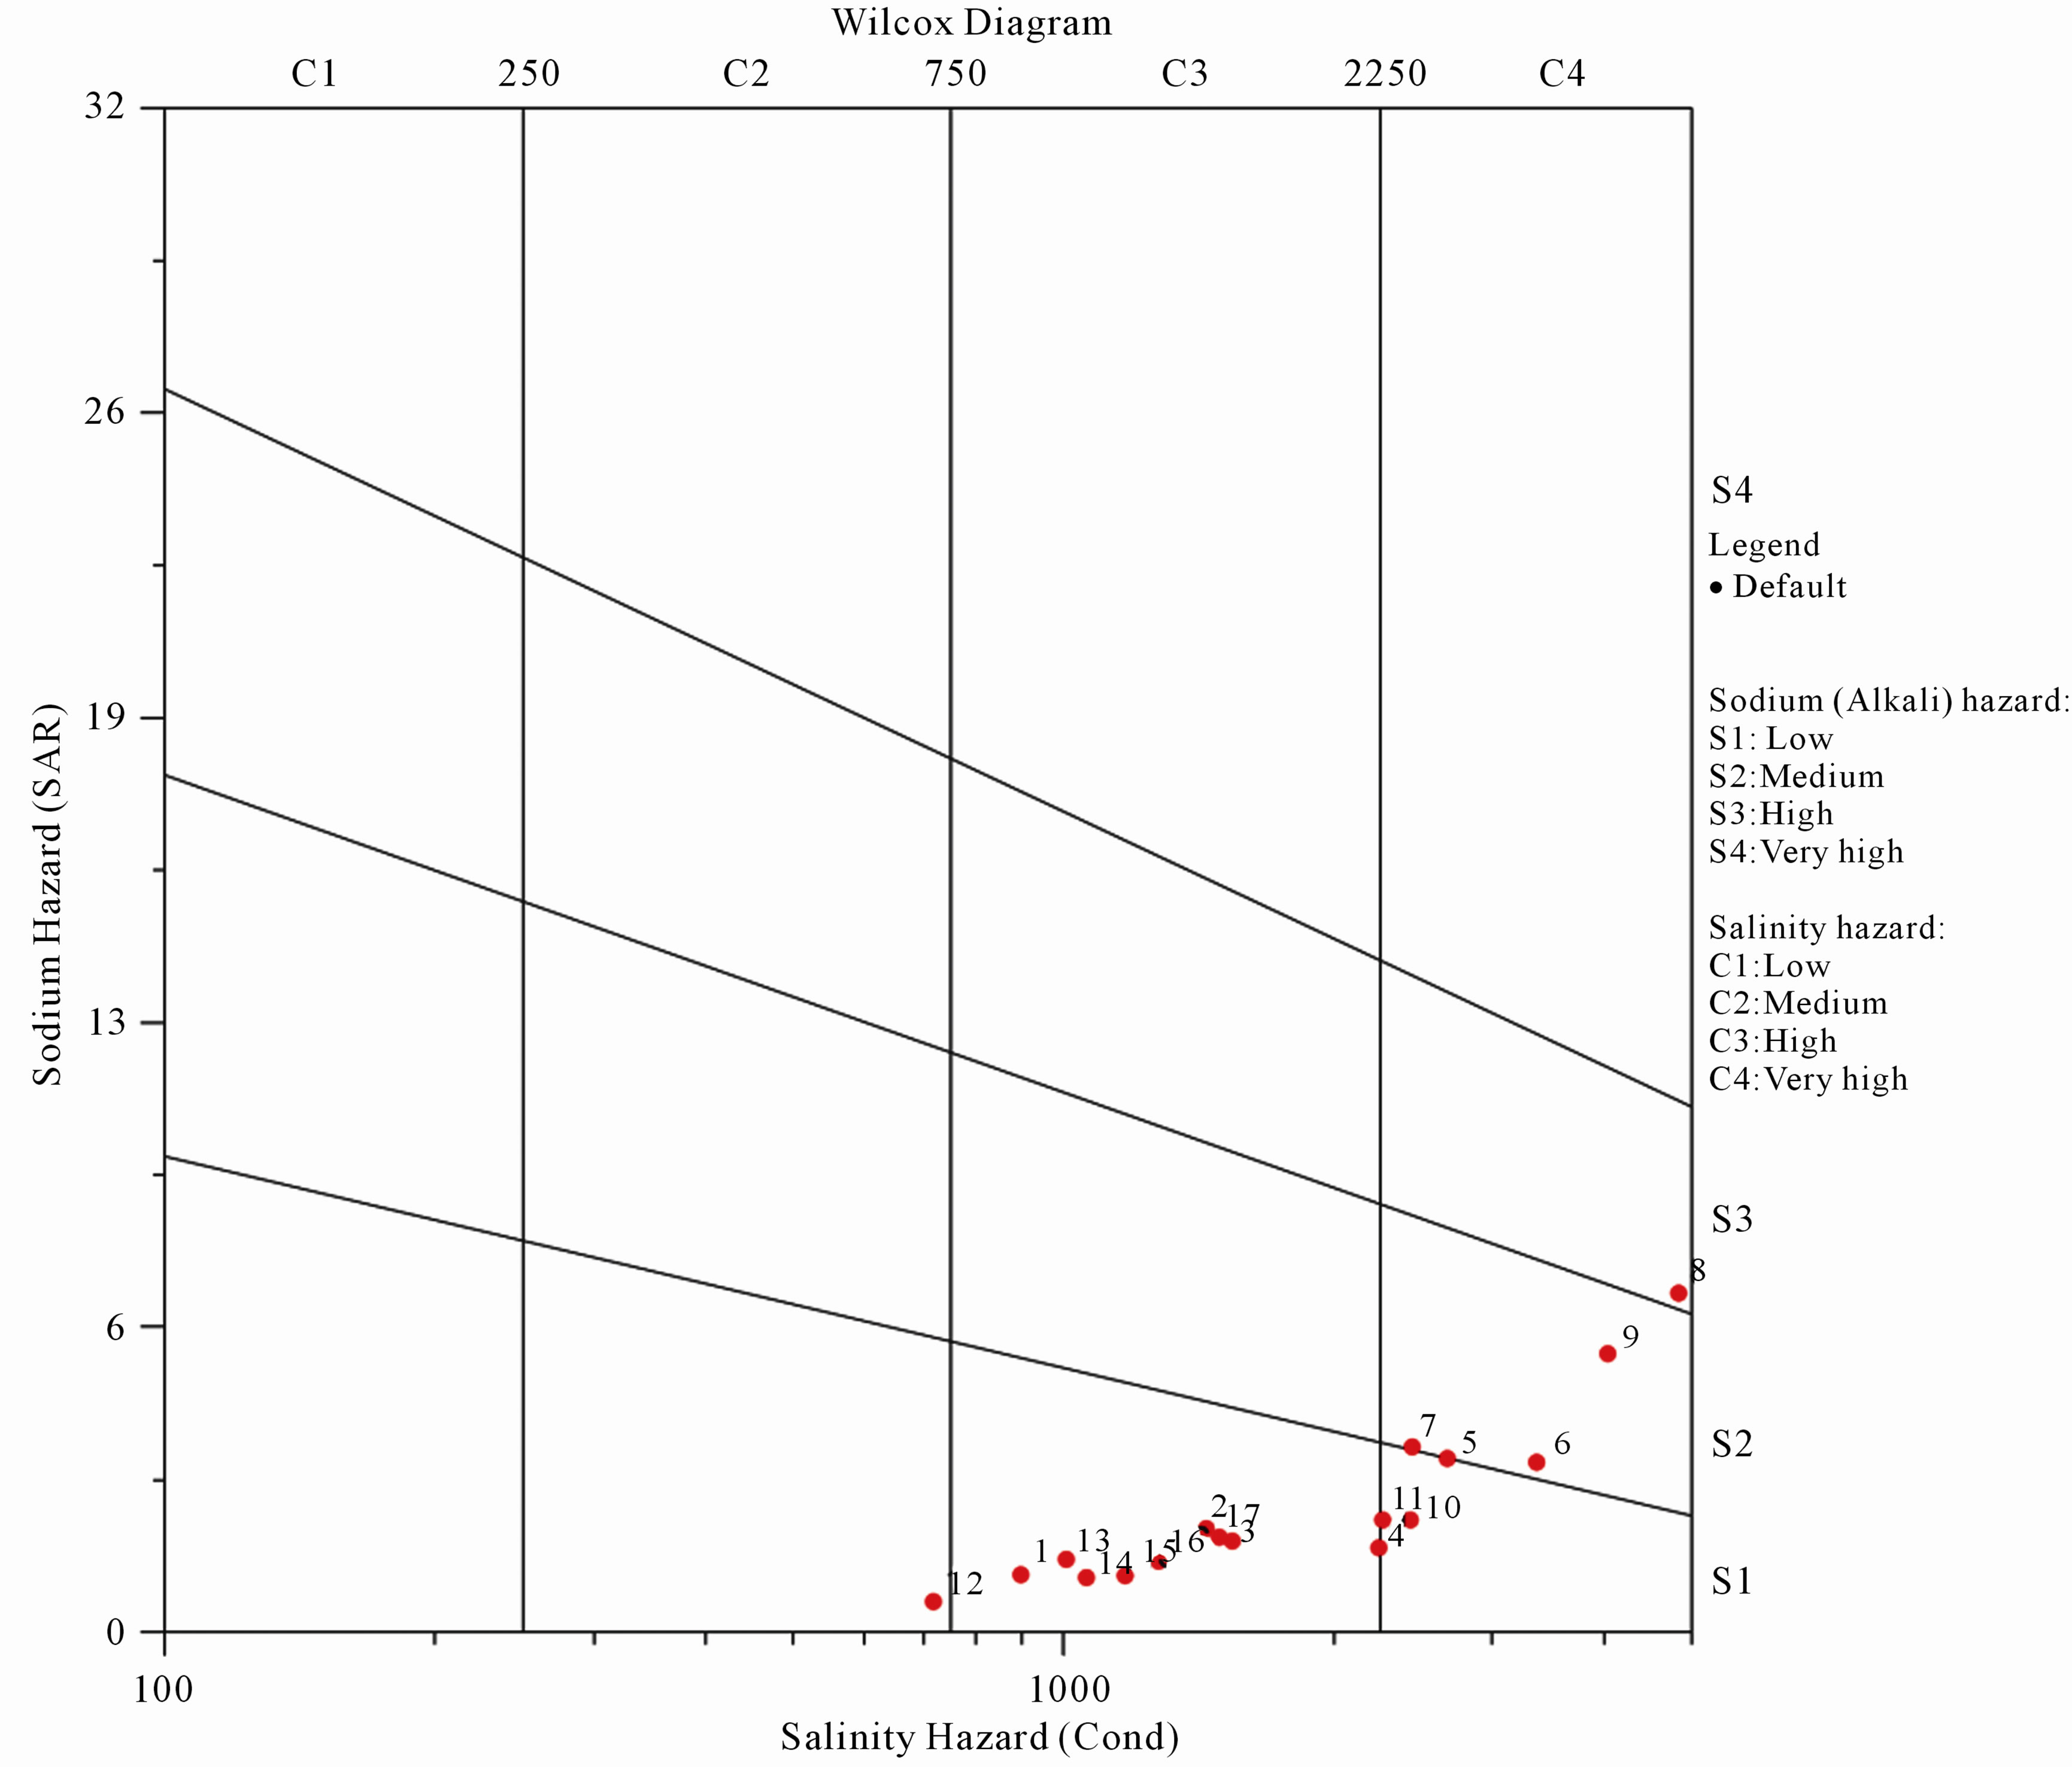
Figure 4. Wilcox classification of the water samples.
area the quality of groundwater is adding more stresses over the agricultural activities. Especially when Banana farming and seasonal crops like Tomato and cucumber are not salt tolerant plants. For example the high nitrate content in the northern part of the study area represents a real hazard for local communities who depend on this groundwater for daily uses.
Desalination is one of the good options to achieve safe water supply, although the cost of desalination cannot be handled by locals.
9. Groundwater Treatment
In order to secure human health the study team developed solar stills which can desalinate and disinfect groundwater producing fresh water that can satisfy the basic needs for drinking and daily use.
A solar still is based on simplifying the water cycle. The saline water goes into the still and the solar energy penetrates the glass surface causing water heat up similar to the greenhouse effect. The evaporated water inside the solar still leaves all contaminants and microbes, to be condensed on the underside of the glass and ran down to be collected as pure water [15].
Solar still represents a potential tool for fresh water supply in the study area climatic conditions, when the yearly sunshine duration is around ten hours and the long term average maximum temperature is 30.6˚C and the minimum average temperature is 19˚C [16].
Solar still design:
One still unite were designed and installed as a composed of Water basin, Metal support structure, Glazing, distillate trough and insulation, as well the surface area was 2 m2.
Ÿ The water basin was made of low solubility smooth surface black material PVC, able to absorb sunlight and convert it to heat. In order to prevent heat flow out of the system; rock wool was used which is a cheap local option.
Ÿ Glazing of the system: it is simply ordinary transparent window glass treated by ammonia to remove the oily film applied in the glass factory.
Ÿ The collection system as a distillate trough is located at the base of the tilted glazing and it was designed as a small canal from the same materials of the water basin.
Ÿ The piping system is important to feed the system with water and to discharge the treated water for this part of the system PVC pipes were used.
10. Solar Still Performance
Properly operating still requires supplying of three times as much make-up water as the distillate water produced each day [15].
Solar still productivity is a factor of solar radiation and the system design, productivity varies between winter and summer, and maximum productivity was recorded at mid of the day.
Figure 5 below shows the average productivity of the still during the day, the system daily average of high
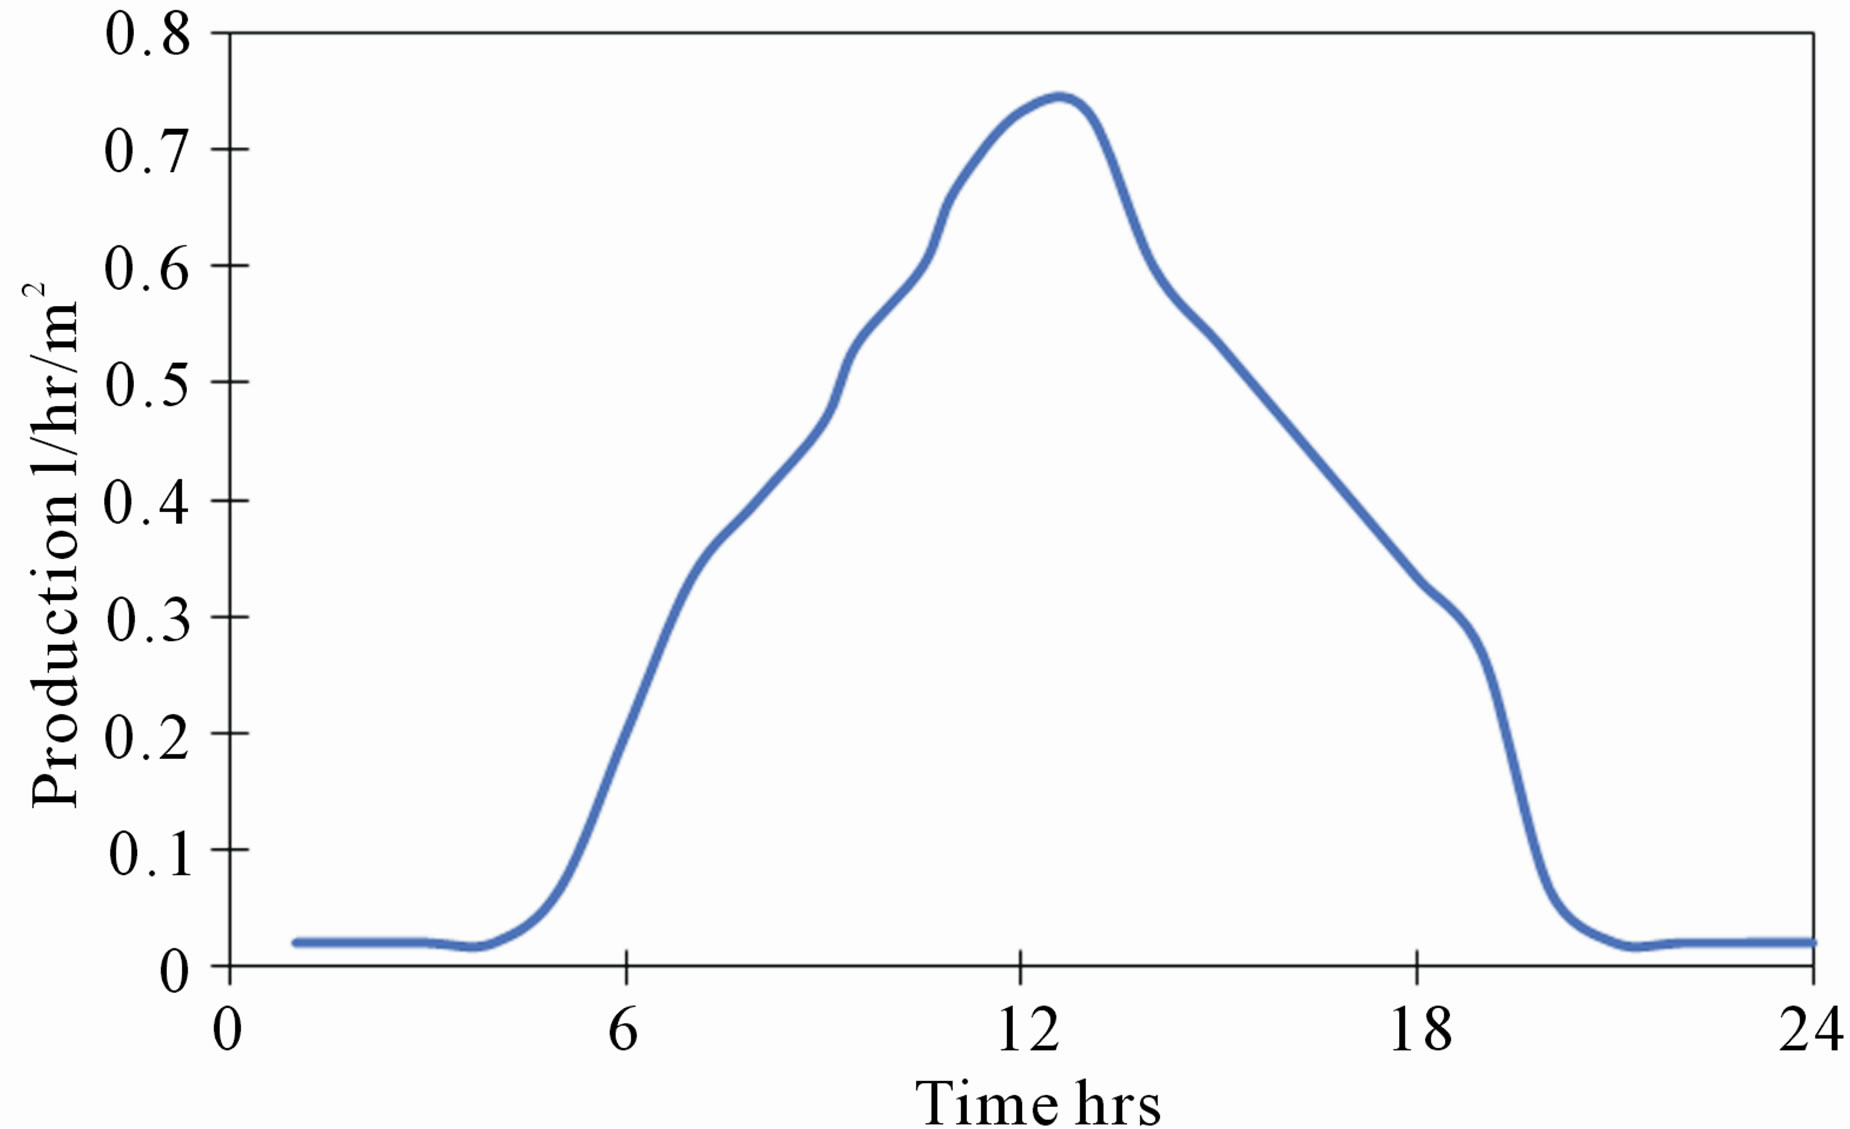
Figure 5. Average solar still productivity in 24 hours in l/hr/m2.
quality water productivity was around 7.5 l/m2. The water has been used for the test was supplied from a groundwater well, salinity 3360 µS/cm and 48 mg/l of nitrate.
The still was operated from April to May; the average output water salinity was EC 52 µS/cm with no nitrate content.
The Capital cost for the still is around 50 USD per square meter; low maintenance required and can last for 10 years which make it suitable for local communities in rural areas.
Taking in consideration that the average families in the study area are with 7 members [17] that means they need 14 liter of fresh drinking water which can be supplied by installing 2 m2 still and to avoid water shortage in winter time still can be doubled to 4 m2 with a total cost of 200 USD.
11. Discussion and Conclusion
According to the natural conditions in the study area represented by sandy gravel soil combined with gentle slope, shallow water system and high water supply for agriculture, aquifer vulnerability modeling indicates a hot spot of high vulnerability in the northern parts of the study area.
Raising the flag, for an urgent need to involve vulnerability maps to be an important part of land use planning.
Scarce groundwater resources should be protected through reduction of agricultural water supply and reduce fertilizing activities in the vulnerable areas.
To assure safe water supply for farmers and locals who depend on groundwater wells for daily uses, solar distillation provides a visible tool according to the arm climate and long sunshine duration.
With a daily productivity of 7.5 l/m2 solar still can provide fresh water for farmers in acceptable price taking in consideration that solar stills are easily operated and maintained.
REFERENCES
- K. S. Murray and D. T. Rogers, “Groundwater Vulnerability, Brownfield Re-Development and Land Use Planning,” Journal of Environmental Planning and Management, Vol. 42, No. 6, 1999, pp. 801-810.
- J. Vrba and A. Zoporozec, Eds., “Guide Book on Mapping Groundwater Vulnerability,” International Contributions to Hydrogeology (IAH), Hannover, Vol. 16, 1994, 131 Pages.
- R. C. Knox, D. A. Sabatini and L. W. Canter, “Subsurface Transport and Fate Processes,” Lewis Publishers, USA, 1993.
- M. Fortin, K. P. B. Thomson and G. Edwards, “The Role of Error Propagation for Integrating Multisource Data within Spatial Models: The Case of the DRASTIC Groundwater Vulnerability Model,” Earth Surface Remote Sensing Procedure SPIE Conference, London, 30 December 1997, pp. 358-361.
- T. G. Fritch, et al. “An aquifer Vulnerability Assessment of the Paluxy Aquifer, Central Texas, USA, Using GIS and a Modified DRASTIC Approach,” Environmental Management, Vol. 25, No. 3, 2000, pp. 337-345.
- A. H. Jasem and M. Alraggad, “Assessing Groundwater Vulnerability in Azraq Basin Area by a Modified DRASTIC Index,” Journal of Water Resource and Protection, Vol. 2, 2010, pp. 944-951. doi:10.4236/jwarp.2010.211112
- R. A. Freeze, and J. A. Cherry, “Groundwater,” PrenticeHall Inc., New Jersey, 1979, 604 Pages.
- SPSS 9.2 for Windows, “Statistical Package for the Social Sciences,” Lead Technologies, Inc., Chicago, 2007.
- D. R. Helsel and R. M. Hirsch. “Statistical Methods in Water Resources,” USGS, 2002.
- L. V. Wilcox, “Classification and Use of Irrigation Waters,” United States Department of Agriculture Cir. 969, Washington DC, 1955, 19 Pages.
- A. Saleh, F. Al-Ruwaih and M. Shehata, “Hydrogeochemical Processes Operating within the Main Aquifers of KUWAIT,” Journal of Arid Environments, Vol. 42, 1999, pp. 195-209. doi:10.1006/jare.1999.0511
- K. P. Karanth, “Hydrogeology,” McGraw-Hill Publishers, New Delhi, 1989.
- K. P. Karanth, “Impacts of Human Activities on Hydrogeological Environments,” Journal of the Geological Society of India, Vol. 38, 1991, pp. 195-206.
- A. K. Singh, G. C. Mondal, P. K. Singh, S. Singh, T. B. Singh and B. K. Tewary, “Hydrochemistry of Reservoirs of Damodar River Basin: Weathering Processes and Water Quality Assessment,” Environmental Geology, Vol. 48, No. 8, 2005, pp. 1014-1028. doi:10.1007/s00254-005-1302-6
- R. E. Foster and W. Amos, “Ten Years of Solar Distillation Application along the US.-Mexico Border,” 2005.
- Ministry of Water and Irrigation (MWI) Open Files, Jordan, 2010.
- Department of Statistics Open Files, Jordan, 2010.