Journal of Water Resource and Protection
Vol. 3 No. 11 (2011) , Article ID: 8681 , 12 pages DOI:10.4236/jwarp.2011.311091
Physico-Chemical Assessment of Euphrates River between Heet and Ramadi Cities, Iraq
1Department of Applied Geology, University of Anbar, Ramadi, Iraq
2Department of Biology, University of Anbar, Ramadi, Iraq
E-mail: *ealheety@yahoo.com
Received August 14, 2011; revised September 15, 2011; accepted October 16, 2011
Keywords: physical parameters, chemical parameters, Euphrates River, Iraq
ABSTRACT
The physico-chemical parameters of Euphrates River water were studied between Heet and Ramadi cities during November 2008 to June 2009. Water were samples collected from eleven stations and analyzed for Temperature, Turbidity, Electrical conductivity (EC), Total suspended solids (TSS), pH, Total dissolved salts (TDS), Dissolved oxygen (DO), Biochemical oxygen demand (BOD), Calcium, Potassium, Sodium, Sulphate, Phosphate, Bicarbonates, Chloride, Nitrate and Total hardness. The observed values of these physico-chemical parameters were compared with WHO standards. Some parameters (Turbidity, TSS, TDS, BOD, Calcium, Sodium and Total hardness) exceeded the permissible limits of WHO standards, while other parameters were within the permissible limits. Statistical studies have been carried out by calculating correlation coefficients between different pairs of parameters. Monthly and spatial variations of physico-chemical parameters were investigated.
1. Introduction
Rivers are vital and vulnerable fresh water systems that are critical for the sustenance of all life. However, the declining quality of the water in these systems threatens their sustainability and is therefore a cause for concern [1]. Worldwide, pollution of rivers and streams has become one of the most crucial Environmental problems of the 20th century [2]. Increasing water pollution causes not only the deterioration of water quality, but also threatens human health and the balance of aquatic Ecosystems, Economic development and social prosperity [3]. The health of water body is assessed using several Physical, Chemical and Biological parameters [4]. The surface water chemistry of a river at any point reflects several major influences, including the lithology of the basin, atmospheric inputs, Climatic condition, and anthropogenic inputs [5,6].
The present study aimed to investigate Physico-Chemical parameters in the Euphrates River.
2. Material and Methods
2.1. Area of Study
The study area is located in Al-Anbar governorate between latitudes 33˚24' - 33˚39'N and longitudes 42˚47' - 43˚16'E, (Figure 1). The area includes the two largest urban centers in Al-Anbar governorate (Ramadi and Heet cities).
2.2. Sample Collection
The water samples were collected during the period from November 2008 to June 2009 from eleven stations, (Figure 2). The water samples were collected from a depth of 30 cm beneath the river surface. They have been done once a month and the sample were placed in clean polyethylene bottles and stored in ice containers.
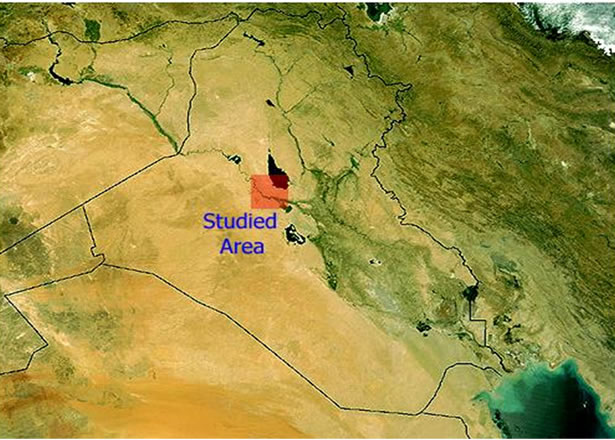
Figure 1. Location map of the studied area.
2.3. Physico-Chemical Analysis
PH, temperature , electrical conductivity , total dissolved solid (TDS) and dissolved oxygen (DO) were determined at the time of sampling in the field using pH meter, WTW model, portable EC meter, WTW model and portable HANNA dissolved Oxygen meter and HI9142 model, respectively. Total suspended solid (TSS), Turbidity, Biological Oxygen demand (BOD), Ca2+, Na+, K+,  ,
,  ,
,  , Cl–,
  and total hardness were determined according to APHA [4]. Statistical analysis of the Physico-Chemical parameters data was carried out to present monthly and spatial values for these parameters. Pearson’s correlation coefficient (r) was used to show correlation between the all parameters data using statistica 8 software.
3. Results and Discussion
3.1. Physico-Chemical Parameters Data
A summary of the physico-chemical parameters obtained in Euphrates River for the sampling sites at the period from November 2008 to June 2009 were shown in Table 1. Results of calculating Pearson’s correlation coefficient were listed in Table 2.
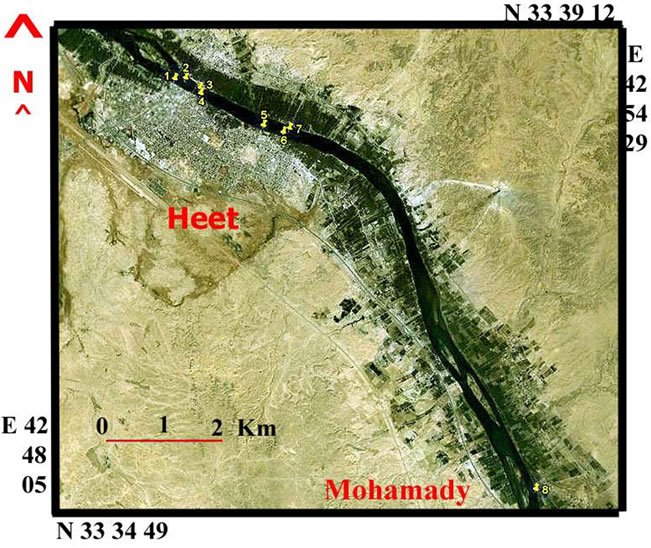
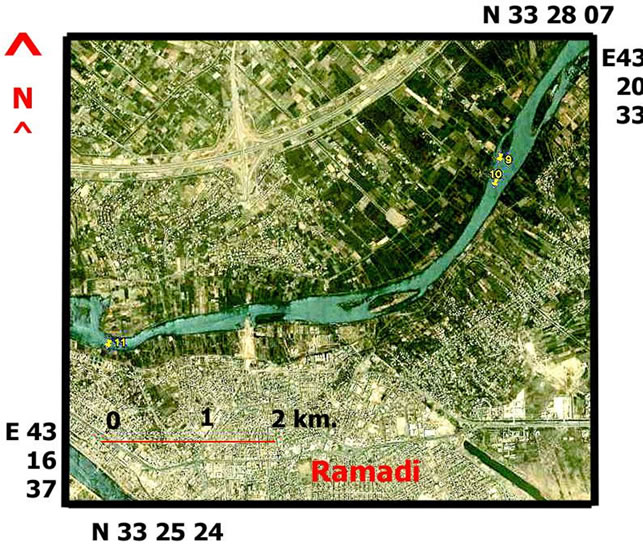
Figure 2. Locations of the sampling stations.
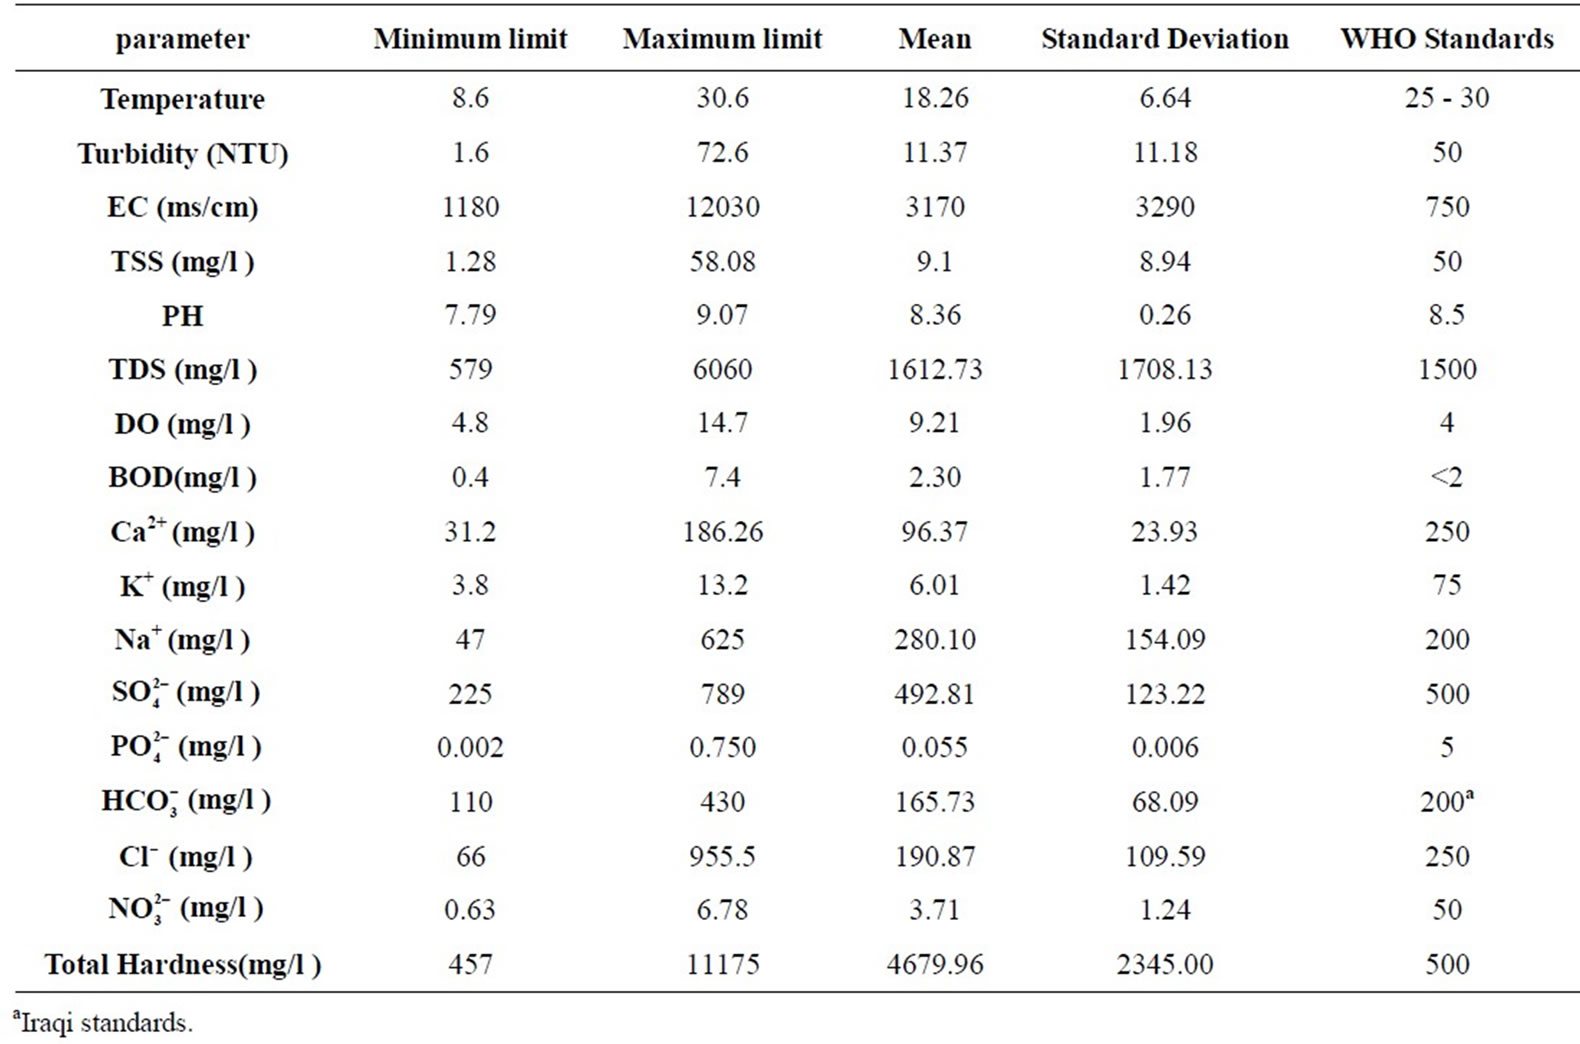
Table 1. Physico-chemical parameters of Euphrates River water between Heet and Ramadi cities.
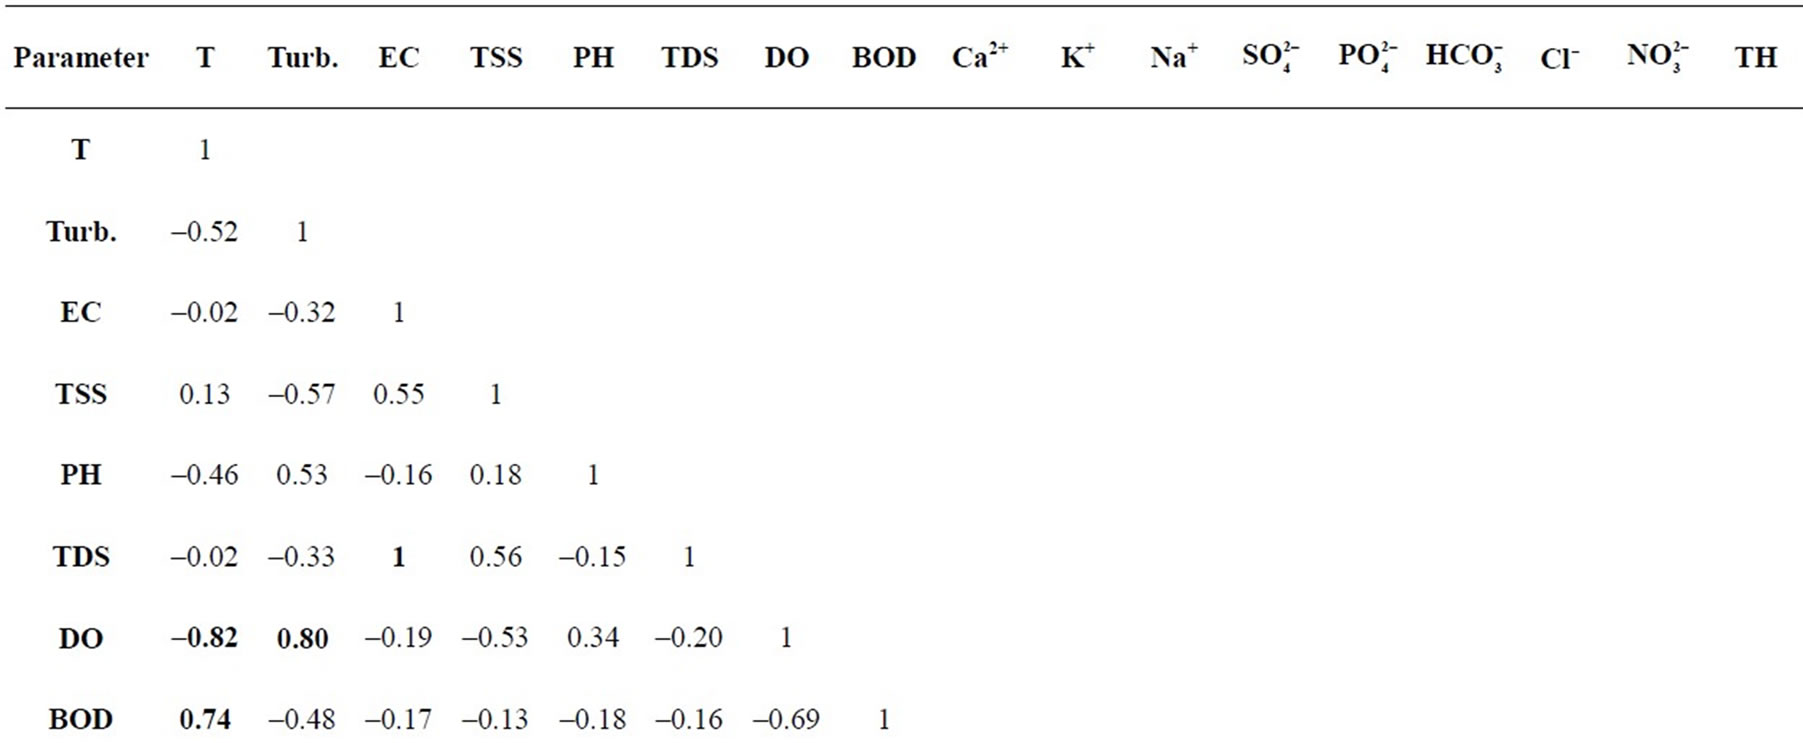
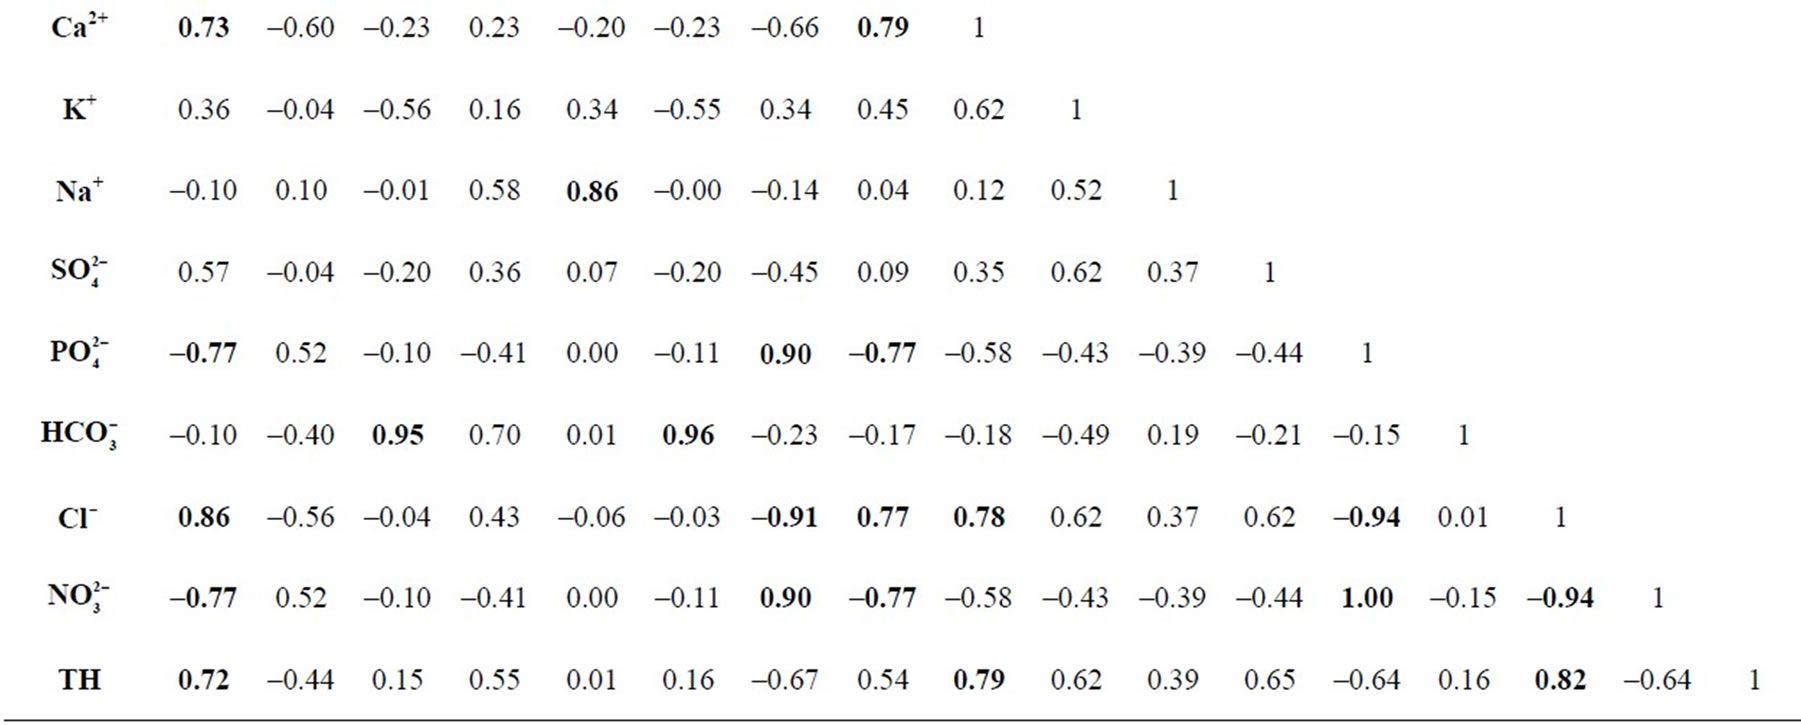
Table 2. Correlation coefficient between the physico-chemical parameters in the Euphrates River.
The temperature varied between 8.6˚C and 30.6˚C with a mean of 18.2˚C. Temperature of water may not be as important because of the wide range of temperature tolerance in aquatic life, but in polluted water, temperature can have profound effects on dissolved oxygen (DO) and biological oxygen demand (BOD) [7]. The fluctuation in river water temperature usually depends on the season, geographic location, sampling time and temperature of effluents entering the stream [8]. Summer maxima and winter minima were observed at all the sites with the marginal variation. Temperature showed significant positive correlation with Cl– and also showed slight positive correlation with BOD and significant negative correlation with DO. Turbidity in water is caused by suspended and colloidal matter such as clay, silt, finely divided organic and inorganic matter, and plankton and other microscopic organisms. The observed turbidity ranged from 1.6 to 72.6 NTU with mean of 11.3 NTU. The mean value is higher than 5NTU recommended limit by WHO [9]. Significant positive correlation was found with DO. Electrical conductivity is a measure of the ability of an aqueous solution to carry an electric current. This depends on the presence of ions, on their total concentration mobility, valence and the water temperature. The conductivity has significant positive correlation with TDS and . Total suspended solids (TSS) are very small particles, including silt, plankton and industrial wastes, remaining dispersed in a water due to turbulent mixing than can create turbid or cloudy conditions. TSS is a measure of the suspended solids in waste water, effluent, or water bodies. The values of TSS ranged from 1.28 to 58.08 mg/l with a mean of 9.1 mg/l. The mean value exceeds the permissible limit of WHO standards (Table 1). PH of aquatic ecosystem depends on chemical and biological activity of water. Natural waters usually have PH highest than 7. The pH values were ranging from 7.79 to 9.07 with a mean value of 8.36. The maximum limit exceeds the permissible limit and the mean value of PH was found within the permissible limit of WHO standards (Table 1). Significant positive correlation with Na+ was found.
Total Dissolved Solids (TDS) are the total amount of mobile charged ions, including minerals and salts. TDS is directly related to the purity of water and the quality of water purification systems. The values of TDS ranged from 579 to 6060 mg/l with an arithmetic mean of 1612.73 mg/l. The maximum value and the mean value of TDS exceed the permissible limit of WHO standards (Table 1). Significant positive correlation with  was found. Dissolved Oxygen (DO) in water is the vital gas for aquatic organisms. DO is consumed in water from the decomposition of organic matters. DO depends on water temperature, partial pressure of oxygen in atmosphere and contents was in the range between 4.8 to 14.7 mg/l with a mean value of 9.2 mg/l. The DO value was within the permissible limit of WHO (Table 1). The average value of DO levels 6.5 mg/l indicates the average quality of river water [10]. Significant positive correlation with Phosphate (
 ) and Nitrate (
 ) was found. Significant negative relation was also found with Chloride (Cl–). Biological Oxygen Demand (BOD) is a measure of the oxygen in water that is required by the aerobic organisms. The biodegradation of organic materials exerts oxygen tension in water and increases the biochemical oxygen demand [11]. The BOD values ranged from 0.04 to 7.40 mg/l with a mean value of 2.3 mg/l. The mean value exceeds the permissible limit of WHO standards. Significant positive correlation with Ca2+ and Cl– was found. Significant negative correlation with Phosphate and Nitrate was also found. Calcium occurs naturally in water. It may dissolve from rocks such as limestone, marble, dolomite, gypsum, etc. Rivers generally contain 1 - 2 ppm calcium, but in lime areas rivers (Euphrates River), they may contain calcium concentration as high as 100 ppm. Calcium is an important determinant of water hardness and it also functions as a pH stabilizer because of its buffering qualities. Calcium also gives water a better taste. The calcium values ranged from 31.2 to 186.26 mg/l with a mean value of 96.37 mg/l. The mean value exceeds the permissible limit of WHO standards. Significant positive correlation with chloride and total hardness was found. Rivers generally contain about 2 - 3 ppm potassium. Potassium compounds are applied in fluid soap production, detergents, softeners, green soap, desulphurization of oil and carbon dioxide absorbers. Potassium compounds may end up in wastewater through urine. The potassium values in the Euphrates River are from 3.8 to 13.20 mg/l with a mean value of 6.01 mg/l. Potassium showed slight positive correlation with sulphates, chloride and total hardness. Rivers contain only about 9 ppm sodium. Drinking water usually contains about 50 mg/l sodium. Not only seas, but also rivers and lakes contain significant amounts of sodium. Sodium compounds serve many different industrial purposes and may also end up in water from industries. The sodium values in the Euphrates River ranged from 47 to 625 mg/l with a mean of 280.10 mg/l. The mean value exceeds the permissible limit of WHO standards. The sulphates content of natural water is an important consideration in determining their suitability for public and industrial supplies. Most of sulphates are dissolved in water and come in water from oxidation of sulphates ores. The atmosphere of industrial districts polluted with oxides of S influenced the growth of concentration of sulphates in surface waters. Concentrations of sulphates were 225 to 789 mg/l with a mean value of 482.81 mg/l. The mean value was within the permissible limit of WHO standards. Sulphates showed slight positive correlation with chloride. Phosphate is chemical compounds that contain phosphorus. Phosphorus is a non-metallic element which is necessary for life and is found in rock as inorganic phosphates. Inorganic phosphates are a plant nutrient. These phosphates become detrimental when they over fertilize aquatic plants and cause eutrophication. Manmade sources of phosphates include human sewage, agricultural run-off from crops, sewage from animal feedlots, pulp and paper industry, vegetable and fruit processing, chemical and fertilizers manufacturing, and detergents. Natural waters have a phosphorus concatenation of approximately 0.02 ppm which is a limiting factor for plant growth [12]. Concentrations of phosphate were from 0.002 to 0.75 mg/l with a mean value of 0.055 mg/l. The mean value is within acceptable limits set by WHO standards. Phosphates showed significant positive correlation with nitrate and significant negative correlation with chloride. Nitrate determination is important in assessing the potential biological productivity of surface waters. Nitrate levels in drinking water can be an indicator of overall water quality. Elevated nitrate levels may suggest the possible presence of other contaminants such as disease—causing organisms, pesticides, or other inorganic and organic compounds that could cause health problems. Nitrate concentrations were from 0.63 to 6.78 mg/l with mean value of 3.71 mg/l. Nitrate level was within the permissible limits of WHO standards. Chlorides have constituted almost of anions of natural water which may come as pollution across sanitary and Indus-trial waters. Concentration of chlorides in the natural waters is variable. Concentration of chloride in the Euphrates River ranged from 66 to 955.5 mg/l with a mean value of 190.87 mg/l. The mean value was within the permissible limits of WHO standards. Chloride showed significant positive correlation with total hardness and also showed significant negative correlation with nitrate. Bicarbonate is alkaline, and a vital component of the pH buffering system of the human body. Many bicarbonates are soluble in water, in particular sodium bicarbonate contributes to TDS. Concentration of bicarbonate was from 110 to 430 mg/l with a mean value of 165.73 mg/l. The mean value was within the permissible limits of Iraqi standards. Significant positive correlation with TDS was found. Total hardness is an important consideration in determining the suitability of water for domestic and industrial uses. Hardness is caused by multivalent metallic cations and with certain anions present in water. The hardness values in the Euphrates River ranged from 457 to 11,175 mg/l with a mean value of 4679.69 mg/l. The mean value of hardness exceeds the permissible limit of WHO standards.
3.2. Monthly Variation of Physico-Chemical Parameters
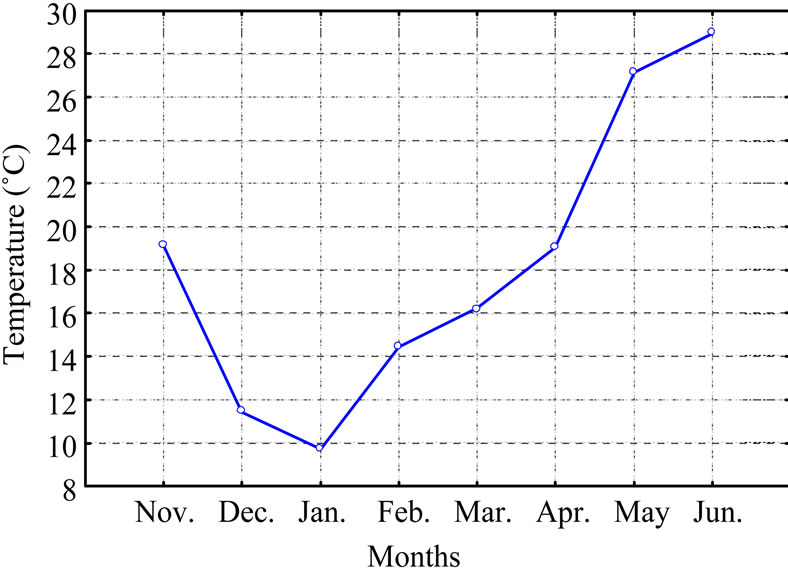
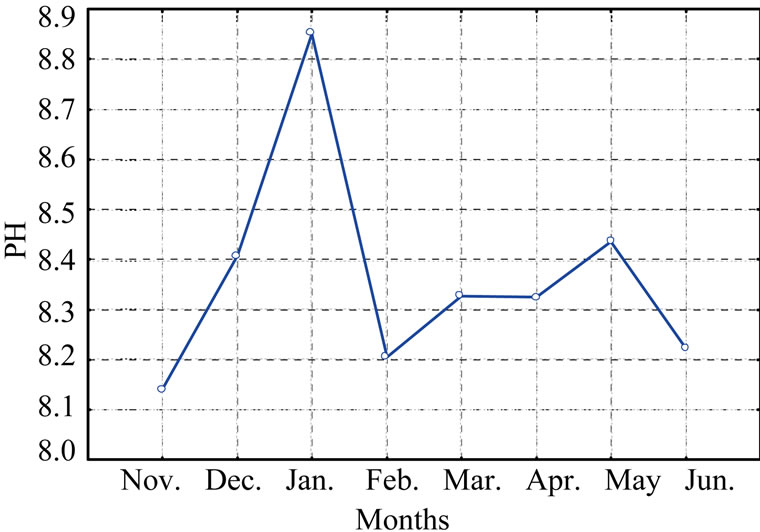
The monthly variations of physical parameters (Temperature, Turbidity, Electrical conductivity and Total suspended solids) were given in Figure 3. The temperature varies between 9.7˚C (January 2009) and 28.94˚C (June 2009), Figure 3(a). Turbidity varies between 6.97 mg/l NTU (June 2009) and 17.21 NTU (January, 2009), Figure 3(b). Electrical conductivity varies from 1122 µs /cm (January & February, 2009) and 11,340 µs/cm (April, 2009), Figure 3(c). Total suspended solids (TSS) vary monthly between 5.18 mg/l (April, 2009) and 13.77 mg/l (January, 2009), Figure 3(d). The monthly variations of chemical parameters of the Euphrates River in the study area were given in Figure 4. The PH varies from 8.14 (November, 2008) and 8.85, Figure 4(a). TDS varies from 612.54 mg/l (January, 2009) and 5886.36 mg/l (April, 2009), Figure 4(b). Monthly variations of DO ranged between 6.9 mg/l (January, 2009) and 11.59 mg/l (January, 2009), Figure 4(c). Monthly variations of BOD ranged
 (a)
(a)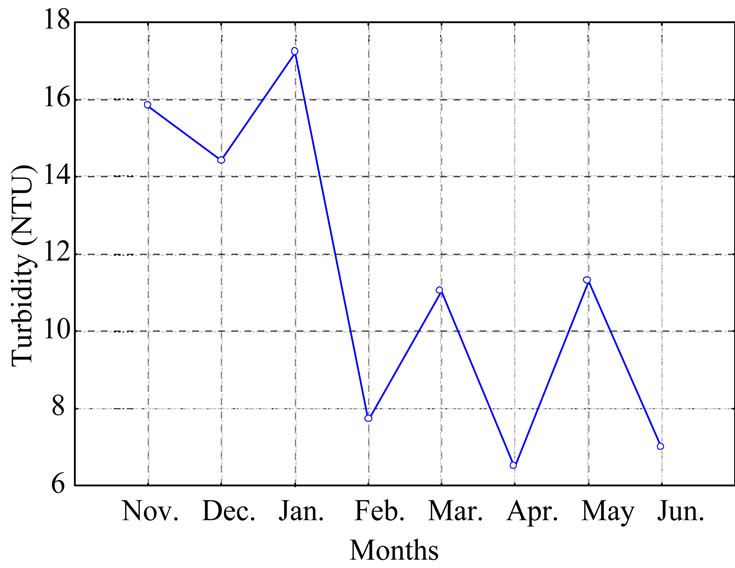 (b)
(b)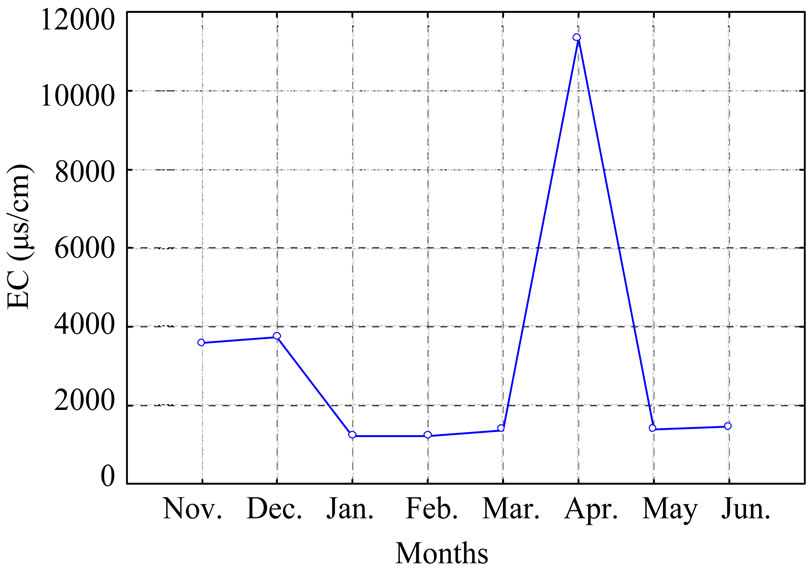 (c)
(c)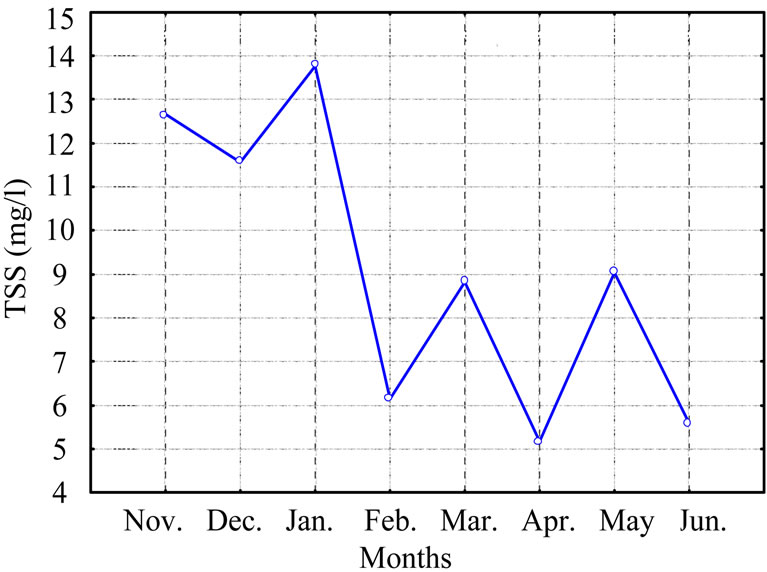 (d)
(d)
Figure 3. Monthly variation of the physical parameters of Euphrates River in the study area.
 (a)
(a)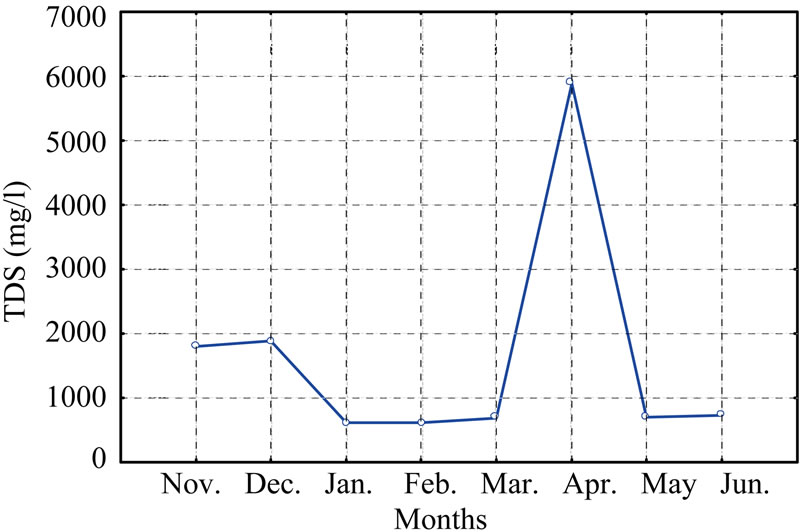 (b)
(b)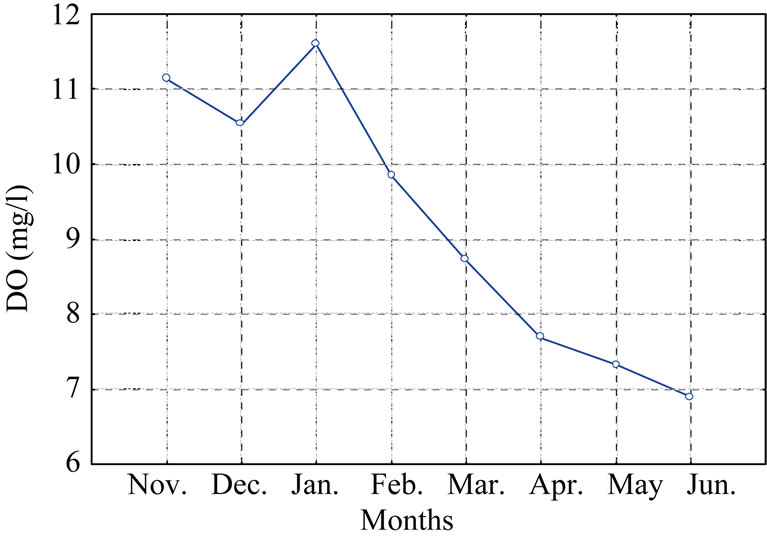 (c)
(c)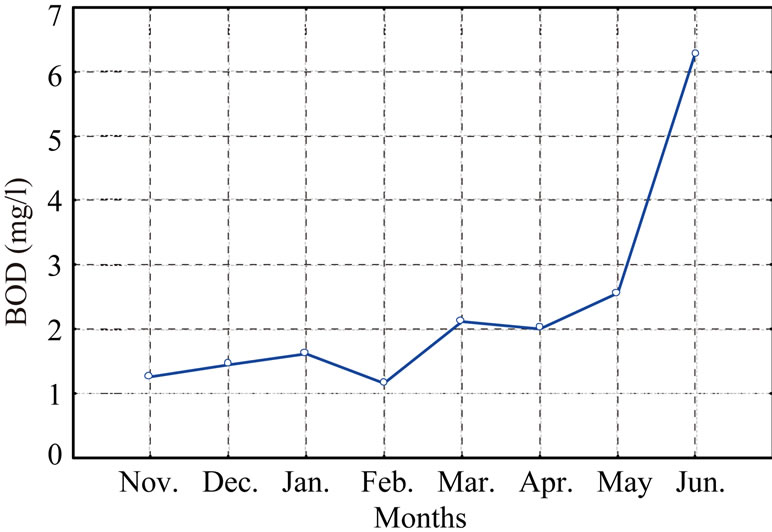 (d)
(d)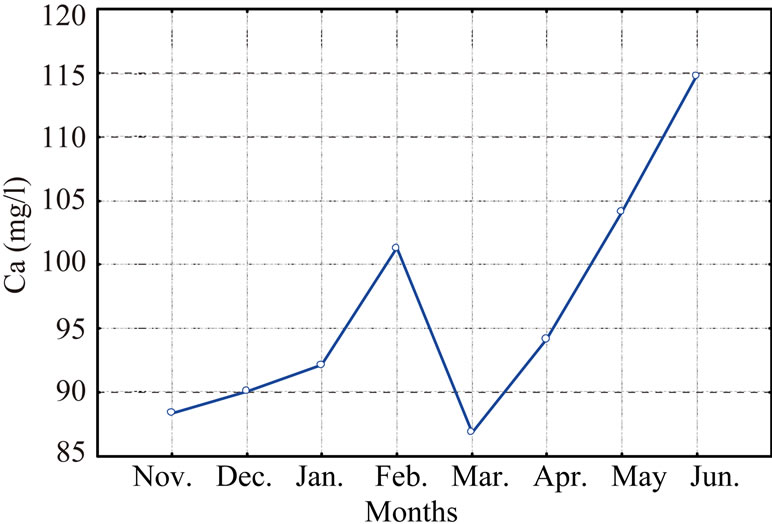 (e)
(e)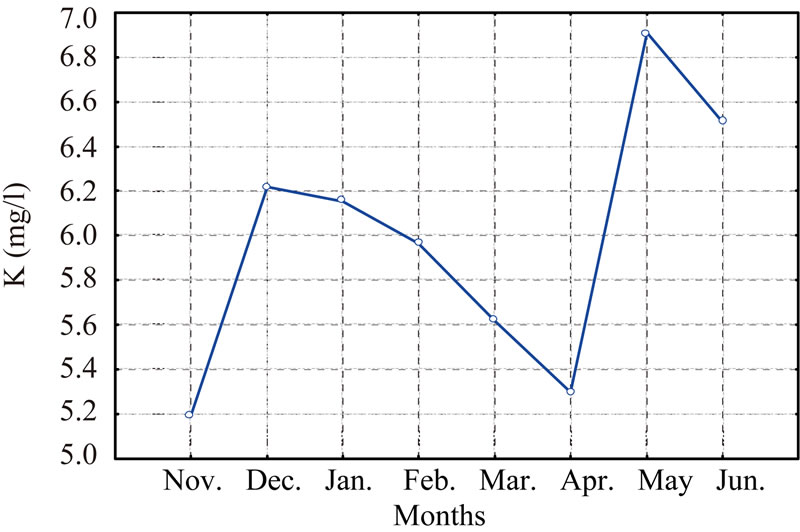 (f)
(f)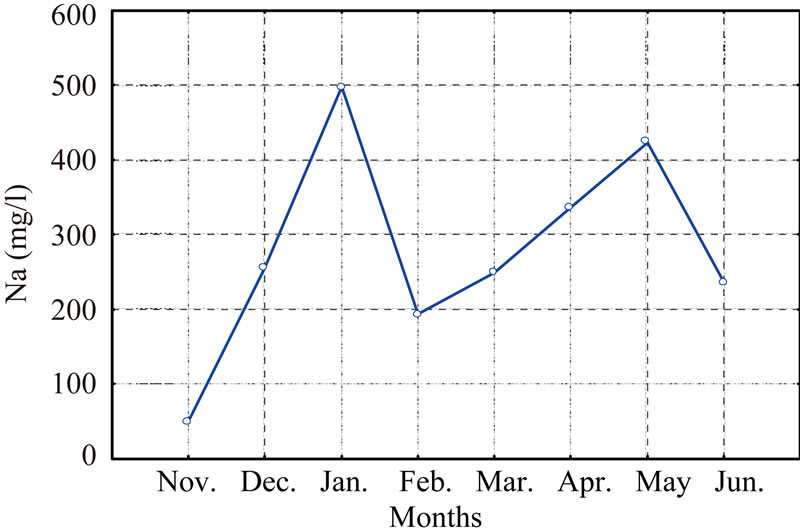 (g)
(g)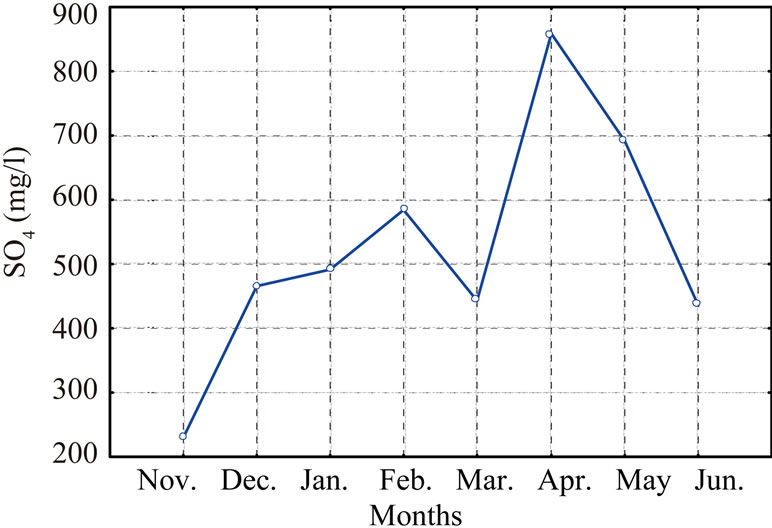 (h)
(h)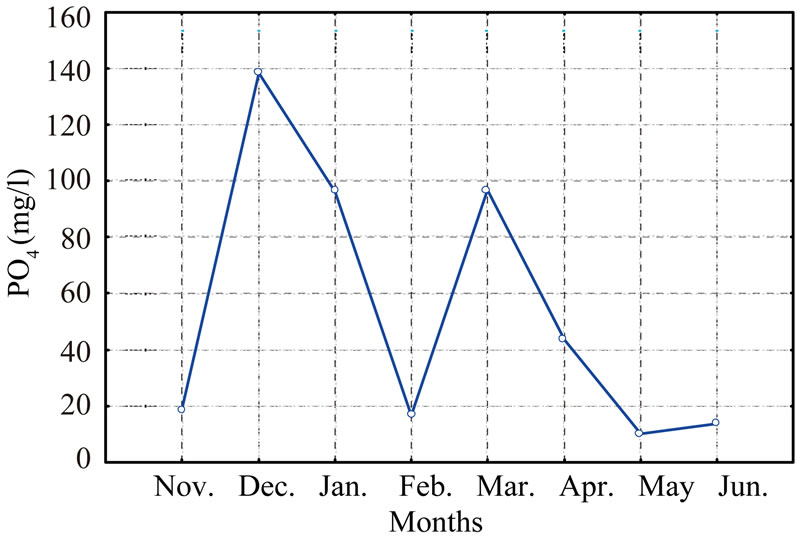 (i)
(i)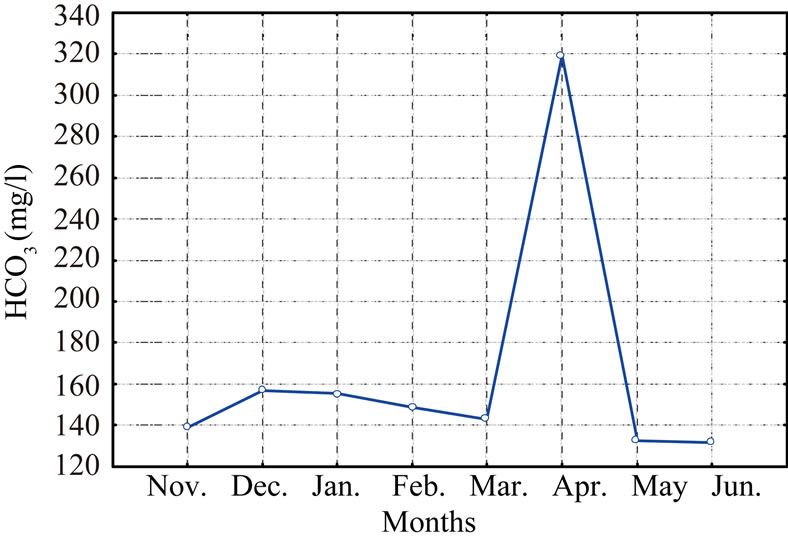 (j)
(j)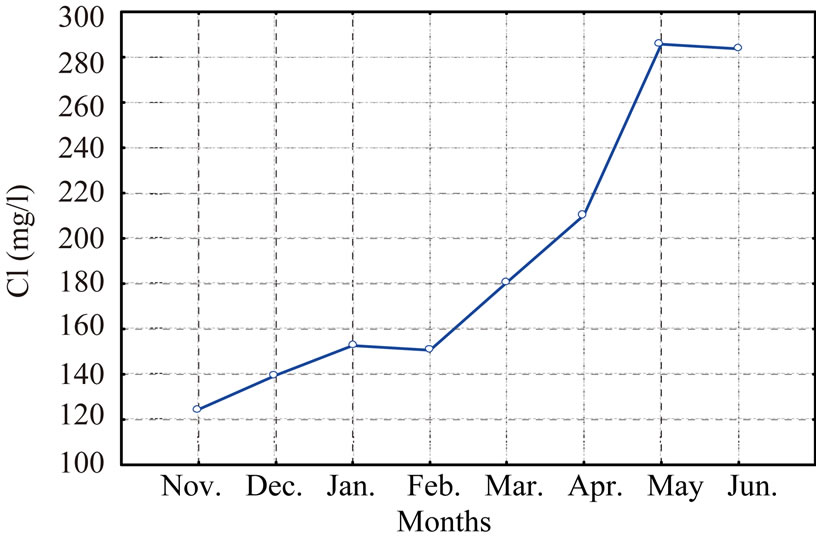 (k)
(k)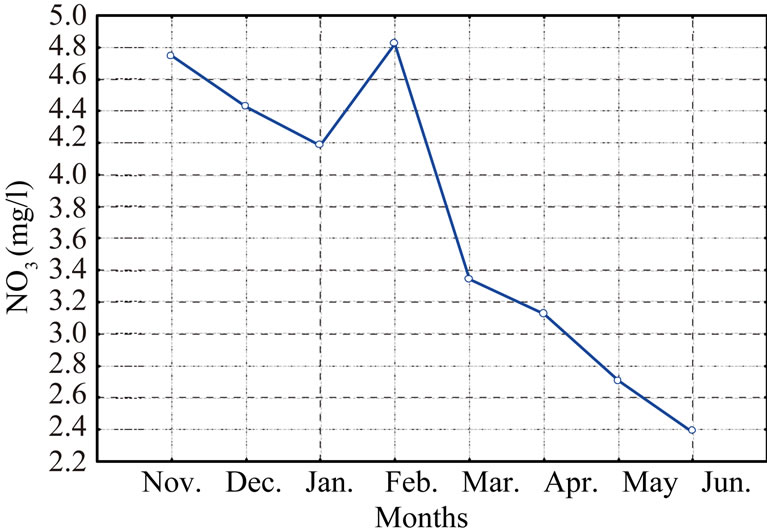 (l)
(l)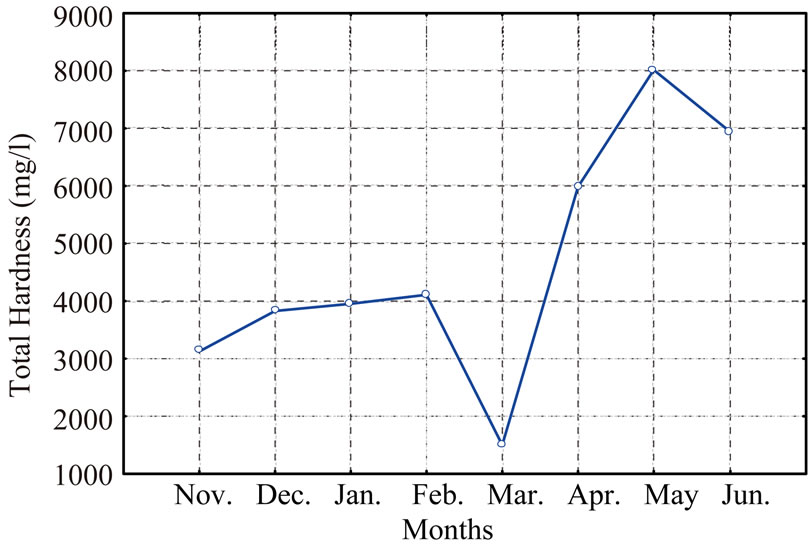 (m)
(m)
Figure 4. Monthly variation of chemical parameters of Euphrates River in the study area.
between 1.15 mg/l (February, 2009) and 6.26 mg/l (June, 2009), Figure 4(d). Monthly variation of calcium ranged from 88.38 mg/l (November, 2008) and 114.83 mg/l (June, 2009), Figure 4(e). Potassium concentrations varied from 5.19 mg/l (November, 2008) to 6.90 mg/l (May, 2009) Figure 4(f). Monthly variations of sodium ranged from 50 mg/l (November, 2008) to 497.81 mg /l (January, 2009), Figure 4(g). Sulphate concentrations ranged from 354.54 mg/l (January, 2009 ) to 629.09 mg/l (November, 2008), Figure 4(h). Monthly variations of Phosphate ranged between 0.001 mg/l (May, 2009) and 0.138 mg/l (December, 2008), Figure 4(i). The minimum value of Bicarbonate was in (June, 2009) and the maximum in (April, 2009), Figure 4(j). Monthly variations of Chloride ranged between 124.27 mg/l (November, 2008) and 285.69 mg/l (May, 2009), Figure 4(k). Monthly variations of Nitrate ranged between 2.38 mg/l (June, 2009) and 4.82 mg/l (February, 2009), Figure 4(l). Monthly the hardness varied from 1500.54 mg/l (March, 2009) to 8006.81 mg/l (May, 2009), Figure 4(m).
3.3. Spatial Variation of Physico-Chemical Parameters
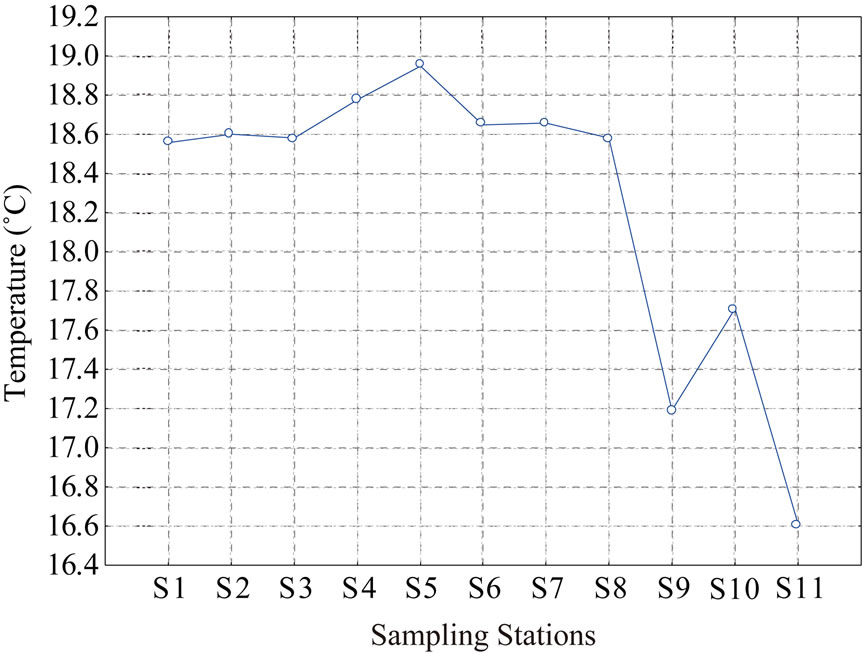
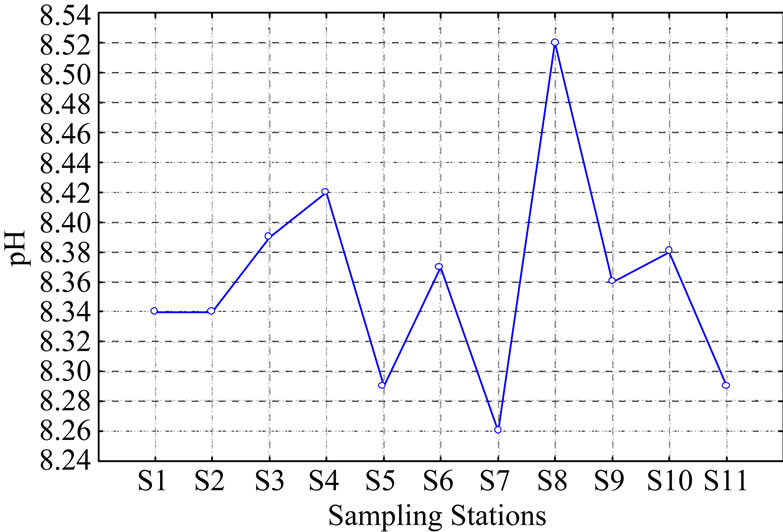
Spatial variations of physical parameters of Euphrates River in the study area were given in Figure 5. The temperature varies between 16.61˚C (S11) and 18.9˚C (S5), Figure 5(a). Turbidity values ranged from 6.69 NTU (S6) to 27.06 NTU (S11), Figure 5(b). Spatial variation of EC was given in Figure 4(c), the maximum value was 3300 µs/cm (S4) and the minimum value was 2830 µs/cm (S9), Figure 5(c). Total Suspended Solids (TSS) levels varied from 5.86 mg/l (S3) to 21.65 mg/l (S11), Figure 5(d). Spatial variations of chemical parameters of Euphrates River in the study area were given in Figure 6. The PH values varied between 8.26 (S7) and 8.52 (S8), Figure 6(a). TDS concentrations varied between 1566.62 mg/l (S8) and 1653.75 mg/l (S4), Figure 6(b). Spatial variation of DO levels was given in Figure 6(c), and the maximum value was 8.65 mg/l (S1) while the minimum value was 9.95 mg/l (S9). BOD concentrations varies between 1.67 mg/l (S10) and 3.77 mg/l (S7), Figure 6(d). Spatially, calcium concentrations varied from 62.32 mg/l (S5) to 137.34 mg/l (S9), Figure 6(e). Potassium levels of Euphrates River vary between 4.98 mg/l (S2) and 6.91 mg/l (S11), Figure 6(f). Sodium concentration varied from 219.75 mg/l (S11) to 320 mg/l (S2), Figure 6(g). Spatially, sulphate values ranged between 429.75 mg/l (S5) to 566.81 mg/l (S9), Figure 6(h). The level of phosphate ranged between 0.024 mg/l (S9) to 0.115 mg/l (S6), Figure 6(i). The results of bicarbonate showed the lowest value 142 mg/l at (S9) while the highest value was recorded at (S3), Figure 6(j). Spatially, concentrations of chloride ranged between 150.31 mg/l (S7) to 303.27 mg/l (S8), Figure 6(k). The values of nitrate ranged between 2.33 mg/l, (S1) to 4.60 mg/l, (S4), Figure 6(l). Spatially, the levels of total hardness ranged between 3777.12 mg/l, (S7) to 5488.62 mg /l, (S1), Figure 6(m).
 (a)
(a)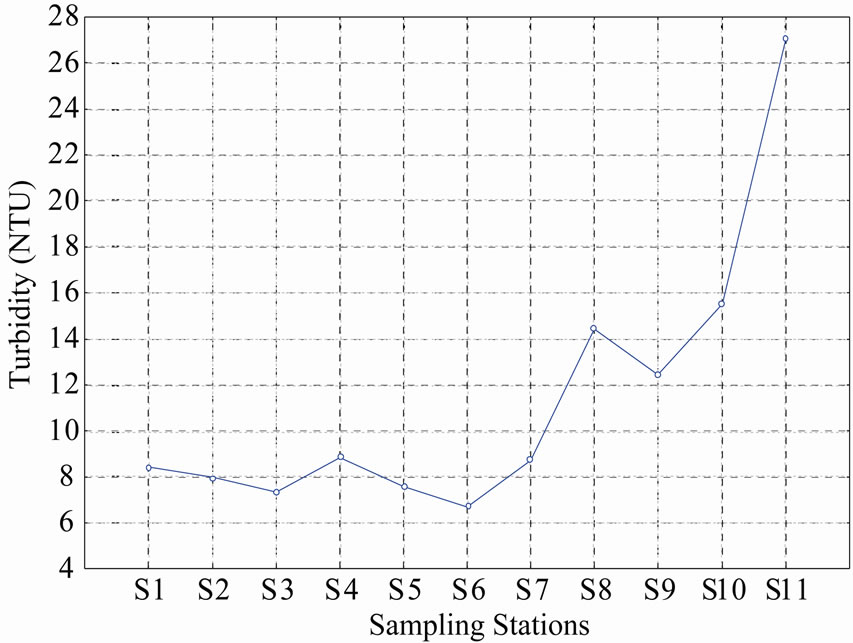 (b)
(b)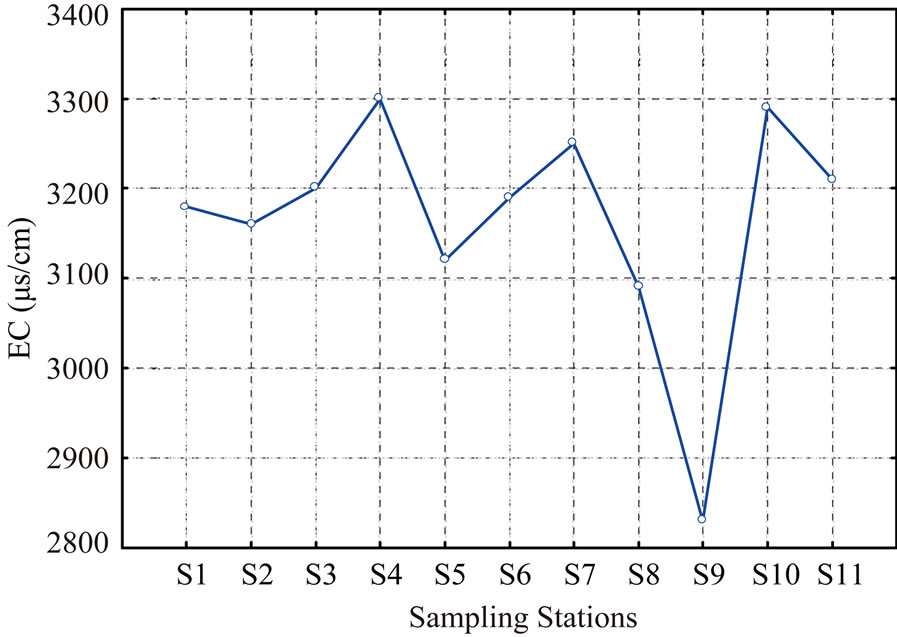 (c)
(c)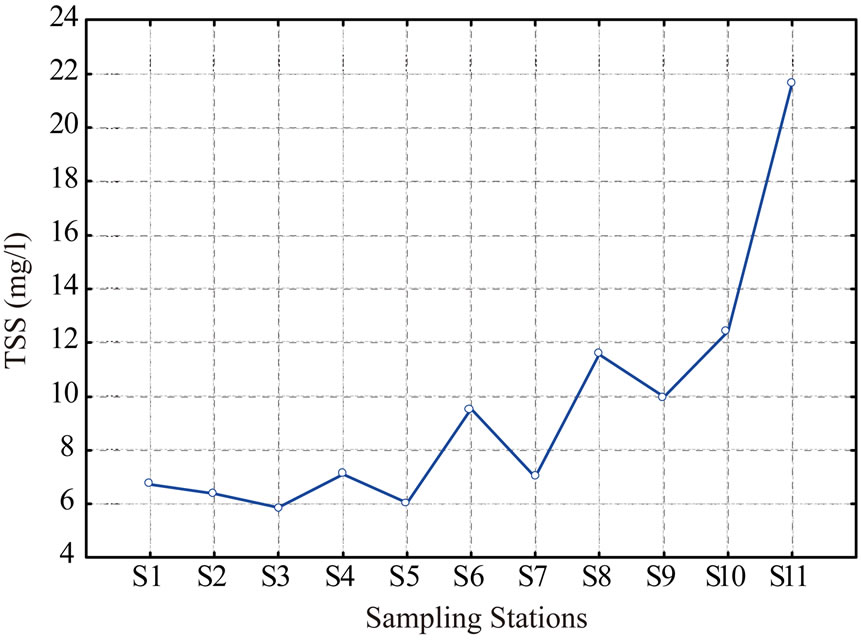 (d)
(d)
Figure 5. Spatial variation of physical parameters of Euphrates River in the study area.
 (a)
(a)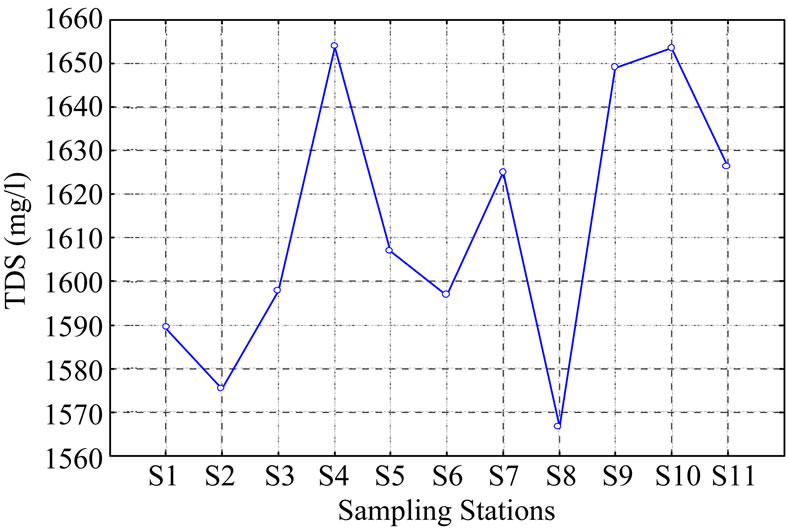 (b)
(b)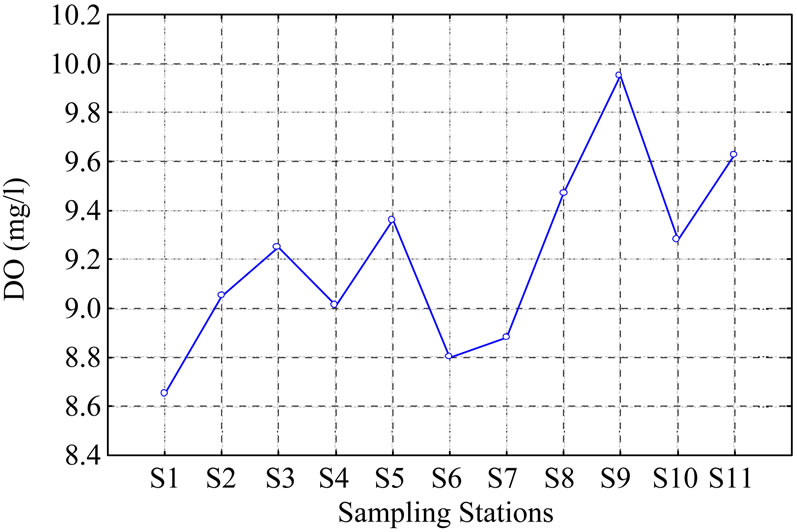 (c)
(c)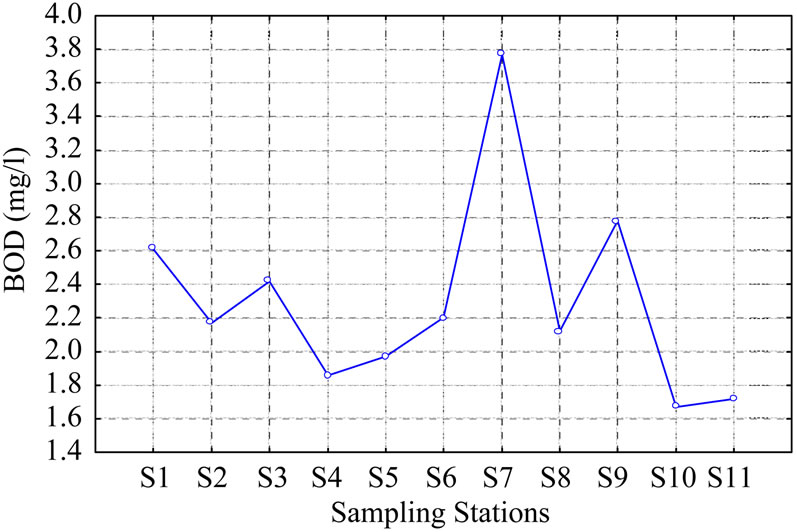 (d)
(d)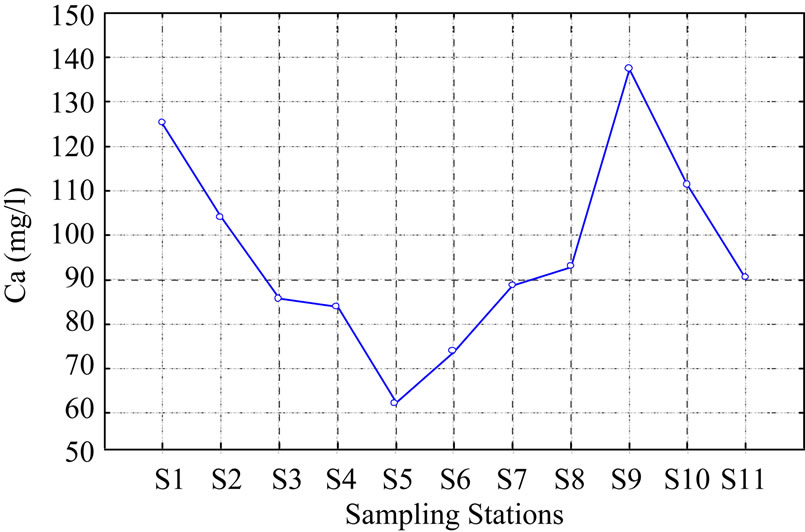 (e)
(e)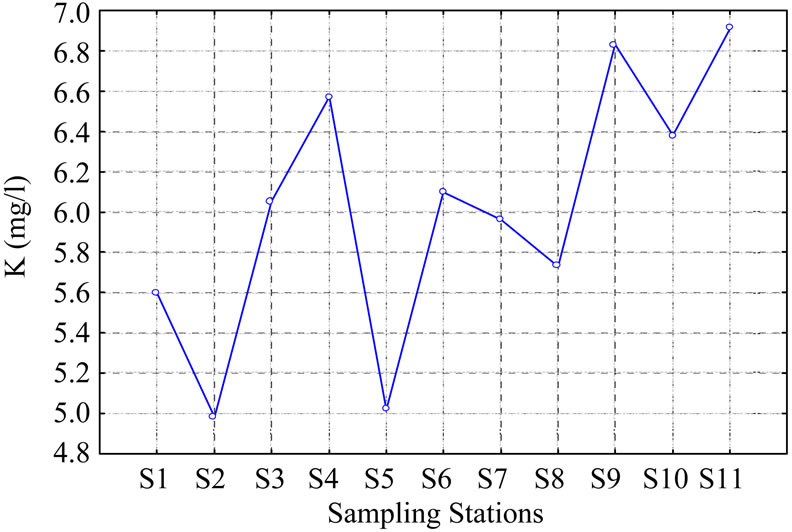 (f)
(f) (g)
(g)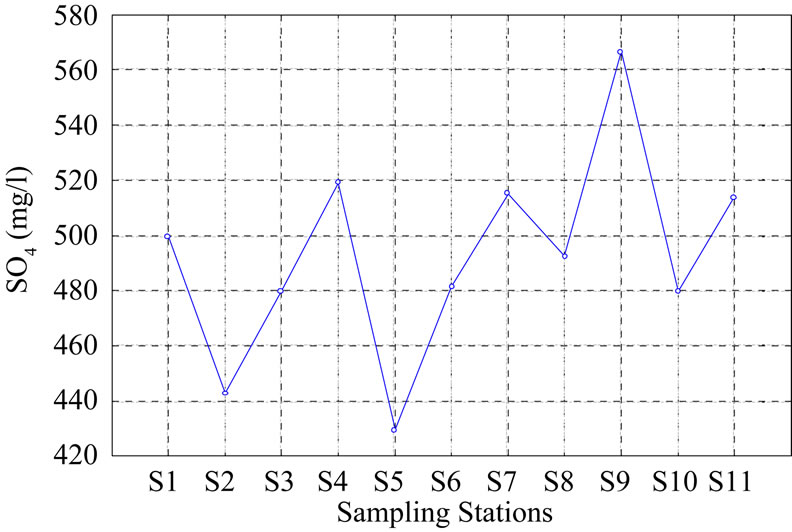 (h)
(h)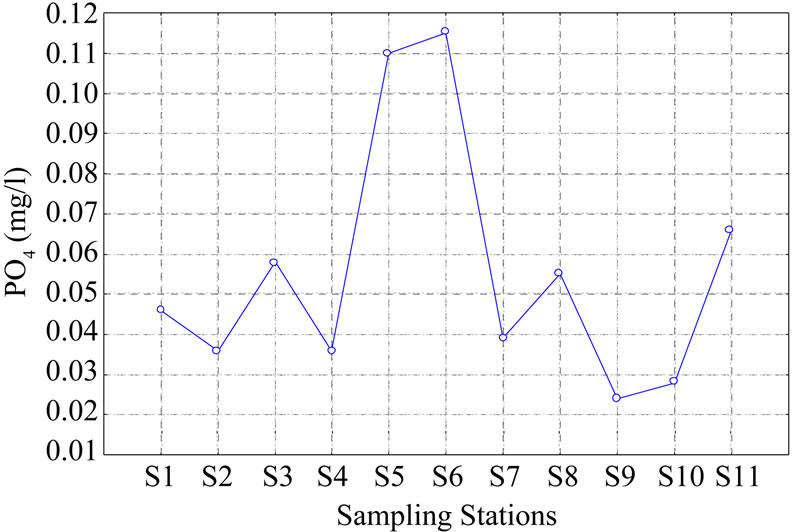 (i)
(i)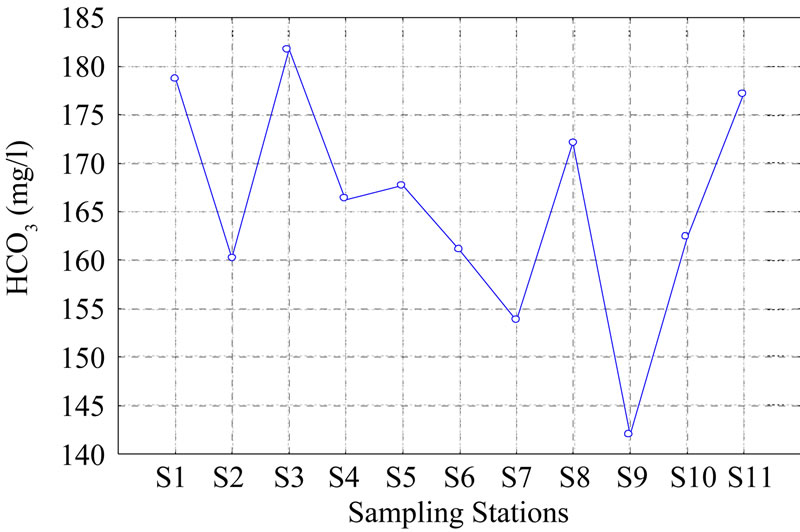 (j)
(j)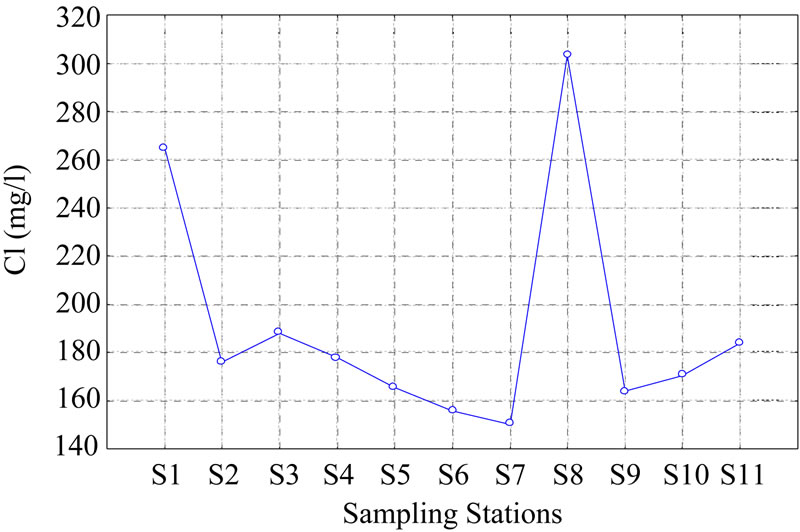 (k)
(k)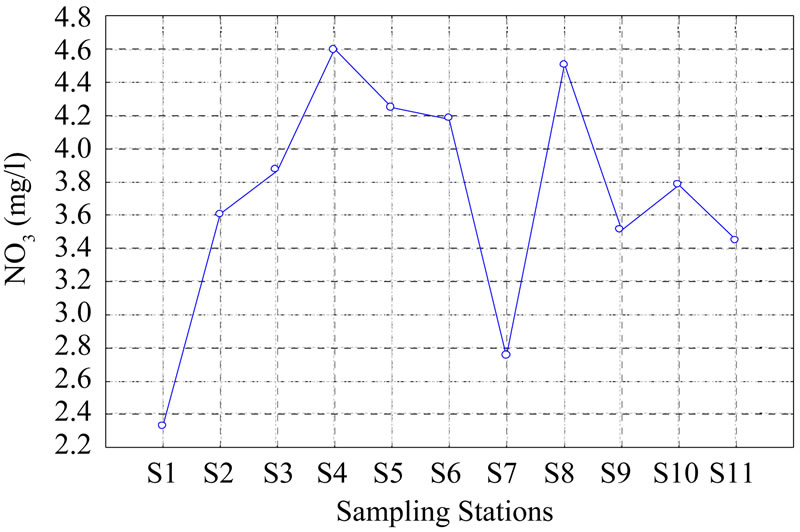 (l)
(l)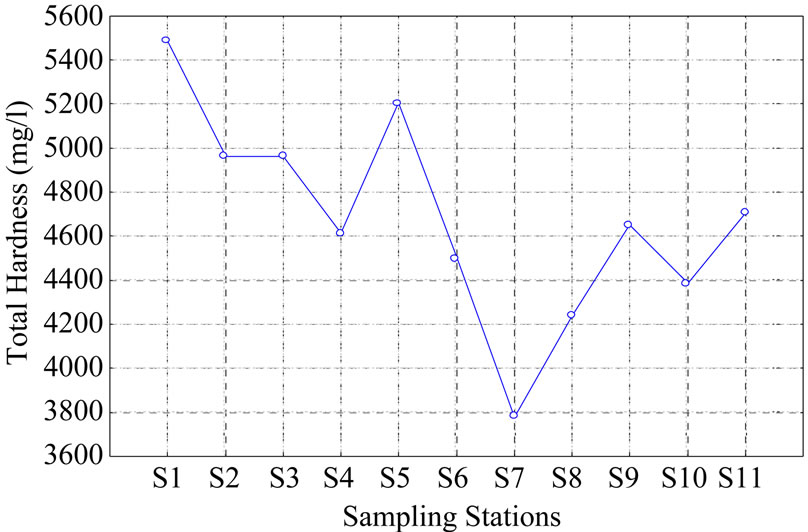 (m)
(m)
Figure 6. Spatial variations of chemical parameters of Euphrates River in the study area.
3.4. Discussion
Water temperatures recorded in this study ranged between (8.6˚C - 30.6˚C) following almost identical cycles. No significant variation found between temperature value and the sampling stations during the study period. Turbidity values of Euphrates River, agreed with other studies in the upstream and downstream of the study area [13, 14]. Significant variations in turbidity values were recorded at the sampling stations during the study period. Higher values of turbidity were found at downstream stations (S8, S9, A10 & S11), Figure 5(b). These high values may be attributed to the effect of sewage water in Ramadi city. The mean value of electrical conductivity exceeded the standards of WHO. This value was higher than that recorded by Zaidan et al. [14] for Euphrates River in Ramadi and Fallujah cities. There was significant relation between electrical conductivity values of river water and that of sewage water (R = 0.98, R2 = 0.97 at p < 0.00001). This relation reflects the effects of sewage water in the study area which are increasing of electrical conductivity of Euphrates River. Except at (S9), there was no significant difference between the sampling stations, Figures 5(c). The mean value of TSS 9.1 mg/l for Euphrates River in the study area was lower than that concluded by Zaidan et al [14]. This value exceeded the permissible limit of WHO standards. There was slight positive correlation (R = 0.68, R2 = 0.46 at p < 0.06) between the TSS of river water and sewage water in the study area. There were higher values of TSS at the downstream sampling stations (S8, S9, S10 & S11). These high values can be interpreted in terms of the effects of untreated sewage water in Ramadi city. pH mean value recorded in this study (8.36) was found within the permissible limit of WHO standards. This value was higher than that found in another study in Ramadi and Fallujah [13]. There was significant positive relation between pH of river water and sewage water in the study area (R = 0.99, R2 = 0.98 at <0.00001). This relation reflects the effect of the sewage water in increasing pH of Euphrates River in the study area. The mean value of TDS of Euphrates River in the study area (1612.73 mg/l) exceeded the permissible limit of WHO standards. This value was higher than that recorded in another study [13], for Ramadi and Fallujah cities. There was a significant positive relation between TDS of river water and TDS of sewage water in the study area (R = 9.96, R2 = 0.92 at p < 0.0001). The high concentrations of TDS of Euphrates River in the study area were interpreted in terms of the effect of the sewage water on the river water quality. The high level of TDS in April was attributed to the effect of sewage water.
The healthy river is characterized by high concentration of dissolved oxygen. In the present study, the most values of dissolved oxygen is <6 mg/l. The dissolved oxygen value was within the permissible limit of WHO standards. There was no significant difference in dissolved oxygen value between the sampling stations, Figure 6(c). There was significant seasonal fluctuation of dissolved oxygen level in the months of Spring and Summer compared with Winter months, Figure 4(c). In the present study, the most values of Biological Oxygen Demand (BOD) is <2 mg/l. The mean value exceeds the permissible limit of WHO standards. The values of BOD in months from February to June were 1.15 - 6.26 mg/l. There was no significant difference in BOD value between the sampling stations except at S7, Figure 6(d). The mean value of calcium in the present study exceeds the permissible limit of WHO standards. The high values of calcium in May and June may be attributed to the increase of evaporation rates and decrease of discharge of Euphrates River. The main source of calcium in Euphrates River is a lithology of its basin. In Iraq, lithology of Euphrates basin is limestone and Gypsum. The mean value of potassium concentration in Euphrates River water was 6.01 mg/l which is within the permissible limit of WHO standards. This mean value of potassium in the present study was in good agreement with that recorded in a previous study at Ramadi and Fallujah regions [14]. Little monthly fluctuation of potassium value was shown in this study, Figure 5(f). There were no significant differences in potassium values between the sampling stations, Figure 6(f). In the present study, most values of sodium exceed the permissible limit of WHO standards. The mean value of sodium in the present study was higher than that recorded in Ramadi and Fallujah in the study of Ziadan et al. [14]. Significant monthly variations of sodium value were shown in this study, Figure 5(g). Slight differences in sodium value between the sampling stations were shown in this study, Figure 6(g). The mean value of sulphates was within the permissible limit of WHO standards. Significant monthly fluctuation of sulphates value was shown in this study, Figure 6(h). There were significant differences in sulphates value between the sampling stations. The mean value of sulphates in the present study was in good agreement with that recorded in Ramadi and Fallujah [14]. The phosphate concentration was relatively low and the mean value is within acceptable limits set by WHO standards. Significant positive relation (R = 0.89, R2 = 0.80 at p < 0.002) was shown between phosphate in sewage water and Euphrates River water. The higher recorded concentration at sampling stations S5 and S6 was perhaps due to the input resulted from city sewage discharge. The most values of Nitrate in this study were within the permissible limits of WHO standards. Significant difference among sampling stations was found for nitrate, Figure 6(l). There was a decrease of nitrate level in the months of Spring and Summer compared with months of Winter. This means that nitrate concentrations decreased with increasing of water temperature. Significant negative correlation between nitrate and water temperature (R = 0.77 at p < 0.005) was shown in this study. In present study, the most values of chloride were <200 mg/l which is within the permissible limits of WHO standards. The levels of chloride in this study are maximum in April, May and June months and minimum in the other months, Figure 5(k). Light differences in chloride value exist between the sampling stations except S1 and S8, Figure 6(k). S1 is located near the sewage water outlet in Heet city and S8 is located near the agricultural felids.
4. Conclusions
The present study concludes that several physical and chemical parameters of Euphrates River water (Turbidity, TSS, TDS, BOD, Ca2+ , Na+, and total hardness) exceed the permissible limits of WHO standards, while other parameters (DO,  ,
,  ,
,  ,
,  , and Cl–) were within the permissible limits.
The statistical analysis of the physical and chemical parameters shows that certain parameters (e.g., Temperature-BOD, Ec-TDS, DO- , DO-
, DO- ) have a significant positive correlation with each other. Other parameters (e.g., DO-BOD, BOD-
 , BOD-
 , Temperature-DO) have a significant negative correlation.
Higher values of turbidity were found at downstream stations, this high value may be attributed to the effect of sewage water in Ramadi city. The higher values of TSS at the downstream sampling stations can be interpreted in terms of the effects of the untreated sewage water in Ramadi city.
High concentrations of TDS of Euphrates River in the study area were reported, and interpreted in terms of the effect of the sewage water on the river water quality. Significant seasonal fluctuation of DO level in the months of Spring and Summer compared with Winter months were reported. The higher concentration of  at sampling stations S5 and S6 may be attributed to the input from city sewage discharge.
REFERENCES
- K. Venkatesharaju, P. Ravikumar, R. K. Somashekar and K. L. Prakash, “Physico-Chemical & Bacteriological Investigation on the River Cauvery of Bollegal Stretch in Karnataka,” Kathmandu University Journal of Science, Engineering & Technology, Vol. 6, No. 1, 2010, pp. 50- 59.
- D. S. Otieno, “Determination of Some Physico-Chemical Parameters of the Nairobi River, Kenya,” Journal Applied Science Environment Management, Vol. 12, No. 1, 2008, pp. 57-62. doi:10.1016/j.desal.2006.06.022
- M. Milovanovic, “Water Quality Assessment & Determination of Pollution Sources along Axis/Vardar River, Southeastern Europe,” Desalination, Vol. 213, 2007, pp. 159-173.
- American Public Health Association, “Standard Methods for the Examination of Water & Wastewater,” 20th Edition, Washington DC, 1998.
- S. Shertha and F. Kazama, “Assessment of Surface Water Quality Using Multivariate Statistical Techniques; A case study of the Fuji River, Basin, Japan,” Environmental Modeling & Software, Vol. 22, No. 4, 2007, pp. 464-475. doi:10.1016/j.envsoft.2006.02.001
- D. Bellos and T. Sawidis, “Chemical Pollution Monitoring of River (Thesealia, Greece),” Journal Environment Management, Vol. 76, No. 4, 2005, pp. 282-292. doi:10.1016/j.jenvman.2005.01.027
- N. Hacioglu and B. Dulger, “Monthly Variation of some Physico-Chemical & Microbiological Parameters in Biga Stream (Biga Canakkale, Turkey,” African Journal of Biotechnnology, Vol. 8, No. 9, 2009, pp. 1929-1937.
- M. V. Ahipathi and E. T. Puttaiah, “Ecological Characteristic of Vrishabhavathi River in Bangalor (India),” Environmental Geology, Vol. 49, No. 8, 2006, pp. 1217- 1222. doi:10.1007/s00254-005-0166-0
- World Health Organization (WHO), “Guidelines for Drinking Water Quality,” 3rd Edition, Geneva, 2004.
- American Public Health Association, American Water Works Association, Water Environment Federation, “Standard Methods for the Examination of Water & Wastewater,” 21st Edition, American Public Health Association, Washington DC, 2005.
- B. Abida and Harikrishna, “Study on the Quality of water in Some Stream of Cauvery River,” E-Journal of Chemistry, Vol. 5, No. 2, 2008, pp. 377-384.
- E. A. Laws, “Aquatic Pollution,” 2nd Edition, John Wiley & Sons, Inc., New York, 1993,
- F. F. Zaidani, “Study of Environmental Pollution of Euphrates Basin Water from Al-Qaim to Heet Region,” M.Sc. Thesis, College of Science, University of Anbar, Ramadi, 2003.
- T. Zaidan, I. Rahman and W. Saaod, “An Environmental Study of Chemical and Physical Pollutants in Euphrates River Water in Ramadi and Fallujah,” Journal of Unversity of Anbar for Pure Sciences, Vol. 3, No. 3, 2009, pp. 54-64.