Journal of Water Resource and Protection
Vol. 2 No. 11 (2010) , Article ID: 3187 , 8 pages DOI:10.4236/jwarp.2010.211113
X-Raying Rainfall Pattern and Variability in Northeastern Nigeria: Impacts on Access to Water Supply
Department of Urban and Regional Planning, Universiti Technologi Malaysia, UTM, Skudai, Malaysia
E-mail: htishaku123@gmail.com, rafee@utm.my
Received September 17, 2010; revised November 7, 2010; accepted November 8, 2010
Keywords: Rainfall pattern, variability, impact, access to water, Northeastern Nigeria
ABSTRACT
This paper is premised on the hypothesis that the amount of rainfall in Nigeria decreases with increasing distance from the coastal areas to the north semi arid lands. This belief widely held in some circles does not really follow this pattern due to other climatic factors. This paper examined rainfall pattern and its variability in northeastern Nigeria and its impacts on access to water supply. Data on the mean monthly rainfall over a period of 33 years (1970-2002) were collected from the Nigeria Meteorological Agency (NIMET) in Abuja, Nigeria. The result of the analysis indicates that the mean annual rainfall in the study area is not dependent on distance but some other climatic factors such as relief, solar radiation, temperature, winds, and nature of soil among others. Thus, the amount of rainfall received in Taraba and Borno states which are located in the southern most and extreme end of the study area respectively were higher than that of Gombe state which lies in between them.
1. Introduction
There are many literatures on rainfall variations in Nigeria most of which points to the fact that rainfall declines as one proceeds northwards from the coastal regions to the semi-arid lands of northern Nigeria. These variations account for various ecological zones existing in the country. Adejuwon [1] stated that rainwater variability impact analysis is a way of looking at the range of consequences of a given rainfall event or change. Odekunle et al [2] revealed that the scientific evidence of rainfall variability on water availability and its effects on crops yield is now stronger than ever. They attributed the causes of famine in Guinea Savanna Nigeria as due to failure of crops resulting from insufficient or untimely rainfall. However, Adebayo [3] argued that although climate is not tangible, some resources emanating from it such as rainfall are tangible. He further stated that though climate may be regarded as plentiful being naturally available, its variability over time and space is unpredictable, provides the scarcity and value the makes the economics of climate worth considering. Odjugo [4] in his paper on the analysis of rainfall patterns and its implications in Nigeria concluded that rainfall decreases from 1350 mm (from 1941-1970) to 1276 mm (1970- 2002). These decreases according to him have created ecological destabilization and alter the vegetation belt especially in the northern fringes of the Nigeria. This implies that the more rainfall experienced in a given area, the thicker the vegetation of the place. Simply put, vegetation cover is dependent on rainfall and the same also goes for household access to water supply.
Others, Adefolula [5] and Olarinan [6] examined the monthly rainfall and rain-days series in Nigeria respectively. The findings of the analysis of their work revealed a significant depreciation in mean monthly rainfall and rain-days meaning that access to water by household will continue to decline with increasing pressure from the population. This implies that concerted efforts are required both at personal, local, regional, national and international levels are required. This decline accordingly is attributable to mismanagement of water resources at all levels of development.
Broune [7] stated that the presence of water makes the planet earth different from all other bodies in the universe. This fact is responsible for our existence. Throughout history the availability of water has determined where our settlements were built and what crops we could grow. For centuries water has been the most vital medium for transportation and remains so today. Ruiter and Sanders [8] stated that water is one of the most important non-renewable resources on the surface of the earth therefore; its importance can not be overemphasized. Water can be used for agricultural industrial, landscape management and the generation of hydro electric power. It can be used for drinking and other domestic purposes. Water for food production can improve people’s livelihoods and economic well being through irrigation, industrial and power generation.
World Bank [9] stated that access to water is measured by the number of people who have reasonable means of getting an adequate amount of water that is safe for drinking, washing and essential household activities expressed as a percentage of the total population. It reflects the health of a country’s people and the country’s capacity to collect, clean and distribute water to consumers. Safe water includes treated surface water, as well as untreated but uncontaminated water from source such as natural springs and sanitary wells and protected boreholes. On average, a person needs about 20 liters of safe water each day to meet his or her daily metabolic, hygiene and domestic needs. In urban areas the source may be public standpipe located not more than 200 meters away. In rural areas the definition implies that members of the household do not have to spend a disproportionate part of the day fetching water.
Shaw [10] stated that water related diseases are the single largest cause of human sickness and death in the world and disproportionately affects the poor. Without water people can not leave healthy and productive lives. Improved adequate safe water supply will lead to reduction of human suffering, increased productive capacities that at the end will reduce health care cost. This can only be realized if water is set in the broader context of health objectives. United Nations Environmental Protection UNEP [11], World Bank Group [12] and UNICEF [13] revealed that safe drinking water is one of the most basic human requirements, and one of the Millennium Development Goals (MDGs) by 2015 is to reduce by half the proportion of people without access safe drinking water as a result, estimates of access to safe drinking water are a cornerstone of most international assessments of progress, or lack thereof, toward solving global and regional water problems.
World Health Organization WHO [14] and UNICEF [15] estimates that 12% of the world’s population consumes 80% of the available water, leaving 1.1 billion people (1/6th of world population) without access to adequate water supplies. This is aggravated by the fact that 2.4 billion people lack access to adequate sanitation facilities. It is estimated that by 2025 water shortages could affect two out of three persons globally, with developing nations most vulnerable. As young people make up higher population of developing countries relative to developed countries, they are disproportionately at risk. Women and children especially spend their productive and considerable time seeking for water in far distances from their homes.
Preliminary investigations revealed that majority of the rural communities do not have improved water supply systems such as piped water networks or boreholes, where such facilities exists are either malfunctioning or completely broken down and this force household to rely on available sources for domestic purposes. Rural households especially women and children walk longer distance to obtain water for domestic purposes. Water resources are used in various ways by society and scientists predict that water scarcity will be one of the most important issues in the 21st century. Currently, 1.2 billion people lack access to safe water sources. Nearly 2 billion people live with water scarcity, and this number is expected to rise to 4 billion by 2025, unless radical reforms emerge.
Reports from development agencies, governments, water commissions, and research institutes continually point to an impending water crisis. These agencies also point to the water crisis arising from mismanagement not an absolute scarcity problem. Thus, improving current water provisions and avoiding a crisis of availability with the entire human suffering is possible. The message highlighted by various international efforts is that suboptimal management of water is not an option if sustainable development is to be achieved.
2. Rainfall Pattern in Nigeria
It is a common believe that all water on the earth comes from the rain and stored as surface water such as rivers, ponds, oasis, or underground water as spring and water table etc. Nigeria Meteorological Agency (NIMET) revealed that Nigeria’s climate is characterized by strong a latitudinal zone which becomes progressively drier as one moves northwards from the coast. Rainfall is the key climatic variable and there is a marked difference between the wet and dry seasons in most areas. By April or May of every year, the rainy season is underway in most parts of the south of the Niger and river Benue valleys. Farther north the rains do not commence until the months of June or July. From the months of December through February northeast trade winds, called the Harmattan, sweeps across the country. In addition, these winds are often laden with dust particles from Sahara Desert giving rise to characteristic Harmattan haze which reduces visibility.
The total annual rainfall decreases from 3,800 mm at Forcados on the coast to less than 650mm at Maiduguri Borno state in the extreme north east of the country where the receding Lake Chad is located. The length of rainy season decreases from nearly 12 months in the south to less than 5 months in the north. Rain starts in the month of January in the south and progresses gradually across the country. The period June to September is rainiest throughout the country. In many parts of the south, however, there is a slight difference in the rains for 2-3 weeks in late July and early August. The heavy rainfall in the south leads to severe erosion, low infiltration and high run-off in the opened-up soils. On the other hand when the infiltration rate is high the situation is that of high leaching, causing the development of inherently infertile soil with low cat ions exchange capacity (CEC) and low buffering capacity.
The regulatory drought periods have been among the most notable aspects of Nigeria climate in recent years, particularly in the drier regions of the north. Experts regard the 20th century as having been among the driest periods of the last several centuries; the well publicized drought in the 1970’s and 1980’s were latest of several significant such episode to affect West Africa. At least two of these droughts have severally affected large areas of the northern Nigeria and Sahel region farther.
In addition to high inter-annual variability, the rainfall regime of the northeastern Nigeria is characterized by high concentration in few months usually from August-September, which is not only intermittence but with violent storms. Thus, the region is prone to recurrent and sometimes intense period of drought especially within Borno and Yobe states which share a common boundary with the Sahara desert in the extreme end of Nigeria.
Muhammad [16] quoted the Nigeria Meteorological Agency (NIMET) as saying that rainfall over many parts of Nigeria was expected to fall slightly below its level of the previous year 2008. It further stated that the predicted values for 2009 tend to be lower than normal over large portions of the country. The implication is that this is likely to create water shortages in lakes dams, rivers for both hydroelectric generation as well as irrigation. This statement further asserts that the southern parts of Nigeria are likely to receive above normal rains. The annual rainfall is expected to vary from 400-1200 mm in the northern half of Nigeria while the south, will rapidly increase from 1200-2800 mm, implying high surface run-off and its attendant environmental hazards such as flooding due to the run-off. This calls for a deliberate efforts of all and sundry in the struggle not to only protect the environment but to also increase the water demand of households especially the rural communities who do not have access to safe water, and hence the justification of rainwater harvesting in the region. (Daily Trust Nigerian Newspaper 2009)
Nigeria has a climate that is characterized by relative high temperatures throughout the year. The average annual maximum temperature varies from 35℃ in the north to 31℃ in the south, the average annual minimum from 23℃ in the south to 18℃. On the Jos plateau and the eastern highlands, the altitude makes for lower temperatures, with the maximum not more than 28℃℃ and the minimum as low as 140C. The effects of these high temperatures are high evapo-transpiration and this eventually brings about water shortages for arable cropping. The soil temperature is corresponding at almost uniform in the country both during the day and at night, condition in which inherently low yielding grain can thrive.
The relative humidity is also high throughout the year. This is responsible for high incidence of pest in southern Nigeria. Places with high relative humidity are found to be a good breeding ground for pests. Another effect of this high humidity in the south and that of Harmattan dust in case of north is plenty of cloud cover. This appears to be more noticeable in the southern states and the peak of the growing season, resulting in the reduction rate of photosynthesis and lower yields in crops.
The study area commonly referred to as the northeast region falls within the Guinea savanna Ecological zone and lies between the semi-arid north and the wet southern part of Nigeria. This region is made up of six political states. This includes Taraba, Adamawa, Yobe, Borno, Gombe and Bauchi, states. The first four states share a common international boundary with the Republic of Cameroon, Chad and Niger to the northeast respectively. While Gombe and Bauchi states lies close to the central part of Nigeria and is bounded in the north by Katsina, in the west by Plateau and to the south by Nasarawa states. Taraba state is bounded to its north by Gombe and Adamawa states, to the west by Plateau and Nasarawa and to its south west by Benue states. Gombe state forms the centre of the northeast region in terms of spatial location Figure 2. Nigeria is located between latitude 40N to 140N; and along longitude 30E to 150E. It is bounded in the North by Niger Republic, in the West by Benin Republic and in the East by Cameroon Republic. The Chad Republic is to the North-East and Atlantic Ocean is to its South through the Gulf of Guinea. The country got its name from its most prominent river, the Niger. River Benue, Ogun, and Osun cross river and Imo are some of dominant rivers and water shed. All these rivers flow directly to the Atlantic. Rivers Kaduna, Hadejia and Gongola al flows to Lake Chad.
The house and population census conducted in 2006 by the National Population Commission (NPC) [17], puts the population of the northeast region to be about eighteen million nine hundred and seventy thousand nine hundred and sixty five persons (18,970.965). The distribution is as follows: Taraba (2,300,736) Adamawa (3,168,101), Gombe (2,353,879), Bauchi (4,676,465), Yobe (2, 320,591), and Borno (4,151,193) with a growth rate of 3.2%.
3. Methodlogy
3.1. Data Acquisition
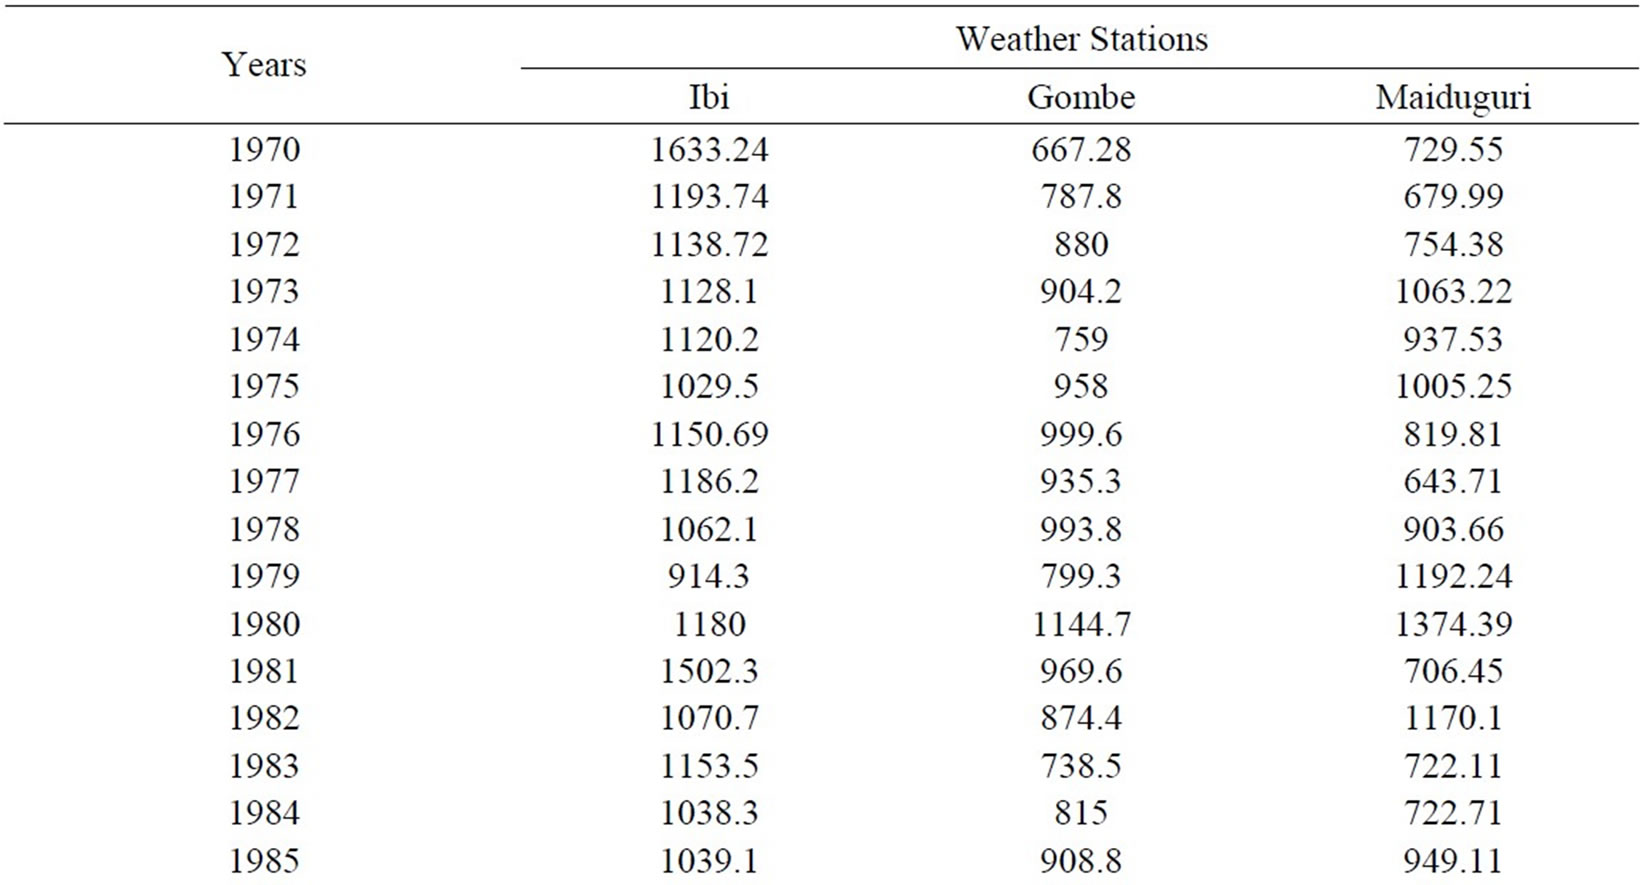
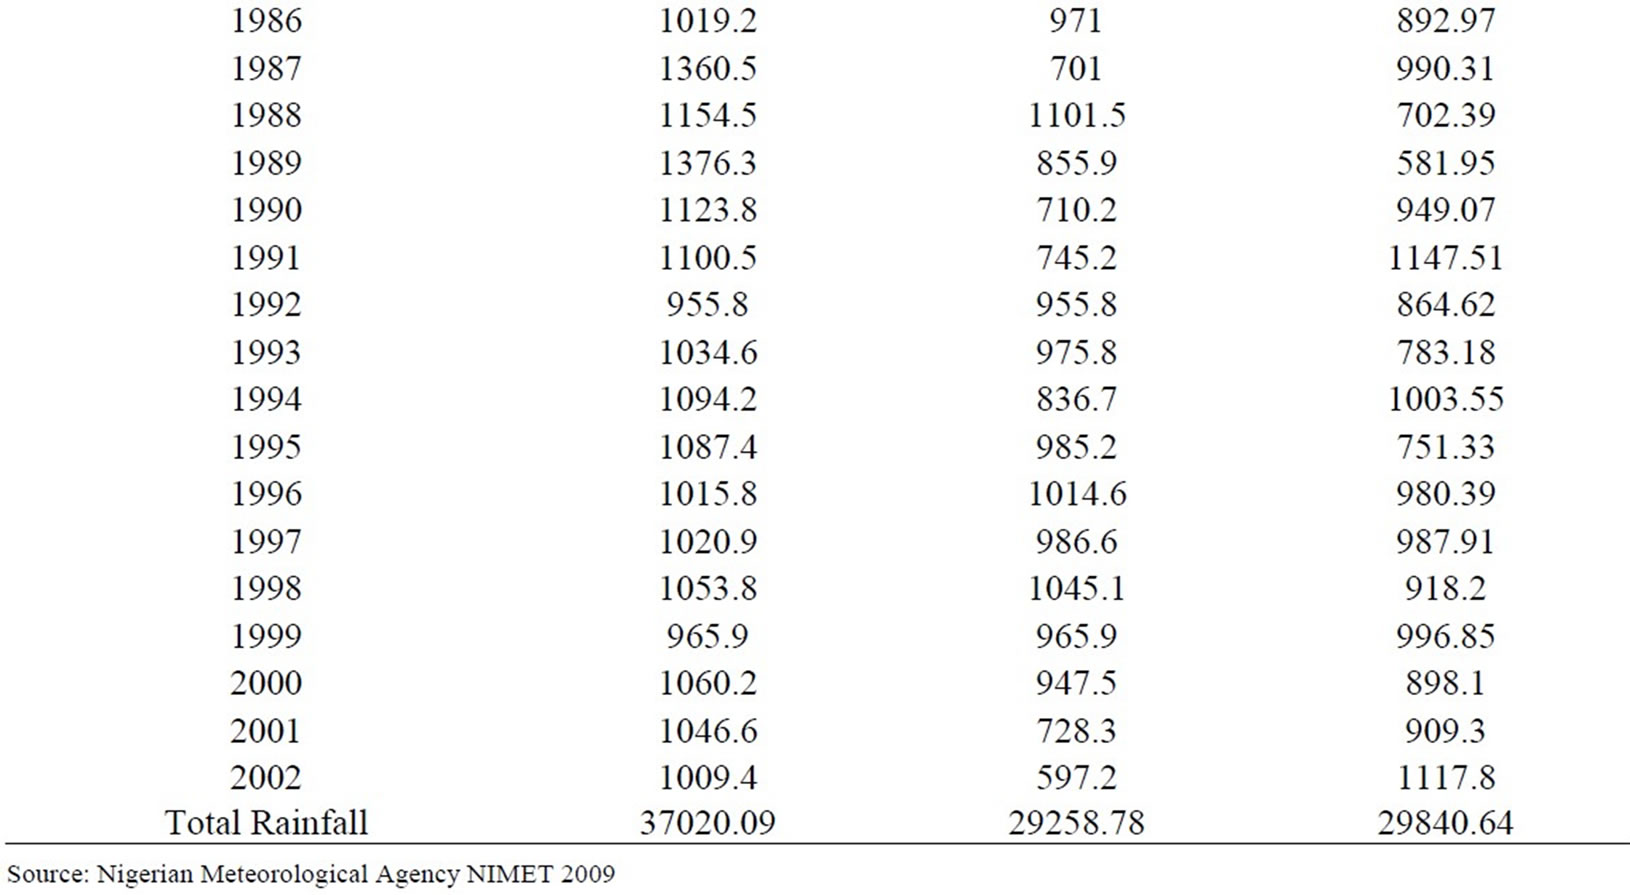
Data on mean monthly rainfall over a period of 33 years from 1970-2002 were obtained from the Nigerian Meteorological Agency NIMET for 3 states in the northeastern Nigeria. These states are Taraba state, Gombe state and Borno state. This mean monthly rainfall obtained were converted into mean annual rainfall using excel and imported into the predictive analysis software version 17.0 (PASW). The analysis of variance (ANOVA) was used to test the hypothesis.
4. Results and Discussion
Comparison between annual rainfalls in 3 stations for 33 years (1970-2002) is as follows:
The results of the analysis and map of rainfall patterns in Nigeria Figure 1 shows that annual variability of rainfall brings about differences in households access to water. The map shows a general decrease with increasing distance from the coastal areas of the south to the sahelian semi-arid lands of the north. However, the annual rainfall in Maiduguri Borno state for the period under review was found to be slightly greater than Gombe. This could be attributed to some climatic factors prevailing in the region. The variability of rainfall in the area is as shown below.
Figures 3-5 shows the variation in annual rainfall for the period of 33 years. It is generally believed that all water on earth surface comes as a result of rainfall, therefore, the more the rainfall in a given area, the greater the availability of water for domestic, agriculture and industrial purposes. (Table 1)
The analysis of variance was used to test whether the mean monthly rainfall values received in the region were the same for the year 1970, 1971, 1972…and 2002 or vary significantly.
From the ANOVA table (Table 2) it is obvious that the amount of rainfall are not the same at the level of significant of 0.05 = 0.24 < 0.05. This implies that there is difference in the amount of rainfall received in the region between the years 1970-2002. The amount of rainfall received in Taraba state is greater than that of Gombe state and that of Borno state was more than that of Gombe state. The explanation for these variations can be attributed to some climatic factors such as relief, rainfall intensity, and proximity to the receding Lake Chad soil conditions among others.

Figure 1. Map of Nigeria showing mean annual rainfall patterns.

Figure 2. Map of Nigeria showing the study area.
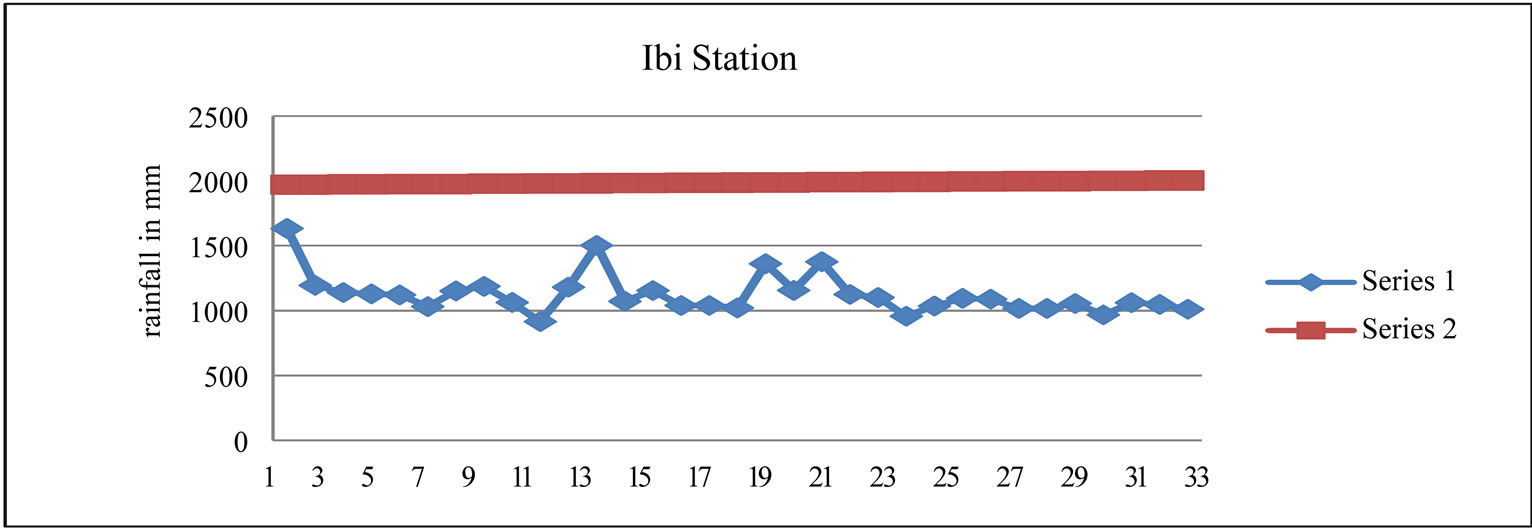
Figure 3. Mean monthly rainfall in Ibi station Taraba state.

Figure 4. Mean monthly rainfall in Gombe station in Gombe state.
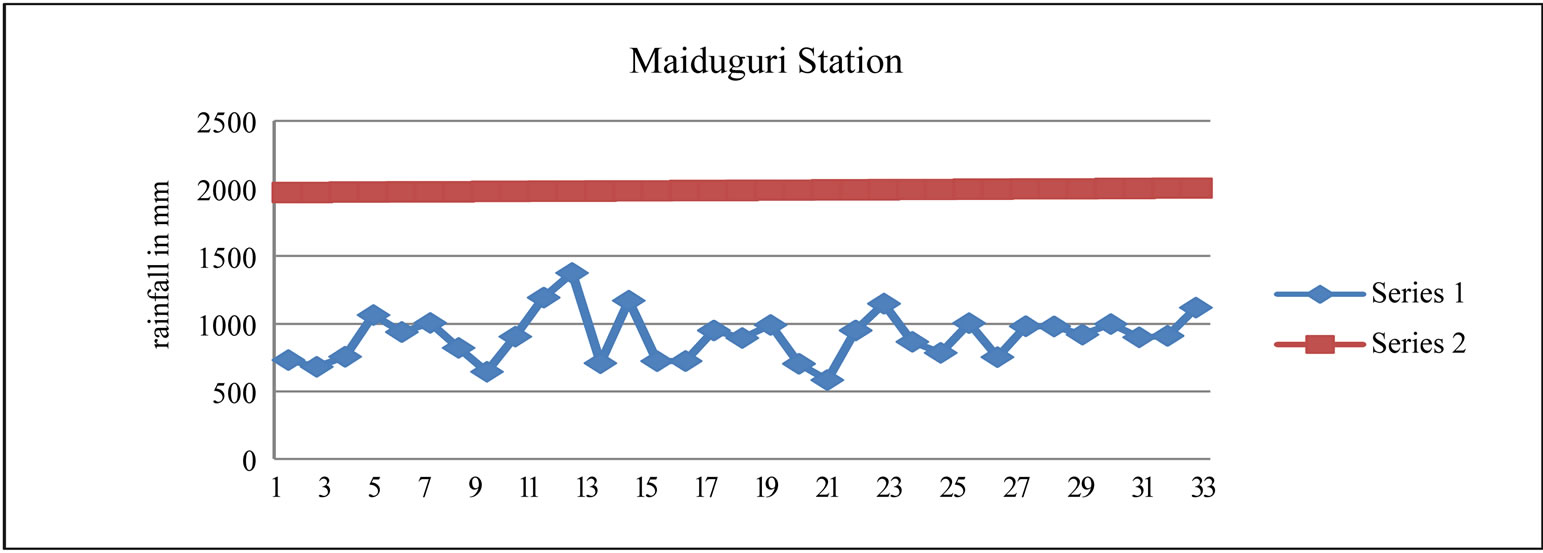
Figure 5. Mean monthly rainfall in Maiduguri Borno state.
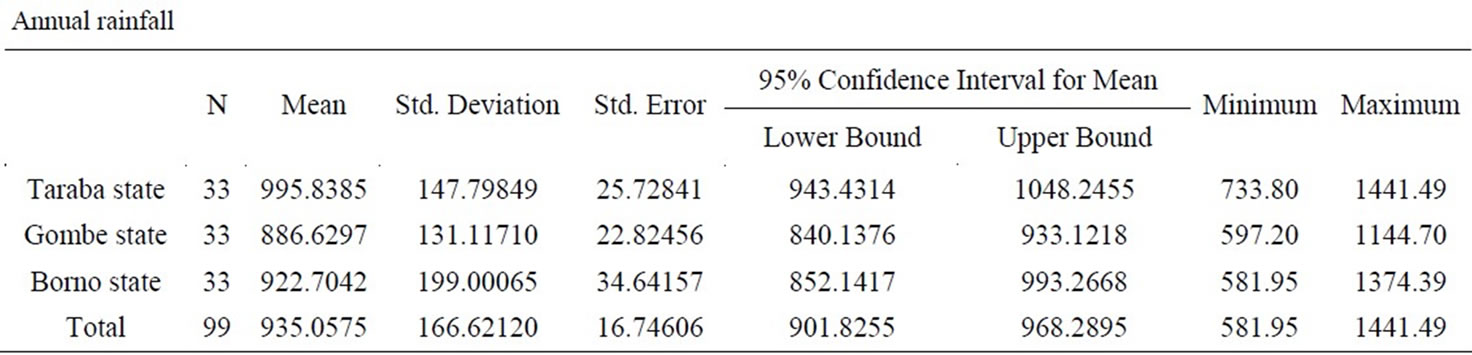
Table 1. Descriptives.
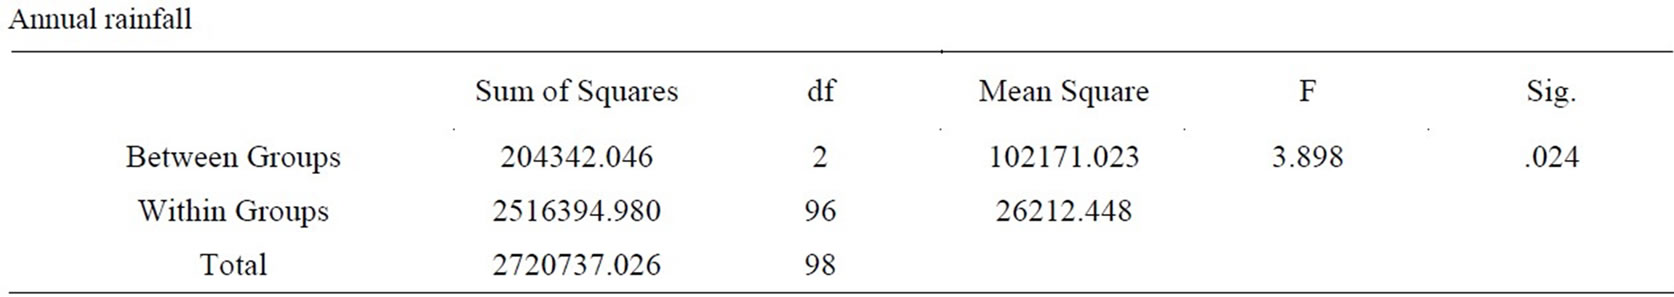
Table 2. Analysis of Variance on mean annual rainfall 1970-2002 (ANOVA).
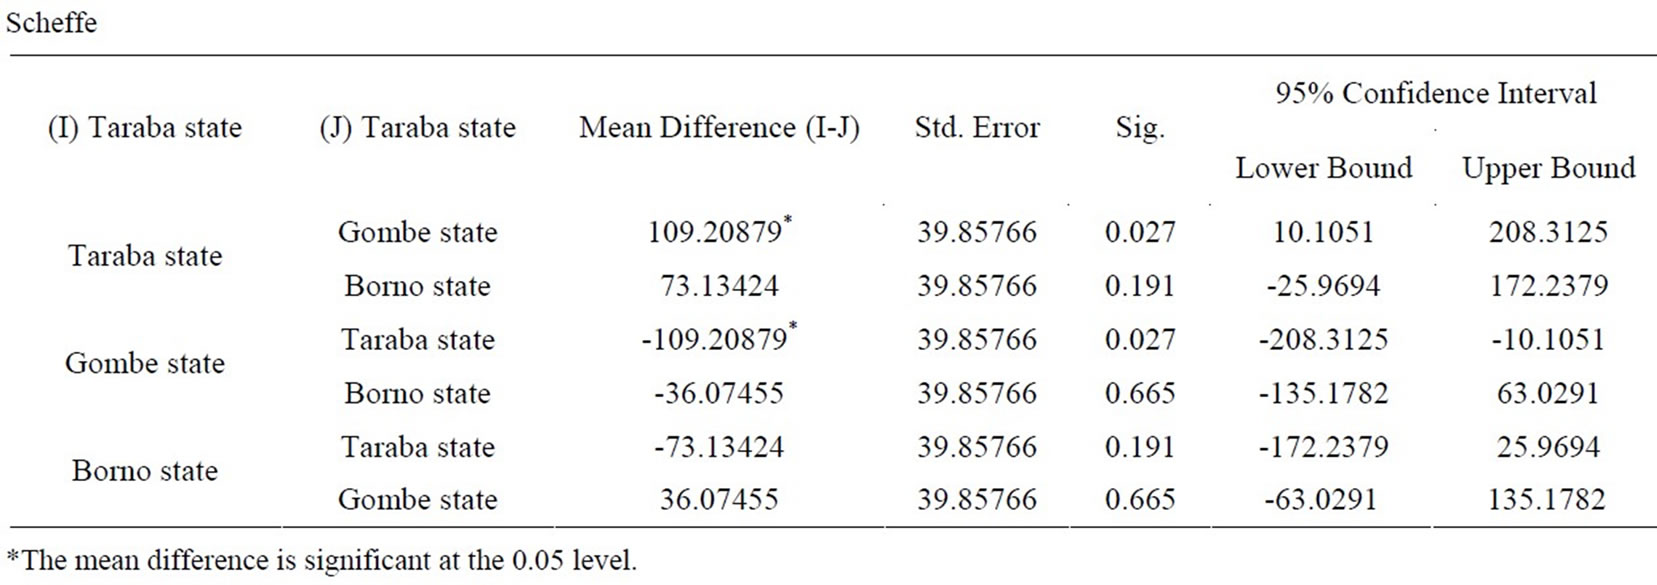
Table 3. Multiple Comparisons.
The mean annual rainfall was compared result show that there exists a significant difference at 0.05 levels as seen on table 3 above.
5. Conclusions
The impacts of rainfall variability on access to water supply have been examined in this study. Result shows that water accessibility is dependent on rainfall variability, thus, the analysis shows that the mean annual rainfall for the northeast region does not decrease with distance from the coastal areas of the southern Nigeria to the semi-arid lands of northern parts as widely speculated and this affects households’ access to water supply. The implication of this finding on household access to water supply is that this variability and pattern of rainfall in the country is likely to create water shortages in lakes dams, rivers for domestic, irrigation as well as industrial purposes.
NIMET (2009) had predicted that annual rainfall is expected to vary from 400-1200 mm in the northern half of Nigeria while the south, will rapidly increase from 1,200-2,800 mm, implying high surface run-off and its attendant environmental hazards such as flooding due to the run-off. This calls for a deliberate efforts of all and sundry in the struggle not to only protect the environment but to also increase the water demand of households especially the rural communities who do not have access to safe water, and hence the justification of rainwater harvesting in the region.
REFERENCES
- J. O. Adejuwon, “Crop yields Response to Climate Variability in Sudano-Sahelian Ecological Zones of Nigeria,” AICC Report on Workshop for Africa and India Ocean Island, Dakar, Senegal, 2004, pp. 16-16.
- T. O. Odekunle, I. O. O. Orinmoogunje, and A. Ayalande, “Application of GIS to Assess Variability Impacts on Crop yields in Guinea Savanna Part of Nigeria,” African Journal of Biotechnology, Vol. 6, No. 18, 2007, pp. 2100- 2113.
- A. A. Adebayo, “Climate: Resource and Resistance to Agriculture,” An Inaugural Lecture 8th Series of Federal University of Technology Yola, ABTI Printing Press, Yola Nigeria, 2010.
- A. O. O. Odjugo, “An Analysis of Rainfall and its Implication in Nigeria,” Global Journal of Environmental Sciences, Vol. 4, No. 2, 2005, pp. 139-145.
- D. O. Adefolula, “Rainfall Trends in Nigeria: Theoretical and Applied Climatology,” Springerlink Verlag, Vol. 37, No. 4, 1986, pp. 205-219.
- O. J. Olarinan, “Changing Patterns of Rain-Days in Nigeria,” Kluwer Academic Publishers, Geo Journals, Vol. 22, No. 1, 1990, p. 99.
- P. G. Broune, “Water and Sanitation: Economic and Sociological Perspective,” Academic Press, ICN Harcourt Brace Jovanovich, Publishers, 1984.
- W. Ruiter and F. M. Sanders, “Physical Planning Faculty of Engineering Department of Infrastructure University of Technology,” ICTG Publishers, the Netherlands, 1998.
- World Bank Group, “Report: Access to Safe Water Supply,” 2001. http://www.worldbank.org/depweb/english/ modules/environment/water/print.htm.
- C. Shaw, “Tri-Sector Partnerships: How They Work?” The Department for International Development Magazine, The Lime house Group, No. 18, second quarter, 2003, pp. 15-18.
- United Nations Environment Program UNEP, “Water Supply and Sanitation Coverage in UNEP Regional Seas,” 2002
- World Bank Group, “Report: Access to safe Water supply,” 2004. http://www.worldbank.org/depweb/english/ modules/ environment/water/print.htm
- UNICEF, “Progress on Drinking Water and Sanitation a MDG Assessment Report,” 2008.
- WHO, “Global Water Supply and Sanitation Assessment Joint Monitoring Program for Water Supply and Sanitation Series,” World Health Organization, 2004.
- UNICEF, “Global Water Supply Assessment Joint Monitoring Program for Water Supply in Developing Countries,” United Nations International Children's Emergency Fund, 2005.
- H. Muhammad, “All Africa.com Nigeria: Nigeria Meteorological Agency Predicts Low Rainfall,” Daily Trust Newspaper, 19 February 2009.
- The Nigeria Population Commission, “Official Result for house and population census figures,” Bureau for National Statistics Abuja Nigeria, 2006. http://www.nigerianstat.gov.ng