Journal of Water Resource and Protection
Vol. 2 No. 10 (2010) , Article ID: 2959 , 8 pages DOI:10.4236/jwarp.2010.210103
Hydrochemical Analysis of Groundwater in the Lower Pra Basin of Ghana
1Department of Chemistry, National Nuclear Research Institute, Ghana Atomic Energy Commission,
Legon, Ghana
2 Department of Nuclear Sciences and Applications, Graduate School of Nuclear and Allied Sciences,
University of Ghana, Accra, Ghana
3Ghana Atomic Energy Commission, Accra, Ghana
4Water Research Institute, Council for Scientific and Industrial Research, Accra, Ghana
E-mail: rsma19@yahoo,com
Received June 17, 2010; revised July 8, 2010; accepted July 15, 2010
Keywords: Lower Pra Basin, Ghana, Groundwater, Hydrochemistry
ABSTRACT
Investigating into the quality of groundwater in the lower Pra basin using physico-chemical parameters have been carried out. Samples were collected from thirty one (31) water points. All major ions were determined using standard methods. The results show that approximately 97% of the water sampled has TDS values less than 1000 mg/l. Chemical parameters are influenced primarily by silicate weathering, ion exchange processes and sea aerosol spray. Sodium ion (Na+) concentration is generally high compared to other cations and bicarbonate (HCO3-) is the most abundant anion. Approximately 90% of the samples have iron concentrations greater than the W.H.O. limit for drinking water. Aluminium showed relatively higher concentration than other trace metals. The maximum and minimum concentrations recorded for cadmium Cd are 0.005 mg/l and 0.013 mg/l respectively. Concentrations of lead (Pb) zinc (Zn) were below detection limit. The groundwater in the basin is generally Na-Cl in character. Minor water types such as Ca-Mg-HCO3, Na-Mg-Ca-HCO3 and Na-Cl-SO4 were also delineated.
1. Introduction
In the last decade, there has been an increase in the exploitation of groundwater for water supply needs of many small communities in Africa including Ghana. Groundwater is not only feasible, but also the most cost effective source of potable water for scattered and remote communities. In Ghana, about 68 per cent of the population lives in rural communities. Until the last decade, groundwater contamination was not a priority concern for water resource managers in Ghana but potential for groundwater contamination is now acknowledged widely [1]. Groundwater has become an important source of potable water for most communities in the lower Pra basin since the mining activities within the Pra Basin has rendered most surface waters polluted and the cost of water treatment highly prohibitive. However, groundwater in hard rock areas and mostly in mining areas as the lower Pra Basin is known to be susceptible to quality problems that may have serious connotation on human health [2]. Secondly the mining activities in the areas generate acid mine drainage (low pH waters) that can leach trace metals in dangerous proportions into the groundwater system rendering it dangerous for human consumption. Despite the susceptibility of groundwater in the area to pollution, only scanty chemical data exist on groundwater. Accordingly, the present quality of many groundwater systems is largely unknown and the baseline chemical data on which changes, in present and future water quality, can be based is unavailable. The necessity, therefore, to generate baseline data cannot be overemphasized. It is equally imperative to know natural processes or phenomena that govern the chemical composition of the groundwater or the anthropogenic factors that presently affect it. The objectives of this research are to investigate the quality of groundwater in the lower Pra basin; characterize the groundwater and to delineate the relevant water-rock interaction and anthropogenic factors that control water quality in the study area and acquire a database for further research and monitory of groundwater quality in the basin. Season is from September to October [3]. Temperatures are almost the same as in the south-west equatorial region (26°C in August and 30°C between March and April). Monthly relative humidity is higher in the rainy seasons than during the rest of the year. The highest average monthly humidity does not exceed 75% and the lowest is about 60% [3]. The vegetation is Coastal scrub and grassland. The study area is within the coastal plain. The land is not flat but rather undulating. Various types of rock are found here, but the most widespread are the granites which also form most of the hills. The coastline is different from that of the south-east coastal plains and forms a series of bays and headlands, and is cliffed in numerous places [3]. The Upper Birimian Series consists of great thickness of basaltic and andesitic lavas, beds of agglomerate, tuff and tuffaceous sediments [4].
2. Materials and Methods
Samples were collected from thirty one (31) water points (boreholes and hand-dug wells). Sampling protocols described by Claasen [5] and Barcelona et al. [6] were strictly followed during sample collection: the sampling bottles were conditioned by washing with detergent, then with ten percent (10%) nitric acid, and finally rinsing several times with distilled water. This was carried out to ensure that the sample bottles were free from contamination, which could affect the concentrations of various ions in the groundwater samples. At the sampling points, the boreholes were pumped for five minutes to purge the aquifer of stagnant water so as to acquire fresh samples for analysis. Samples were collected in duplicate, and samples earmarked for metal analysis were acidified to a pH less than 2 after filtration using reagent grade nitric acid. Samples for anion analysis were without preservation because addition of acids could lead to a reaction with the carbonates in the water sample. Samples for cation analysis were filtered on site through 0.45 µm filters on acetate cellulose into 250 ml bottles and immediately acidified to a pH less than 2 by addition of MerckTH Ultra pure nitric acid. Samples for anion analysis were collected into 600 cm3 polyethylene bottles without preservation. All samples were stored in an ice-chest and transported to the Ghana Atomic Energy Commission chemistry laboratory, stored at temperature less than four degrees Celsius (4°C) and analysed in ten days. The physical parameters and major ions were determined using standard methods [7]. Zinc (Zn), cadmium (Cd) and lead (Pb) were analysed using digestion, followed by atomic absorption spectrometry using the AA240FS Fast Sequential Atomic Absorption Spectrometer [8-10]. Aluminum (Al), Iron (Fe), Calcium (Ca), magnesium (Mg), manganese (Mn) were analysed by Neutron Activation Analysis (NAA) using the GHARR-1 at a neutron flux of 1 × 10¹¹ ncm2s1 [11-13]. Figure 1 shows the location and geological map of the study area.
3. Results and Discussion
3.1. Hydrochemistry
The results were analysed statistically and the summary, which include minimum and maximum values; mean and median, as well as standard deviation has been presented in Table 1 below. The actual results will be put in the appendix. The groundwater pH is generally low, in the range of 5.29 and 7.91 with mean and median values of 6.47 and 6.42 respectively. The pH values, however, fall within the natural water pH range of 4.5 to 9.0 [14]. The mean and median values of the electrical conductivity (EC) are 675.3 µs/cm and 416 µs/cm respectively. The range is a minimum of 51 µs/cm to a maximum of 4060 µs/cm. The standard deviation with respect to the mean is 938.8 μs/cm. The difference may reflect the wide variation in activities and processes prevailing in the surface and subsurface [15]. The order of the relative abundances of cations and anions as measured in the basin are: Na+ > Ca2+ > Mg2+ > K+ and HCO3- > Cl- > SO42- > NO3- > PO43-, respectively. Sodium is, by far the most abundant cation. A high percentage of the TDS is contributed by Na+ Cl-, and SO42- Conductivity is also most influenced by Na+, Cl- and SO42- as depicted in Table 2 by the Pearson correlation which shows the extent of correlation between and among major ions, TDS and conductivity. Phosphate concentrations are, in general, very low as compared to NO3- and SO42-.
3.2. Sources of Major Ions
Figure 2 shows the relationship between Na+ and Cl-, for the deduction of the origin of salinity in the basin. Approximately 74% of the water samples have Na+/(Na+ + Cl-) ratio within the range of 0.5 ± 0.1 or plot along or close to 1:1 line of the Na+ vs. Cl- gragh, implying that sea aerosol spray or halite dissolution is partially responsible for Na+ and Cl- in the groundwater. However, halite is not known to be associated with the geology of the sampling area (Cape Coast granitoid complex, Discove granotide complex and Upper Birimian). This leaves sea aerosol spray as the most likely source of Na+ and Cl-. A very small percentage of the samples plot below and away from the 1:1 line, which indicate that reverse ion exchange might be a minor process controlling the chemical evolution of the basin.
If ion exchange is the controlling factor of groundwa-
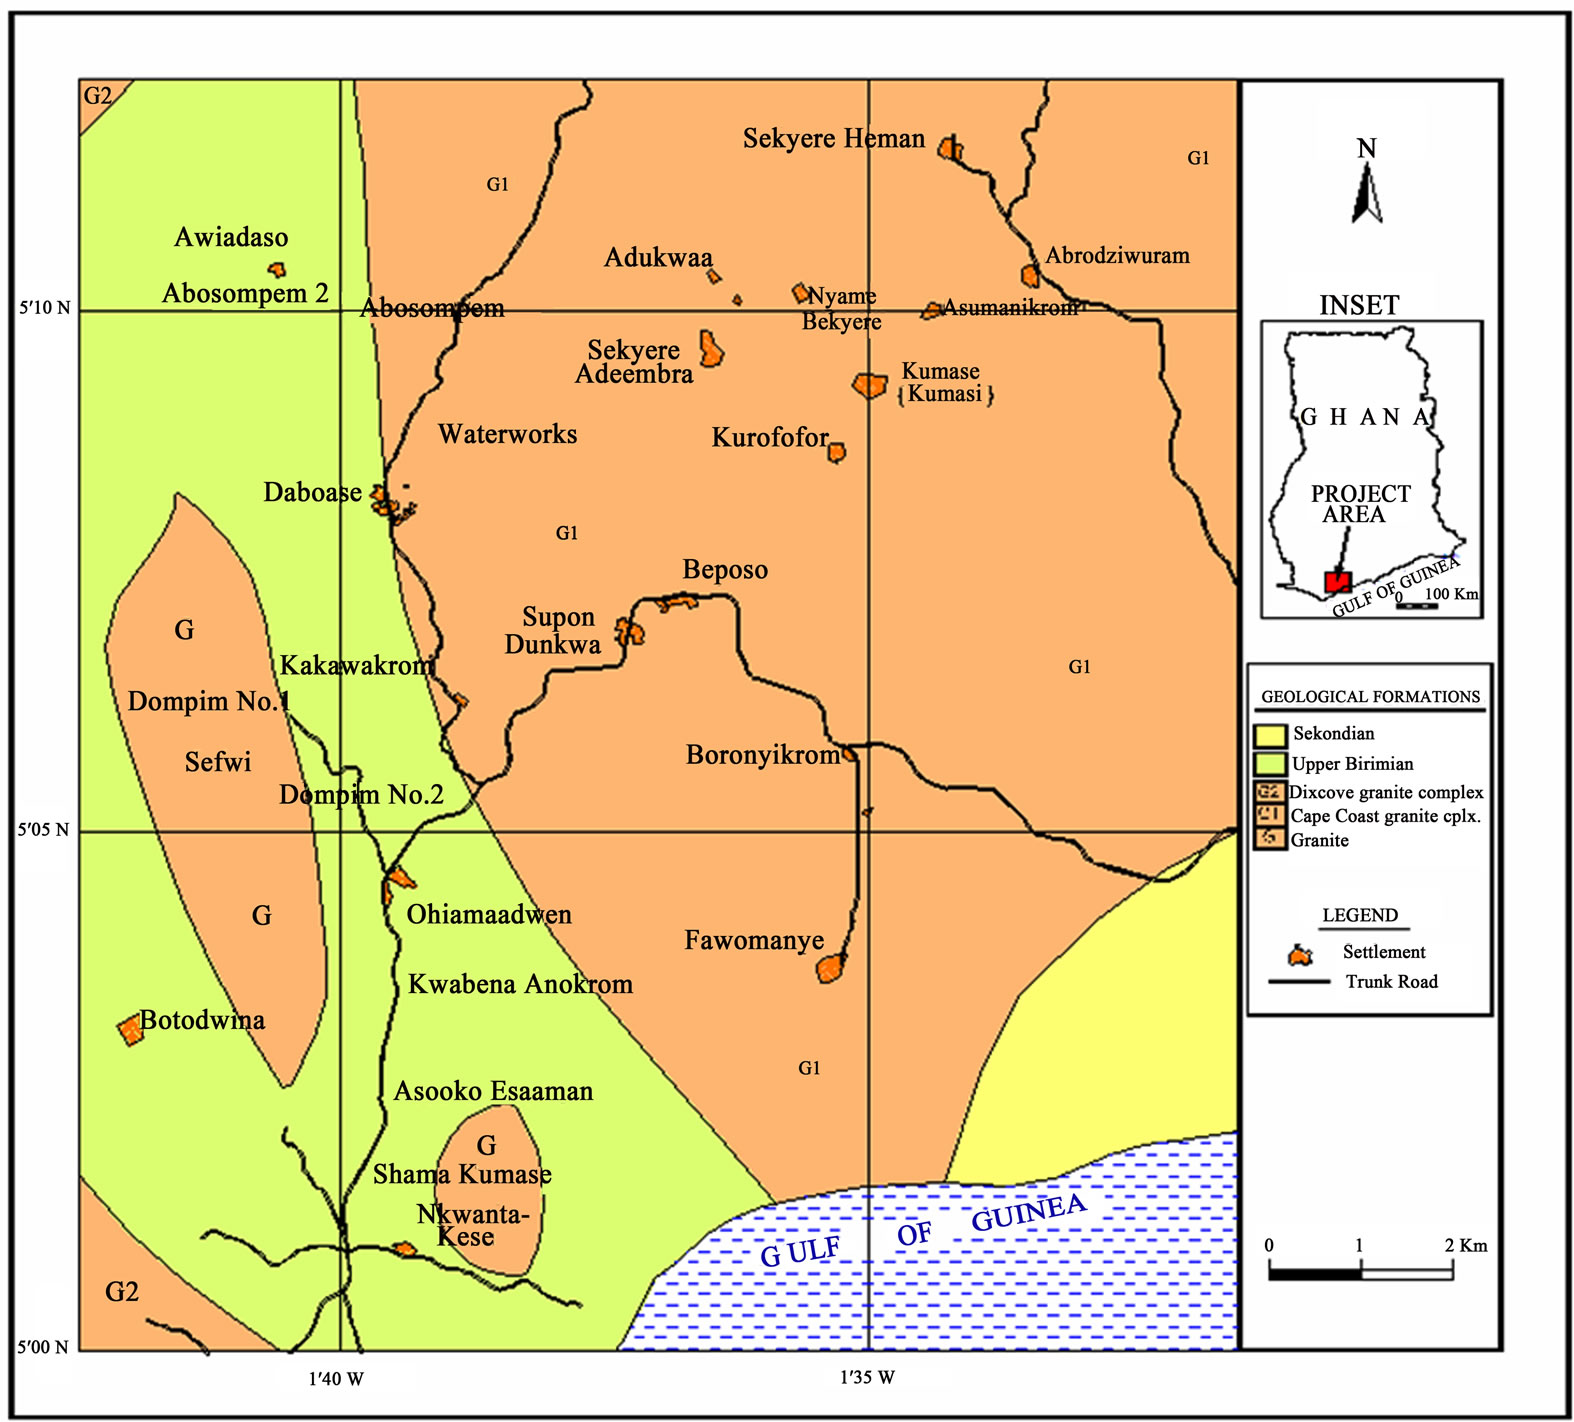
Figure 1. Location and geological map of the study area.
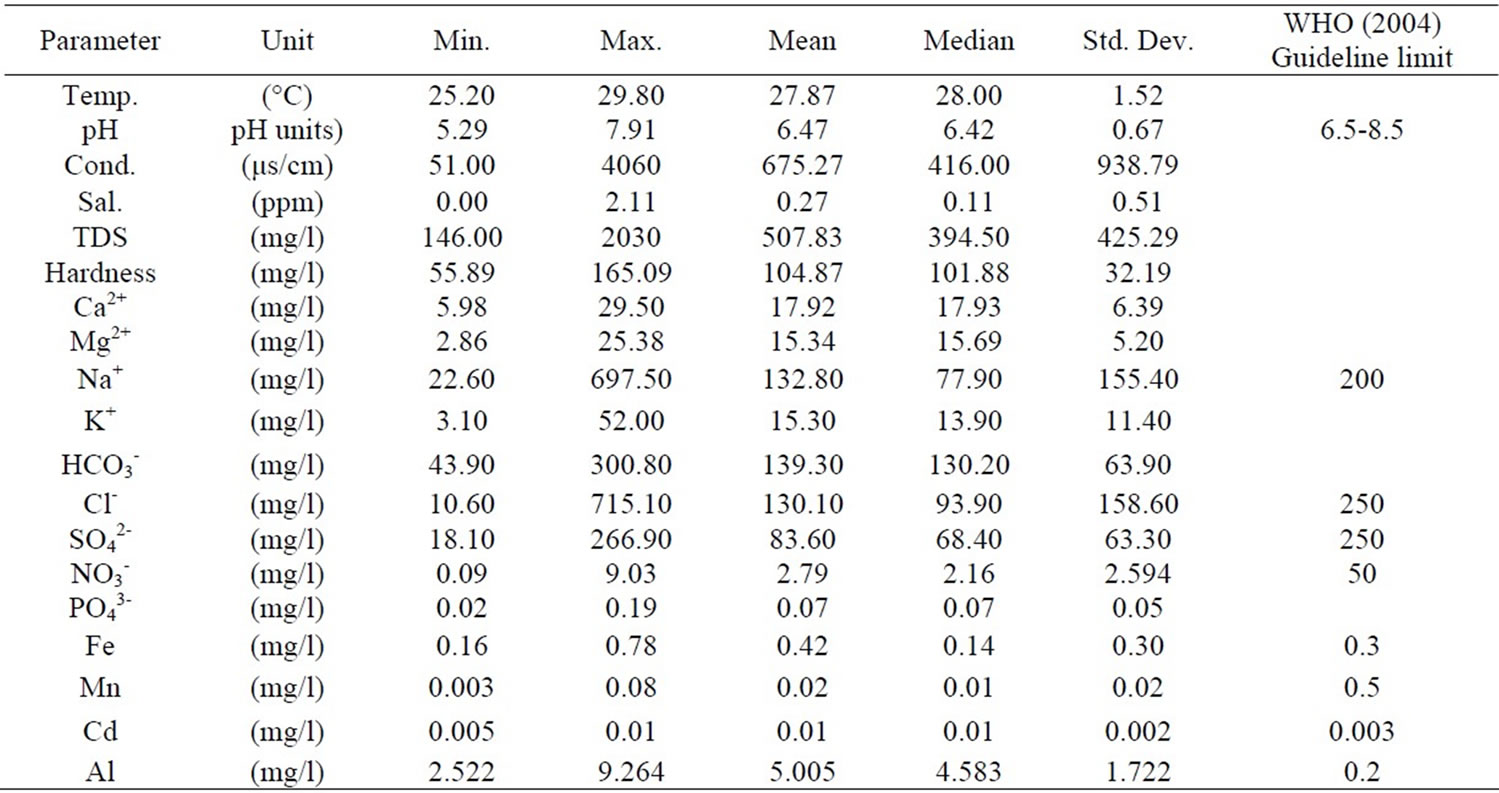
Table 1. Statistical summary of physical and chemical parameters.
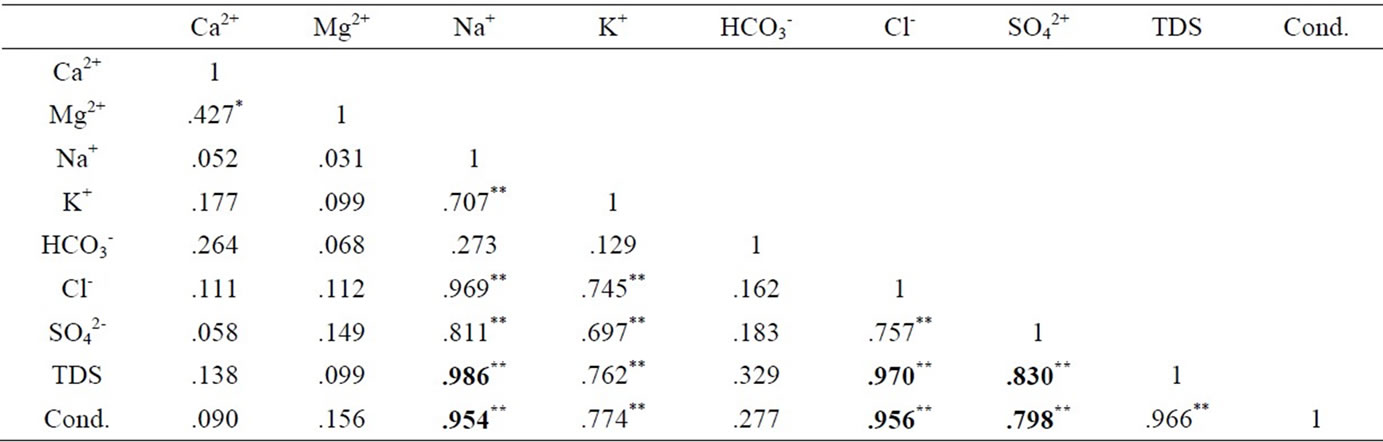
Table 2. Pearson correlation of major ions, TDS and conductivitye.
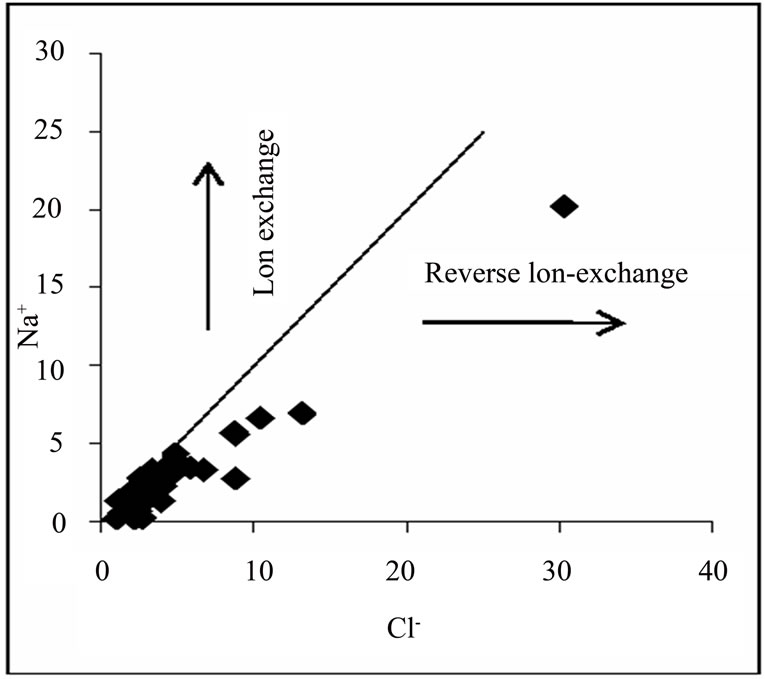
Figure 2. Na+ and Cl- relationship.
ter composition, a plot of Na-Cl against Ca+Mg−(HCO3 +SO4) will have a negative slope of unity [16]. Figure 3 shows a plot with a slope of −0.634, indicating some level of ion exchange. Also, approximately 6.5% of samples plot above the 1:1 line.
This percentage represents samples with Na+/(Na+ + Cl-) ratio greater than 0.5 and suggest that apart from sea aerosol spray, silicate dissolution could also be a source of sodium. The dissolution of albitic feldspars (NaAlSi3O8), which is present in the Cape Coast granite complex, could be the origin of excess Na+ ions.
The functional sources of dissolved ions can also be broadly assessed by plotting a graph of Na+: (Na+ + Ca2+) as a function of TDS [17]. The data points of the area on the Gibbs’ diagram in Figure 4 suggest chemical weathering of rock-forming minerals and evaporation.
Figure 5 shows the relationship between Ca + Mg (meq/l) and HCO3 + SO4 (meq/l). A 1:1 relationship could give an indication of gypsum, anhydrite, calcite and dolomite as the predominant processes controlling solution composition and groundwater falling below the 1:1 signifies ion exchange which involves the depletion of Ca + Mg as compared to HCO3 + SO4 [18]. A high per-
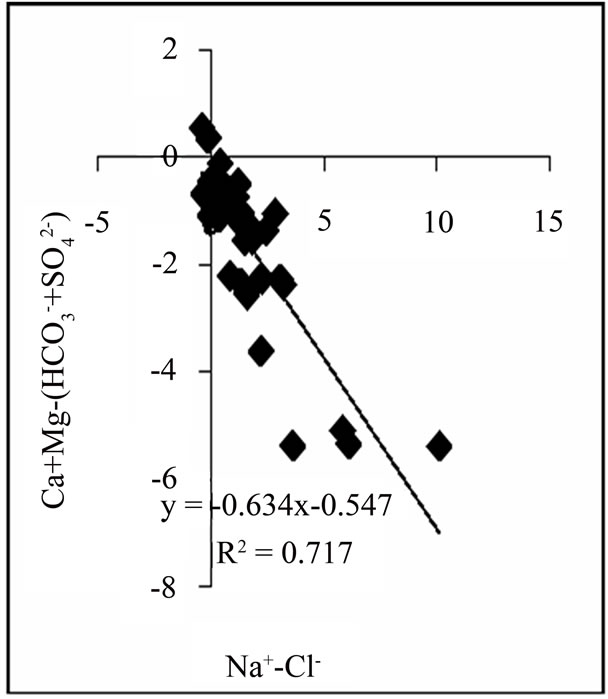
Figure 3. Relationship between Na-Cl and Ca+Mg−(HCO3 +SO4).
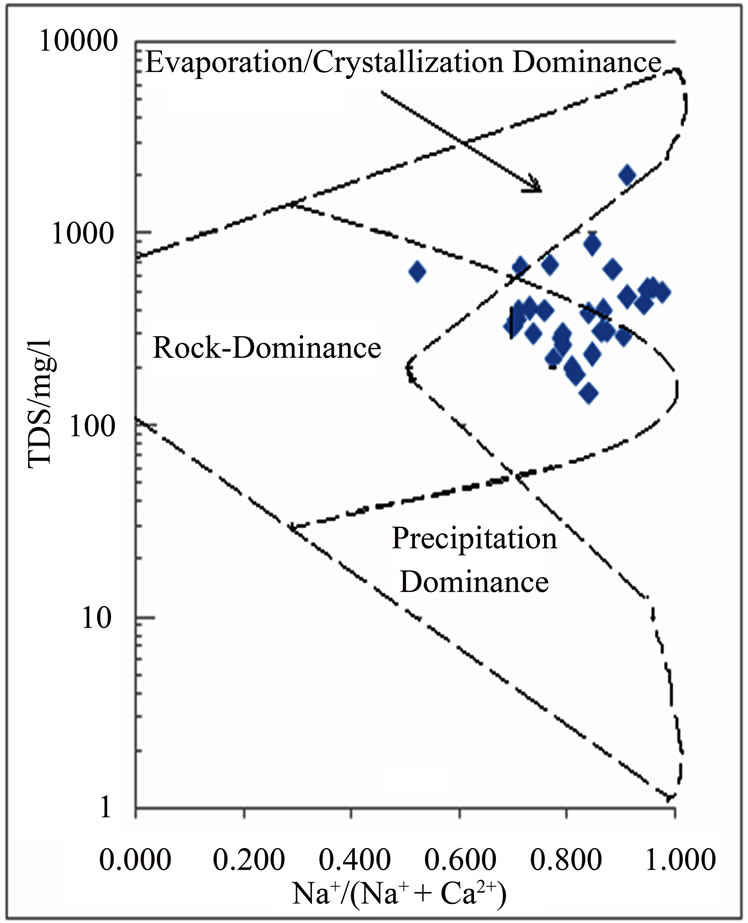
Figure 4. Mechanism governing groundwater chemistry.
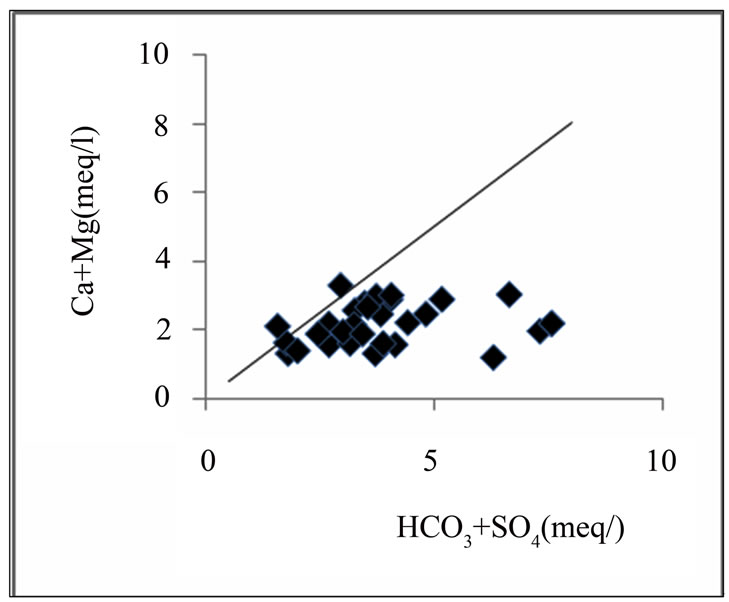
Figure 5. Relationship between Ca + Mg (meq/l) and HCO3 + SO4.
centage of the groundwater samples in the basin fall below 1:1 dissolution line: this further proves that there is some level of ion exchange. The plot also depicts deficiency of Ca + Mg relative to HCO3 + SO4. Therefore, Na+ must balance the excess HCO3 + SO4. Sulphate in the groundwater is derived principally from the evaporate minerals gypsum (hydrous calcium sulphate = CaSO4·2H2O), and the anhydride (CaSO4). It may also come from oxidation of pyrite, which is an iron sulfide mineral. The groundwater may also contain other minerals like MgSO4·7H2O (Epsom salt) and Na2SO4·10H2O (Glauber’s salt).
From the Pearson correlation, there is a fairly high correlation between calcium ions and the sulphate. Also, from the data obtained, there was lower concentration of calcium ions compared to sulphate ions (Ca2+ < SO42-) (Figure 6) which is an indication of oxidation of pyrite or calcium removal as a result of calcite (CaCO3) precipitation.
The nitrate concentrations obtained in the sampling area are very low. This is because the samples were taken from predominantly rural areas and the nitrate concentrations could not have been affected by urban wastewater and industrial activities. Sewages generated from domestic and industrial activities and septic tanks are also remote sources of NO3- in the area. The NO3- could originate from ammonium and NO3- fertilizers and aerobic decomposition of organic matter in the soils. All the groundwater in the basin had nitrate concentrations far below the WHO maximum acceptable value. The minimum and maximum concentrations are 0.089 mg/l and 9.028 mg/l respectively, far below 50 mg/l (WHO value). This is an indication of minimal application of ammonium and NO3- fertilizers in the basin. Other anthropogenic activities are not likely sources of nitrate in the basin.
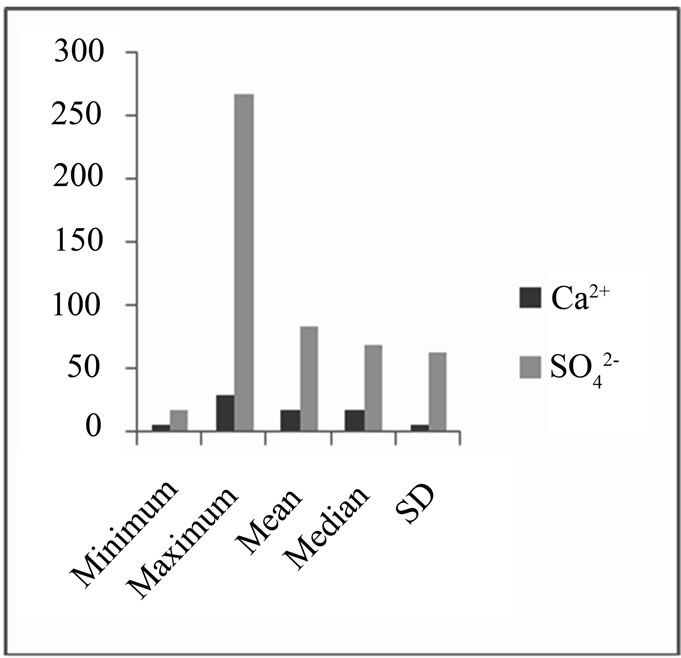
Figure 6. A bar chart: comparing Ca2+ and SO42-.
3.3. Trace Elements
3.3.1. Aluminium (Al3+)
The minimum, maximum, mean, median concentrations, as well as the standard deviation and WHO acceptable limit for drinking water has been depicted in the Table 1. All samples clearly had concentrations higher than the acceptable limit. The lower Pra Basin contains potassium feldspars (KAlSi3O8), albitic feldspars (NaAlSi3O8) and plagioclase (CaAl2Si2O8). The relatively high concentration of Al could be a result of the dissolution of these salts.
3.3.2. Iron (Fe)
A minimum of 0.16 mg/l and a maximum of 0.776 mg/l were recorded (Table 1). Approximately 90% of the water has concentration greater than 0.3 mg/l, the WHO standard for iron in drinking water. Igneous rocks minerals whose iron content is relatively high include the pyroxenes, the amphiboles, biotite magnetite and especially the nesosilicate olivine [19]. The Lower Pra Basin has the biotite, which might be the sources of high iron concentrations in the basin.
3.3.3. Manganese
Manganese occurs in rocks mainly as manganese and manganeferrous oxides, particularly in areas underlain by Birimian rocks [4]. Reaction between these oxides and the mildly acidic groundwater results in the production of manganous ion (Mn2+). The manganese concentration measured varies from 0.003 mg/l to 0.078 mg/l. All the measured concentration values are lower than 0.5 mg/l, which is the WHO 1993 permissible limit for potable water [20]. A high concentration of manganese is undesirable impurity in water owing to a tendency to deposit black oxide stains but this was not observed. Manganese usually occurs with iron as redox couple, where the Mn2+ is reduced to Mn and the iron II (Fe2+) is oxidized to iron III (Fe3+).
3.3.4. Cadmium
Cadmium naturally occurs as accessory element in zinc ore (sphalerite, ZnS) (largest industrial source), CdS; CdCO3 (rare). Anthropogenic sources are industrial wastes (batteries; electroplating; pigment manufacture; video/fluorescenttubes, Galvanized pipes, Roadside soils (vehicle use) [21]. The maximum and minimum concentrations of cadmium measured in the lower Pra basin are 0.013 mg/l and 0.005 mg/l respectively. The zinc (Zn) concentrations were below detection limit (0.0010) which implies Cd could not have occurred as an accessory element of zinc ore, sphalerite. The other natural sources (rare) could have contributed to the concentration of cadmium in the basin. The cadmium concentrations are above the WHO limit of 0.003 mg/l (WHO, 1993).
3.4. Hydrochemical Facies
Hydrochemical facies are generally distinct zones that cation and anion concentrations are described within defined composition categories [22]. The chemical composition of groundwater from the lower Pra Basin is presented in Figure 7. A high percentage of samples clustered in the Na-Cl dominant section. Therefore, from the analysis of the chemical plot in the triangular field of the Trilinear Piper, Na-Cl water is the major water type. Minor water types identified are Na-Mg-Ca-HCO3, Ca-MgHCO3, and Na-Cl-SO4.
4. Conclusions
The hydrochemical analysis of groundwater in the lower Pra basin revealed that the water is mildly acidic to basic (5.29-7.91). The physico-chemical parameters suggest that the groundwater in the lower Pra basin is generally good for domestic use. Approximately 97% of the water sampled has TDS values less than 1000 mg/l, this falls within fresh water recommended value which is between 0 and 1000 mg/l. Chemical parameter (ions in the water) is influenced primarily by silicate weathering, ion exchange processes and sea aerosol spray. Sodium ion (Na+) concentration is generally high compared to other cations. Bicarbonate (HCO3-) is the most abundant anion with a total concentration of 4251.04 mg/l, followed closely by chloride ions. Aluminium showed relatively high concentrations; all the water sampled has Al concentration greater than 0.2 mg/l, which is the W.H.O. maximum acceptable limit for drinking water. The minimum and maximum iron concentrations are 0.161 mg/l and 0.776
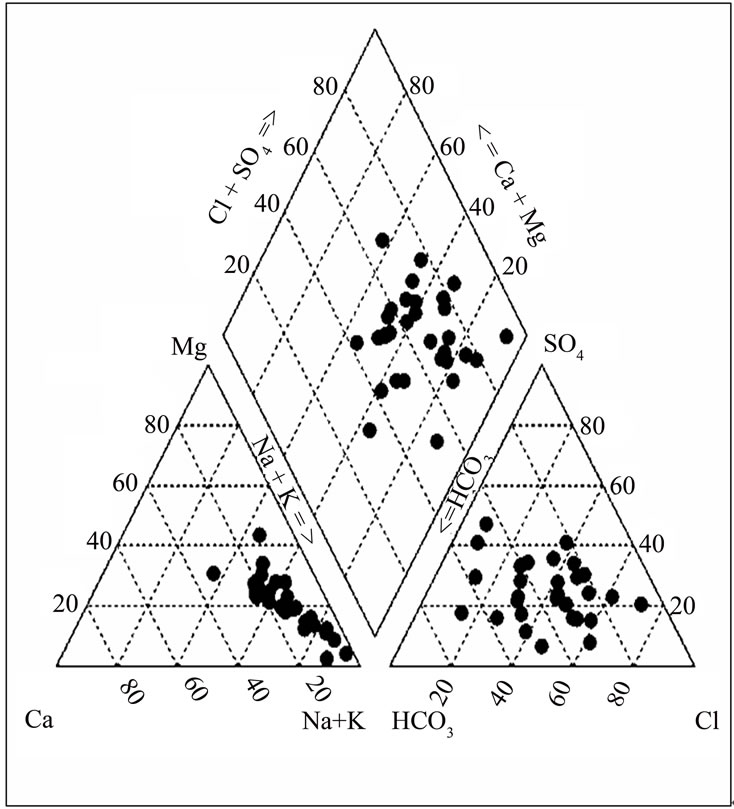
Figure 7. Trilinear piper diagram.
mg/l respectively. Approximately 90% of the samples have iron concentrations greater than the W.H.O. limit for drinking water which is 0.3 mg/l. Considerable concentrations were recorded for manganese (0.003 mg/l to 0.078 mg/l). These are, however, lower levels compared with the W.H.O. guideline limit of 0.5 mg/l. The maximum and minimum concentrations recorded for cadmium (Cd) are 0.005 mg/l and 0.013 mg/l respectively. Concentrations of lead (Pb) zinc (Zn) were below detection limit of the AA240FS Fast Sequential Atomic Absorption Spectrometer used. The ground waters in the basin are generally NaCl waters. Minor water types such as Ca-Mg-HCO3, Na-Mg-Ca-HCO3 and Na-Cl-SO4 were also delineated.
REFERENCES
- A. A. Duah, “Groundwater Contamination in Ghana, Yongxin Xu and Brent Usher,” Taylor and Francis Group, London, 2007, pp. 57-64.
- L. P. Smedly, W. M. Edmunds, J. M. West, S. J. Gardner and K. B. Pelig-Ba, “Vulnerability of Shallow Groundwater Quality Due to Natural Geochemical Environment. Health Problems Related to Groundwater in the Obuasi and Bolgatanga Areas, Ghana,” Report Prepared for ODA under the ODA/BGS Technology Development and Research Programme, Project 92/5, 1995.
- G. Benneh and B. K. Dickson, “A New Geography of Ghana,” Pearson Education Limited, England, 2004, pp. 24-27.
- G. O. Kesse, “Rocks and Minerals of Ghana,” 1985, pp. 25-26.
- H. C. Claasen, “Guidelines and Techniques for Obtaining Water Samples that Accurately Represent the Water Quality of an Aquifer,” U.S. Geological Survey Open File Report 82-1024, 1982.
- M. Barcelona, J. B. Gibb, J. A. Helfrich and E. E. Garske, “Practical Guide for Groundwater Sampling,” Illinois State Water Survey ISWS, Contract Report 374, 1985.
- APHA, “Standard Method for the Examination of Water and Wastewater,” 20th Edition, American Public Health Association, Washington D.C., 1998.
- J. A. C. Broekaert, “Analytical Atomic Spectrometry with Flames and Plasmas,” 3th Edition, Wiley-VCH, Weinheim, 1998.
- M. B. Sperling and B. Welz, “Atomic Absorption Spectrometry, ” Wiley-VCH, Weinheim, 1999.
- D. D. Sood, A. V. R. Reddy and N. Ramamoorthy, “Fundamentals of Radiochemistry,” 2004.
- A. Chatt, N. Desilva, J. Holzbecher, D. C. Stuart, R. E. Tout and D. E. Ryan, “Cyclic Neutron Activation Analysis of Biological and Metallurgical Samples,” Truce Analysis Research Centre, Department of Chemistry, Dalhousie University, Halifax, 1980.
- A. Chatt, J. Desilva, D. C. Holzbecher, R. E. Stuart, R. E. Tout and D. E. Ryan, “Cyclic Neutron Activation Analysis of Biological and Metallurgical Samples,” Canadian Journal of Chemistry, Vol. 59, No. 5, 1981, pp. 1660-1664.
- K. Vetter, “Neutron Activation Analysis with HPGe Detectors,” NE 104A Experiment 6, University of California, Brekeley, 2008, pp. 1-6.
- D. Langmuir, “Aqueous Environmental Geochemisty,” 2nd Edition, Prentice Hall, Upper Saddle River, New Jersey, 1997.
- U. M. Amadi and P. A. Amadi, “Saltwater Migration in the Coastal Aquifers of Southern Nigeria,” Journal of Mining and Geology, Vol. 26, No. 1, 1990, pp. 35-44.
- R. S. Fisher, F. W. Mullican, “Hydrochemical Evolution of Sodium-Sulphate and Sodium-Chloride Groundwater beneath the Northern Chihuahuan Desert, Transpecos, Texas, U.S.A.,” Hydrogeology Journal, Vol. 5, No. 2, 1997, pp. 14-16.
- R. J. Gibbs, “Mechanisms Controlling World Water Chemistry,” Science, Vol. 170, No. 3962, 1970, pp. 1088- 1090.
- W. Mclean and J. Jankowski, “Groundwater Quality and Sustainability in an Alluvial Aquifer, Australia,” In: Sililo et al., Eds., Proceedings of XXX IAH Congress on Groundwater: Past Achievements and Future Challenges, A. A. Balkema, Rotterdam, Brookfield, Cape Town, South Africa, 26 November-1 December 2000.
- J. D. Hem, “Study and Interpretation of Chemical Characteristics of Natural Water,” 3rd Edition, USGS Water-Supply Paper, 1992.
- World Health Organization (WHO), “Guidelines for Drinking Water Quality, Revision of the 1984 Guidelines,” Final Task Group Meeting, Geneva, 1993.
- D. W. Bolton, “Cadmium in Groundwater and Sediment Samples in the Aquia Aquifer,” Groundwater Symposium, Maryland Geological Survey, 2006.
- D. U. Ophori and J. Toth, “Patterns of Groundwater Chemistry, Ross Creek Basin, Alberta, Canada,” Groundwater, Vol. 27, No. 1, 1989, pp. 20-26.
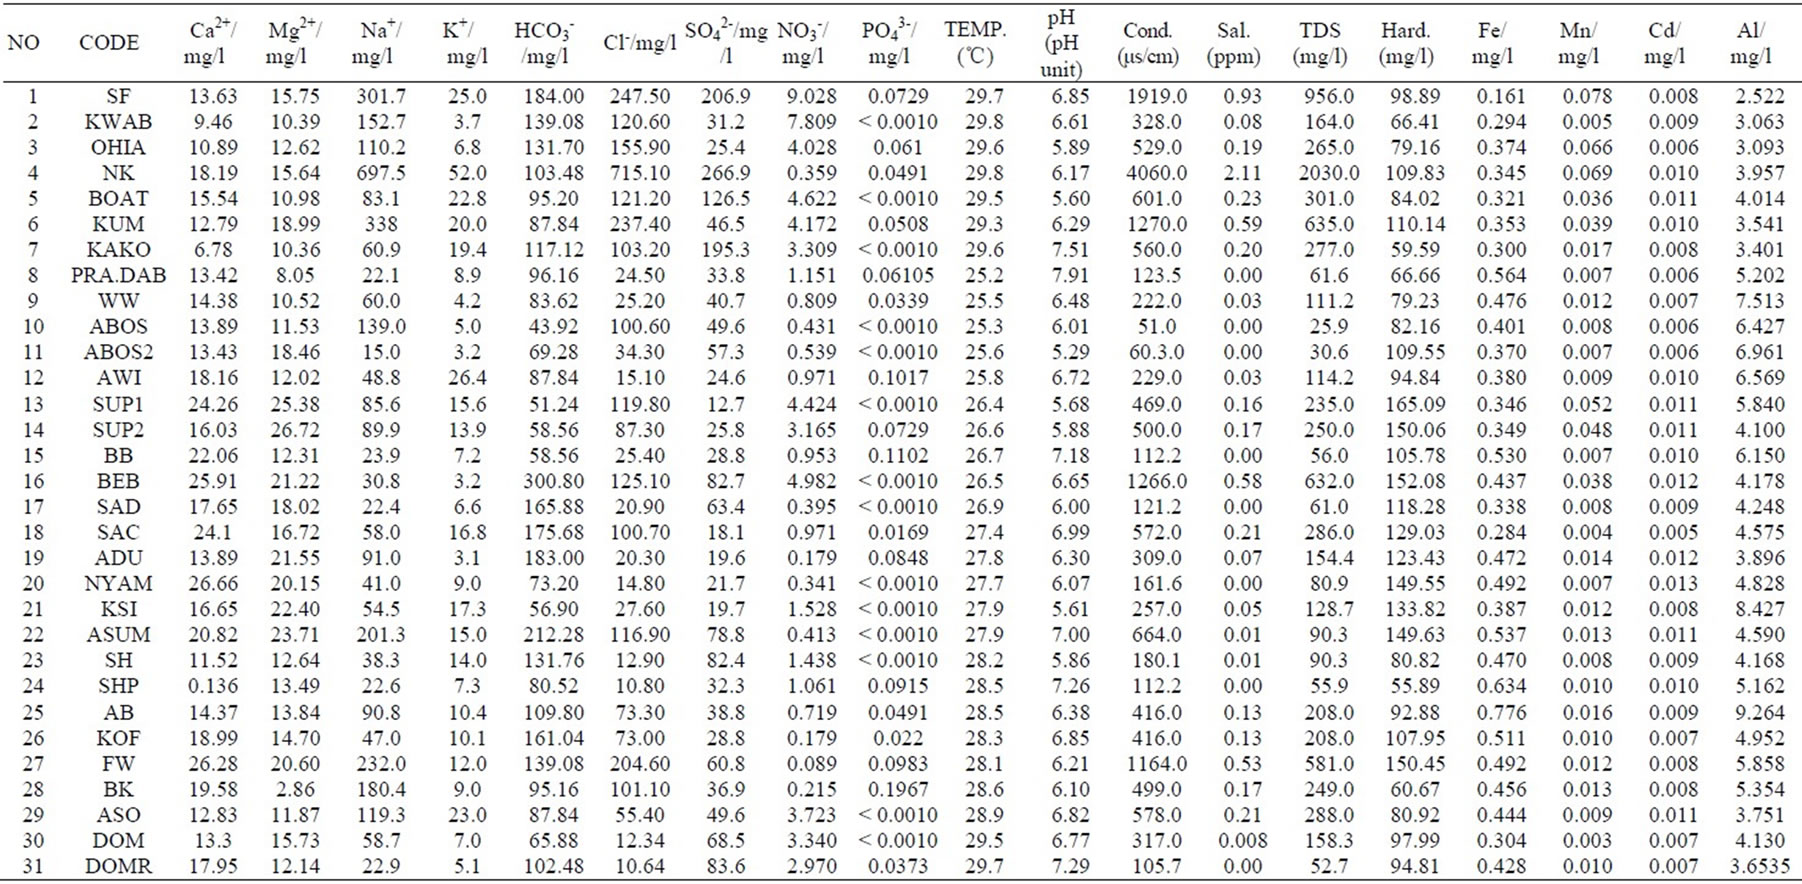
Appendix. Measured Parameters.