Journal of Water Resource and Protection
Vol. 2 No. 6 (2010) , Article ID: 2065 , 8 pages DOI:10.4236/jwarp.2010.26060
Multiphase Flow Simulations through Tarbela Dam Spillways and Tunnels
Faculty of Mechanical Engineering GIK Institute of Engineering Sciences & Technology, Topi, Pakistan
E-mail: abid@giki.edu.pk, engr.m.rehman@gmail.com
Received March 12, 2010; revised April 1, 2010; accepted May 4, 2010
Keywords: Tarbela Dam, Reservoir Flow Simulation, Multiphase Flow, Spillways, Tunnels
ABSTRACT
Tarbela dam is one of the largest earth filled dam in the world used for power generation and irrigation purposes. Like all reservoirs the sediments inflow in the Tarbela reservoir has resulted in reduction in water storage capacity and is also causing damage to the tunnels, power generating units and ultimately to the plant equipment. This numerical study was performed to predict the flow patterns and characteristics in Tarbela dam. Tunnel 3 and 4 inlets; originally on the bed level were raised in the 3-D model and meshed. Analysis was performed using multiphase flow (water and air) for maximum inflow in the reservoir, i.e., considering summer season and discharging water through different locations, i.e., tunnels and spillways. Pressure, velocities, flow rate and free surface height results obtained were found in good agreement with the analytical and existing results where available. Results show uneven discharge through each gate due to maximum velocity near exits and overall stagnant phenomena of water within the reservoir. Maximum velocity was observed along the spillways outlet. Strong vortex motion was observed near the spillways outlet and tunnel inlets. New design of Tunnels 3 and 4 were suggested to WAPDA in order to decrease the sediment inflow and improvements in design of the spillways were suggested.
1. Introduction
Tarbela dam was constructed in 1970’s to regulate seasonal flows of the upper Indus for irrigation of the plains downstream and for hydro power generation. Reservoir length is 96.6 km with catchment area of 250 km2 and storage capacity of 13.69 km3. Even after 39 years it is the only major storage reservoir on the Indus. In addition to the irrigation releases exceeding 6.4 MAF it generates up to 3478 MW of electricity, and provides 32% of Pakistan’s power needs. It is an asset of Pakistan and is one of the largest lakes of the world. Tarbela is located within the Indus Basin. The lake consists of main embankment dam with a length of 9000 ft and height of 470 ft and two auxiliary dams. It has two spillways i.e., the service spillways and the auxiliary spillways and six tunnels. Service spillways have 7 Gates (50 feet wide × 58 feet high), auxiliary spillway has 9 Gates (50 feet wide × 58 feet high). Three tunnels in the right abutment are used for irrigation and power generation. Other three are used only for irrigation purposes [1].
1.1. Sedimentation
It was recommended by Rust that the principal parameters which govern sedimentation in lakes and rivers can be divided into three categories: physical, chemical and biological [2]. Due to sediment deposition and formation of delta, flow at mouth of small tributaries was blocked. Pools, thus created, further reduce capacity of reservoirs [3]. Tarbela Lake seizes the water of Indus which contains a heavy sedimentation load. During spring and summer season, melting of snow in the Himalayan and Karakorum region causes erosion of the upland catchment. Average sediment inflow in Tarbela Lake was approximately 265 Mt (Metric Ton) per year [4] hence; reduced capacity of the reservoir due to sedimentation delta profile is given in Table 1 [5], and sedimentation delta profile till 2006 is shown in Figure 1 [6]. Keeping in view the sediment flows in the reservoir, the aim was to study and analyze different parameters of hydrology.
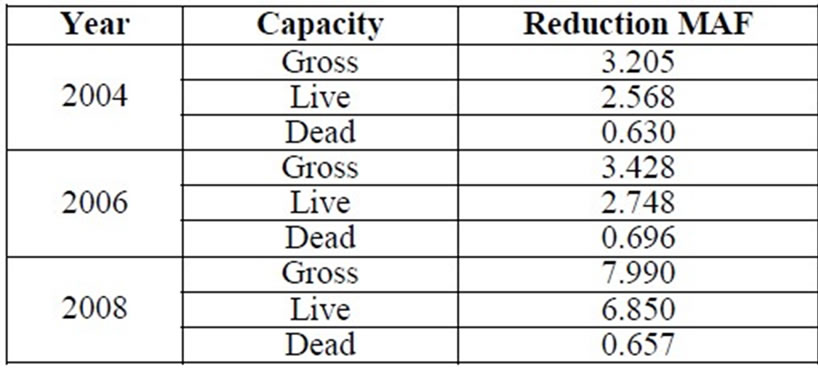
Table 1. Reduced capacity of Tarbela lake.
2. Methodology
2.1. Material Selection, Modeling and Meshing
A 3-D model of the Tarbela Dam was made using data and drawings collected from WAPDA including original reservoir base, auxiliary spillways, service spillways, main embankment dam and six tunnels [6-9]. As per recommendations given in [6] tunnel 3 and 4 inlets which originally were on the base were modified and were raised to height of 46.8 m. Table 2 shows the details of the materials used in the study [10-11].
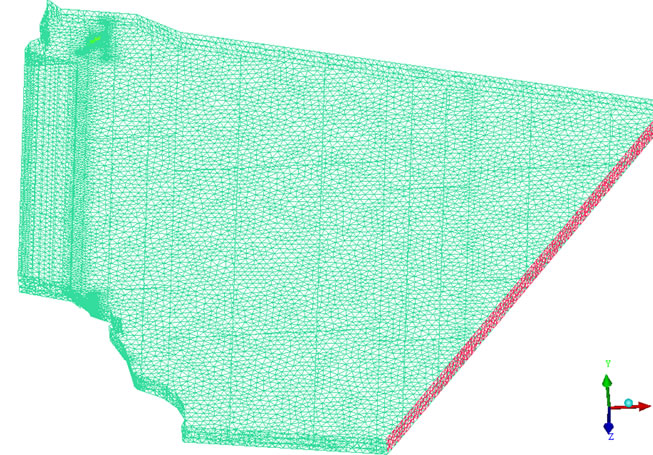
Initially 117701 tetrahedral elements were generated using ICEM CFD® with maximum element size of 30.5 m, keeping in view the refinement along the spillways and tunnels (Figures 2(a-c)). Later on using adaptive meshing, 2589215 elements were used in CFX® for predicting free surface accurately (Figures 2(d-e)) [10].
2.2. Boundary Conditions and Solution
Sediment particles were not included during analysis.
Homogeneous model was used to model the free surface.  turbulence model was used during analysis [12]. Domain was considered as isothermal and incompressible [10]. Analysis was performed using volume of fluid method for the maximum inflow of 116 × 105 kg/sec in the reservoir during the summer flood season. Average velocities given in Table 3 were taken on the tunnels inlets [13]. Along free-surface, service spillways and auxiliary spillways zero Pascal pressure was applied as they were exposed to the atmospheric pressure. No slip conditions were applied on the walls of the reservoir. Table 4 defines detailed boundary conditions.
3. Results and Discussion
Two case studies were performed
1) Four tunnels and both spillways were open.
2) Service spillways and Auxiliary spillways were open.

Table 2. Material model details.
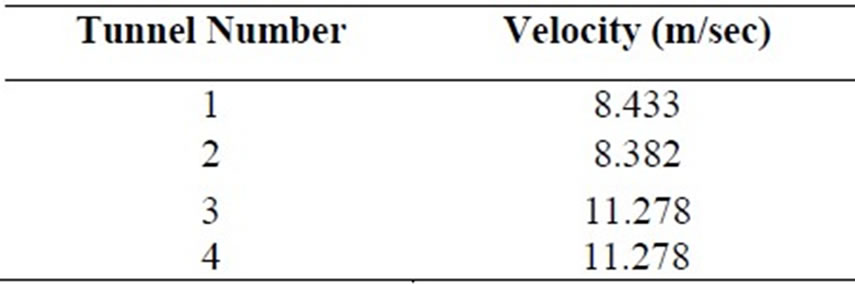
Table 3. Velocities on tunnels.

Figure 1. Sedimentation profile for 1974 to 200.
 (a)
(a)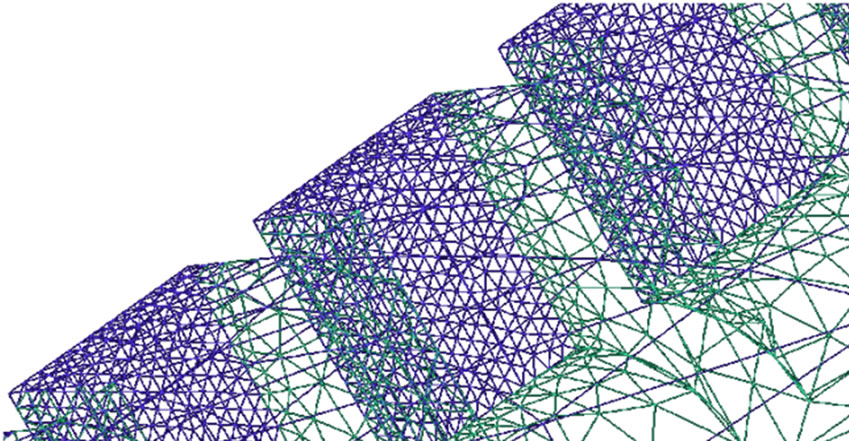 (b)
(b) (c)
(c) (d)
(d) (e)
(e)
Figure 2. Initial mesh generation using ICEM. (a) Meshed geometry, fine mesh around; (b) Service Spillways; (c) Tunnel 1, mesh refinement using CFX; (d) first refinement level; (e) second refinement level.
3.1. Velocity
3.1.1. Case-1
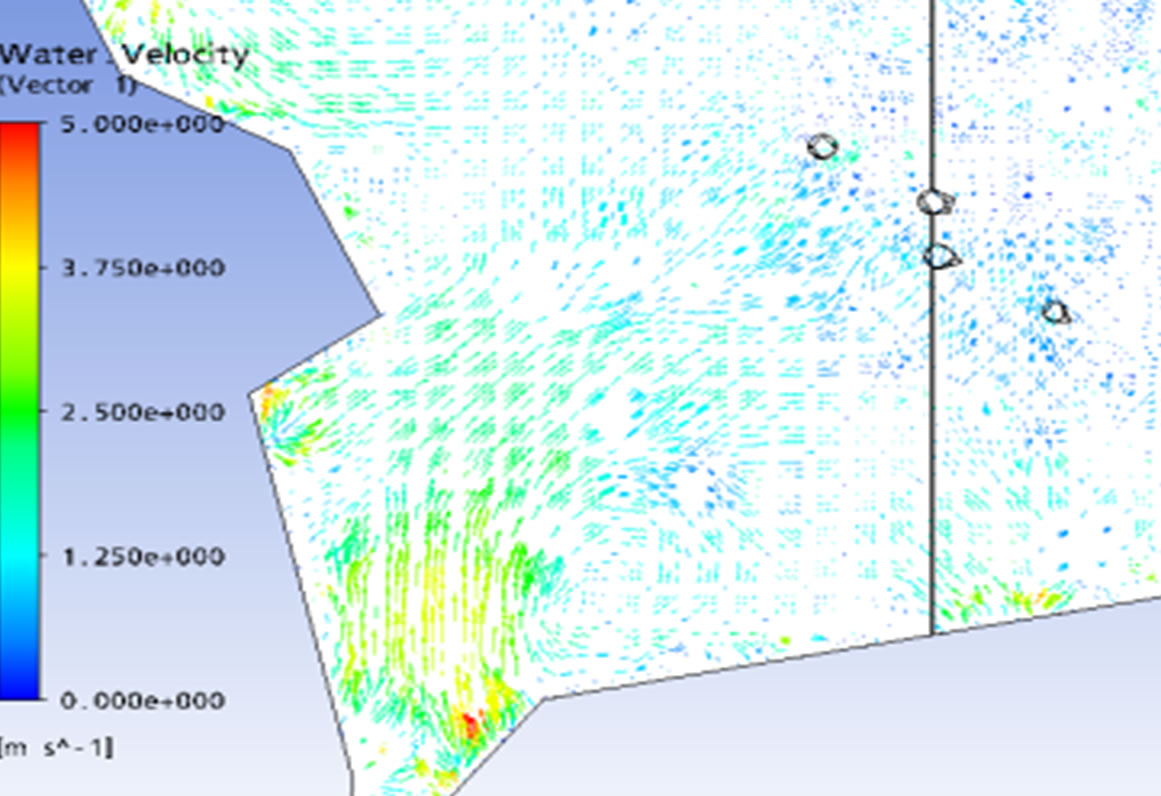
A velocity of 1.3 m/sec was observed in the reservoir. Due to low level of free-surface, water was only flowing through the tunnels and not spillways. Velocity vectors showing vortices produced due to the suction of water in the tunnels as shown in Figure 3(a). Each tunnel had an area of influence; from where it sucked water and produced chaotic effects in the water. This was observed by the streamlines of each of the four tunnels and the plane collectively. Four tunnels were located between the right bank and main Embankment dam; so disturbance was also produced in the same location, i.e., top right corner of the domain as shown in Figure 3(b).
Production of vortices was common in both the case studies. In current case study where all the tunnels were open; water was mostly sucked from the free stream and strong vortex motion was observed close to the inlets of the tunnels (Figure 3(c), Figure 3(d) and Figure 5(a)).
Tunnel 1 sucked water mainly from three locations of the free stream over the tunnel, near the main embankment dam and middle of the reservoir approximately 1.13 km from the main embankment dam. Tunnel 2 showed same behavior as tunnel 1; but sucked more water from free stream just above it. Tunnel 3 sucked almost all the water from free stream above it and some from the right corner from the direction of the flow. Tunnel 4 sucked almost all of the water from the free stream above it (Figure 3(b)). Therefore it is concluded for current case study that as tunnel inlets move away from the boundaries of the reservoir; water is sucked from the free stream above it. When tunnels took in water from the free stream it did not revolve around the tunnel much. Revolving water would displace sediment from the bed of the reservoir to the tunnel inlets; which would damage turbines, gates and tunnels. So it was reasoned that tunnels inlets should be far away from the reservoir boundary. Appropriate Distance between tunnels and boundary can be calculated by analyzing the flow field of that particular domain (Figure 3).
3.1.2. Case-2
Water showed similar stagnant behavior in the reservoir. It speeded up when it came near the spillways. Water flowed smoothly towards both the spillways. Reason was that water got larger area to flow out of the domain which decreased the flow rate through each gate. So there was less chaotic effect observed than notified in case studies where only one of the spillways was open.
Auxiliary spillways have good design due to which water velocity remained near 1.25 m/sec in the moorage
 (a)
(a)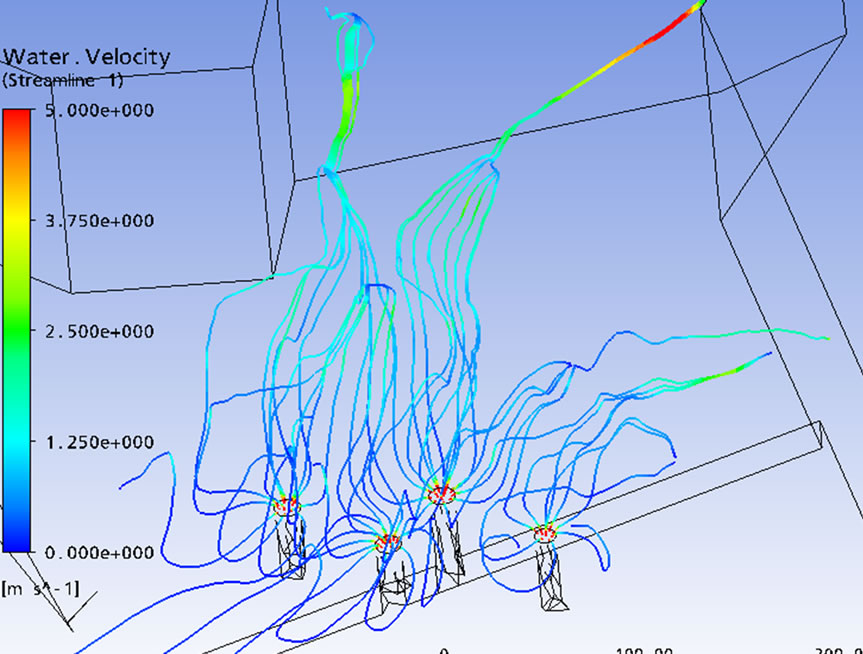 (b)
(b)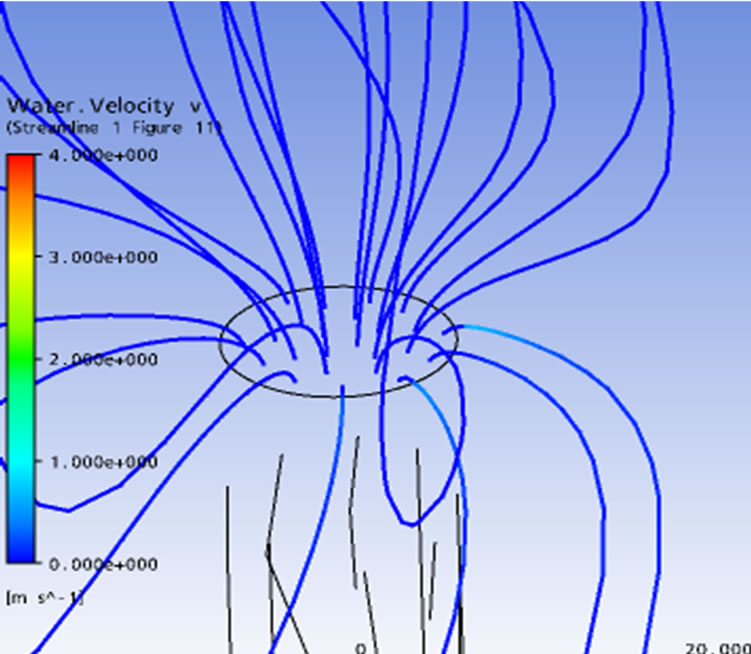 (c)
(c) (d)
(d)
Figure 3. Case study 1 results. (a) velocity vectors; (b) Stream lines of all tunnels; (c) Stream lines through Tunnel1; (d) Tunnels sucking water from free surface.
 (a)
(a) (b)
(b)
Figure 4. Velocity vectors through. (a) Auxiliary spillways; (b) Service spillways.
 (a)
(a) (b)
(b)
Figure 5. Pressure distribution. (a) with free surface; (b) with respect to surface height.
area but crossed 5 m/sec as it reached the domain boundary. Water discharge was not uniform through all the gates of the spillways (Figure 4(a)). Although both the spillways shows speedy swimmingly flow of water but near the service spillways the water speeded up to 2.5 m/sec and exceeds 5 m/sec before it exited the domain. Vortices were generated at the corners of the service spillways structure (Figure 4(b)). Corner gates of both the spillways showed non-uniformity in flow compared to the central gates.
A similar flow field was observed by Sungyul for Soyang dam, Korea. Water in the reservoir showed a stagnant behavior and velocity was observed up-to 5 m/sec with strong vortex effect near the exit [14].
3.2. Pressure Distribution
Pressure distribution obtained by the Navier Stokes equation was compared with the analytical results using p = γh [15] and were observed in good agreement. From this it could be concluded that other results predicting different behaviors will also agree with the original reservoir flow patterns. Pressure distribution was hydrostatic for both the cases and thus absolute pressure increased directly proportionally to the depth of the water column. Maximum pressure obtained numerically for the case study 1 was 1.17 MPa and for case 2 was 1.33 MPa (Figures 5 and 6). In current problem water was moving so potential energy of water was converted into kine-
 (a)
(a)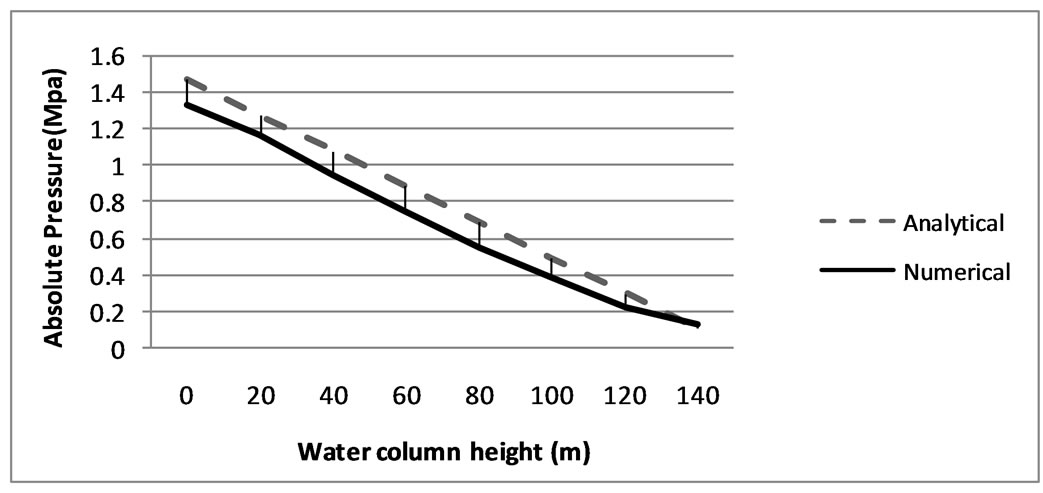 (b)
(b)
Figure 6. Pressure distribution. (a) with free surface; (b) with respect to surface height.

Figure 7. Free surface profile through auxiliary spillways.
tic energy resulting in a difference between the results.
3.3. Free Surface
Step function was used to define air and water volumes. Number ‘0’ and ‘1’ represented water and air respectively. An iso-surface was plotted on ‘0.5’ representing free surface. Ripples on the iso-surface showed air flowing over free-surface of water (Figure 7). If water surface was at a lower level; delta of sediment was exposed to free atmospheric conditions and there were more chances of sediment to flow towards main embankment dam. For both the case studies free surface was maintained above the minimum pool level (76 m). Free surface height varied throughout the domain with an average value of 110 m for case 1 and 123 m for case 2 which was good for the reservoir capacity, tunnels and equipments installed on them [5]. For case 2 inclined freesurface from the corners gates to the central gates was observed due to non-uniform flow through the spillways gates discussed earlier in velocity. Similar behavior of the free-surface was predicted for Soyang Dam [14].
4. Conclusions
1) Areas of water exits i.e. at spillways and tunnels were very small compared to the reservoir so dynamic behavior of water was observed along spillways and tunnels and almost static behavior was observed in the reservoir.
2) Due to slow movement of water sediment should move very slowly in the reservoir.
3) If sediment particles accelerate towards the main embankment dam and choked the tunnels; reason would be other than water movement towards the main embankment.
4) Water flow was chaotic within the moorage area near both the spillways.
5) Service spillways produced more chaotic flows than the auxiliary spillways.
6) Spillways should be designed such that they are facing the water flow in perpendicular direction for easy flow.
7) Spillways should be placed at locations where there is deep water reservoir with no sharp edges on the corners. This will avoid chaotic flow of the water.
8) Spillways design should be such that water is not constrained into a structure before discharge; as this is observed in the case of service spillways design.
9) Auxiliary spillways should be opened instead of service spillways for discharge because more maintenance will be required for service spillways due to chaotic flows.
10) The water at corner gates in both spillways showed very strong vortex motion, resulting in non-uniform discharge through each gate.
11) Moorage area around spillways should be strengthened to avoid washing away of sand from the mountains/hills.
12) Central gates of both the spillways have relatively uniform discharge.
13) Water flow through spillways did not affect the sedimentation in bed of Tarbela dam reservoir.
14) Tunnel 3 and 4 at the current location, i.e., at the base of the reservoir took in large amount of sediment particles, damaging not only the tunnels but also equipment installed on it [5].
15) Both these tunnels must be modified and inlet must be raised 47 m from the bed level.
16) Water produced vortices as it entered the tunnels; this effect should be considered during structural design of tunnels.
17) If only single tunnel was opened; due to swirling of water around the tunnel base; sediment particles were picked up and sucked into the tunnel damaging the tunnel and equipments installed on it.
More than one tunnel should be opened at any time to increase discharge from the location. For such case water will be taken directly from the free stream eliminating chances of sediment entering from the tunnel base.
REFERENCES
- E. L. Tate and F. A. K. Farquharson, “Simulating Reservoir Management under the Threat of Sedimentation: The Case of Tarbela Dam on the River Indus,” Water Resources Management, Vol. 14, No. 3, 2000, pp. 191-208.
- B. R. Rust, “Sedimentation in Fluvial and Lacustrine Environments,” Hydrobiologia, Vol. 91, 1982, pp. 59-70.
- T. S. Fuat entürk, “Hydraulics of Dams and Reservoirs,” Water Resources Publications, Littleton, 1994.
- C. T. Yang, “Applications of GSTARS Computer Models for Solving River and Reservoir Sedimentation Problems,” Tianjin University and Springer-Verlag, Tianjin, 2008.
- Water and Power Development Authority, “Periodic Inspection Report of Pakistan,” Pakistan, 2007.
- Department of Survey, “Report on Sedimentation Profiles Pakistan,” Water and Power Development Authority, 2007.
- Consultants, TAMS, “Tarbela Dam Project,” Drawings, Water and Power Development Authority, Vol. 4, 1968.
- Consultants, TAMS, “Tarbela Dam Project,” Drawings, Water and Power Development Authority, Vol. 5, 1968.
- Consultants, TAMS, “Tarbela Dam Project,” Drawings, Water and Power Development Authority, Vol. 6, 1968.
- M. Francisco, A. M. G. Lopes and V. A. F. Costa, “Optimization of a Sanitary Discharge Valve Using a Numerical Approach,” Proceedings of the 5th WSEAS International Conference on Simulation, Modeling and Optimization, Tenerife, 2005.
- ANSYS Europe, Ltd, “ANSYS CFX Solver Modeling Guide,” ANSYS CFX Release 11.0. © 1996-2006.
- G. Iaccarino, “Prediction of a Turbulent Seperated Flow Using Commercial CFD Codes,” Journal of Fluids Engineering, Vol. 123, 2001, pp. 819-828.
- Hydraullics Department, “Tarbela Dam Hydrology Report,” Water and Power Development Authority, 2008.
- S. Yoo, K. Hong and M. Hwang, “A 3-Dimensional Numerical Study of Flow Patterns around a Multipurpose Dam,” Proceedings of the 5th International Conference on Hydroinformatics, Cardiff, 2002.
- J. H. Ferziger and M. Peric “Computational Methods for Fluid Dynamics,” Springer, 3rd Edition, 2001.