Journal of Water Resource and Protection
Vol. 1 No. 5 (2009) , Article ID: 864 , 9 pages DOI:10.4236/jwarp.2009.15040
Effects of Estrogen Contamination on Human Cells: Modeling and Prediction Based on Michaelis-Menten Kinetics1
1Chemical and Materials Engineering University of Alberta, Edmonton, Alberta, Canada
2Department of Laboratory Medicine and Pathology, University of Alberta, Edmonton, Canada
3Department of Oncology, Cross Cancer Institute, Edmonton, Canada
4Alberta Health and Wellness, Edmonton, Alberta, Canada
E-mail: stephan.gabos@gov.ab.ca
Received July 12, 2009; revised August 8, 2009; accepted August 17, 2009
Keywords: Water Protection, Early Warning, Estrogen, Mathematical Modeling, Parameter Estimation, Prediction
ABSTRACT
In this paper, we propose a novel prevention strategy to alert citizens when water is contaminated by estrogen. Epidemiological studies have shown that chronic exposure to high blood level of estrogen is associated with the development of breast cancer. The preventive strategy proposed in this paper is based on the prediction of estrogen effects on human living cells. Based on first principle insights, we develop in this work, a mathematical model for this prediction purpose. Dynamic measurements of cell proliferation response to estrogen stimulation were continuously monitored by a real-time cell electronic sensor (RT-CES) and used in order to estimate the parameters of the model developed.
1. Introduction
Some chemicals, both natural and man-made, can interfere with endocrine glands and their hormones where the hormones act on the target tissues. These chemicals are called endocrine disruptors or endocrine disrupting chemicals (EDCs) [1]. EDCs induce harmful effects that have been observed on reproduction, growth and development in certain species of wildlife and it has been proven that there are increases in some human reproductive disorders and some cancers which could be related to disturbance of the endocrine system. Estrogen and estrogen-like chemicals are a major part of EDCs.
Estrogen is essential for life and its major biological function is modulating a woman’s reproductive process. Estrogen affects the reproductive tract, the urinary tract, the heart and blood vessels, bones, breasts, skin, hair, mucous membranes, pelvic muscles and the brain. Secondary sexual characteristics, such as pubic and armpit hair also begin to grow when estrogen levels rise. Many organ systems including the musculoskeletal and cardiovascular systems and the brain are affected by estrogen [2]. In addition to its positive effects, however, unregulated quantity of estrogen may lead to health disaster due to its capacity to stimulate some tumors to grow. The epidemiological and in vitro studies have shown that chronic exposure to higher blood level of Estrogen is associated with the development of breast cancer [3].
While estrogen is present in both men and women, it is usually present at significantly higher levels in women of reproductive age [4]. Thus, the likelihood of women having a serious excess of estrogen-like substances in the body is much greater than for men. In addition to the natural presence of estrogen in human body, a number of EDCs including estrogen have been detected in environmental sources particularly in drinking water and food. Estrogen may exist accidentally in water due to rejection of detergents and birth control pills in water system and by adding pesticides [5].
The water contamination of EDCs is becoming highly publicized concerns. Therefore, we study in this paper the case where water is the source of estrogen and we develop a prevention strategy related to water protection. The ultimate objective is to develop an early warning system such that citizens are alerted as early as possible when water is contaminated by an excess of estrogen. More precisely, an alarm is triggered when the concentration of estrogen exceeds certain value. This value is determined by studying a predicted human cells response to estrogen stimulation. This prediction is then used by medical experts in order to assess the biological consequences of estrogen in water contamination. In order to achieve this goal, an analytical system must be developed to accurately measure estrogen at very low levels and to identify its biological effects. The system should also provide dynamic information about biological effects that can be used to predict the biological consequences of the contamination in longer period. This analytical system is based on the predicted human cells response using mathematical modeling. The parameters of the proposed model are estimated using dynamic measurements. Theses measurements represent cell proliferation dynamic response to estrogen stimulation and have been accurately measured with a real-time cell electronic sensor (RT-CES) in our recent work. The RT-CES is widely used for many cell-based toxicity and stimulation assay in clinical laboratory and other related applications [7,8].
The prevention strategy proposed in this paper is based on mathematical modeling of cell population dynamic response to estrogen stimulation rather than modeling of contaminant molecules transport in water canalization system as usually done in other water prevention strategies such as in [9].
1.1. The Proposed Prevention Strategy
As mentioned previously, the goal of our proposed prevention strategy is to protect citizens as early as possible when water is contaminated by estrogen. This goal is achieved by building a prediction strategy which gives us early information about the effect of estrogen on human cells in a dynamic fashion. The early information includes the following three prediction features:
1.1.1. Prediction of Cell Response to Estrogen Stimulation of Different Doses
The dynamic cell response to estrogen stimulation shows different patterns when changing the estrogen concentration. The prediction of cell response to different estrogen doses stimulation helps the medical experts to decide whether the concentration level of estrogen exceeds the allowed limit. For this prediction purpose, we develop a mathematical model for describing the estrogen effect on human cell. To obtain a dynamic model, one usually needs to determine the model structure using fundamental principles and then estimate the model parameters. The parameter estimation procedure is evolved using the least squares approach which looks for parameters that minimize the integral of the squared prediction error. The prediction error is the difference between the mathematical model output and the dynamic measurements which may be provided by a suitable sensor such as the Real-Time Cell Electronic Sensor (RT-CES).
1.1.2. Fast Determination of Estrogen Concentration
Using modeling strategy, we provide the possibility of determining the concentration of estrogen using only small part of cell response measurements. This allows medical experts to determine an estrogen concentration without waiting for collecting all possible measurements responses. This feature helps in the case where an early determination of the concentration is needed.
1.1.3. Future Prediction of Cell Dynamic Response to Different Estrogen Doses Stimulation
This feature helps medical experts to decide early whether an alert needs to be triggered using only short time measurements. Using only initial data, a local (intermediate) model is identified on-line to predict future evolution of cell response under different estrogen doses stimulation. We refer to this model as local (intermediate) because it is identified from specific initial dynamic response and used to predict its future evolution.
The model developed for the first prediction feature is considered as a universal or global one because it is identified off-line from complete time-history data and validated for predicting cell proliferation response to different estrogen concentrations as well as being used in the second prediction feature for rapid determination of estrogen concentration. The model determined from the third feature is considered as a local model.
Due to the fact that our prevention strategy is based on mathematical modeling framework, it is necessary to discover the related existing modeling strategies. We look for methods to describe estrogen effects on cells population dynamics. Unregulated exposure of cells to estrogen may lead to uncontrolled cells proliferation which is strongly related to cancer development. The description of estrogen effects on cells population dynamics belongs to tumor growth description area. Mathematical modeling of uncontrolled cells proliferation (tumor growth) has a long history [10]. One of the main objectives of such modeling is to find a way to optimize the antitumor therapy. At least three different phenomenological models have been proposed in the literature namely: the Logistic model, the Bertalanffy model and the Gompertz model [11]. The synthesis of these models is purely mathematical so that no biological insights are considered and there were several proposals to provide a biological rationale for these functions, as in [12] for instance, where the theory of cellular energy is used. In addition to the mathematical models mentioned above, the so-called two compartments cell dynamic model is proposed for tumor growth [13]. This model is based on knowledge about the cell cycle [14].
While our proposed prevention strategy is based on prediction of the effects of estrogen concentrations on cell proliferation response, we need a mathematical model which includes a term that reflects estrogen concentration. None of the models proposed above has considered it. To the best of our knowledge, there exist no mathematical models in the literature that have this characteristic. As a result, we develop in this paper a mathematical modeling strategy that is able to reflect the effect of the concentration on cell proliferation response. This modeling strategy is based on some biological insights about the estrogen effects on the human cells as shown in Section 3.
The organization of this paper is as follows. The experiments procedure and the developed mathematical modeling approaches are presented in Section 2 and Section 3 respectively. Section 4 shows simulation results including model prediction validations. Discussion and concluding remarks are given in Section 5 and Section 6 respectively.
2. Material and Method
2.1. Experiment Setup
Equipments: The RT-CES system (ACEA Biosciences, CA, U.S.A.) used for this study is set up in Alberta Laboratory for Environment and Cancer Risk Assessment (ALECRA) and was described previously in [7]. Briefly, it consists of a 16x microelectronic sensor devices having 16 plastic wells in microtiter plate format, a device station and an electronic sensor analyzer. Cells are grown onto the surfaces of microelectronic sensors. In operation, the sensor devices with cultured cells are mounted to a device station placed inside a CO2 incubator. Electrical cables connect the device station to the sensor analyzer. Under the control of RT-CES software, the sensor analyzer automatically selects wells to be measured and continuously conducts measurements on wells. The electronic impedance can then be transferred to a computer and recorded. A schematic diagram of the instrument (RT-CES) is shown in Figure 1.
A parameter termed cell index  is derived to represent cell status based on the measured electrical impedance. The frequency dependent electrode impedance (resistance) without or with cells present in the
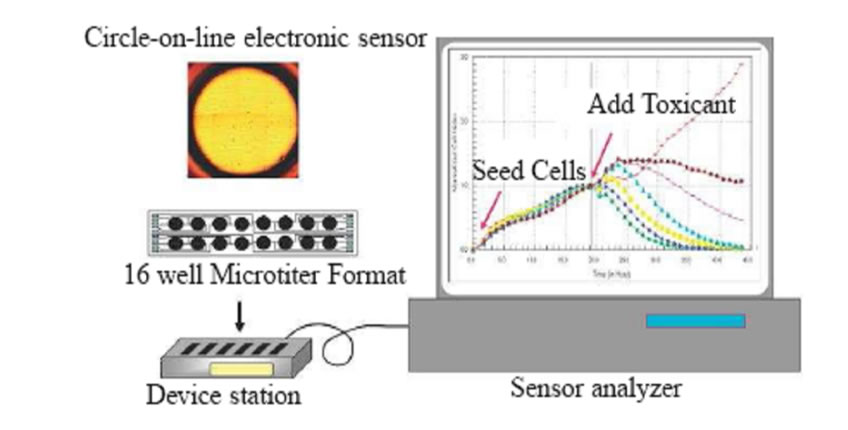
Figure 1. The real-time cell electronic sensor (RT-CES).
wells is represented as  and
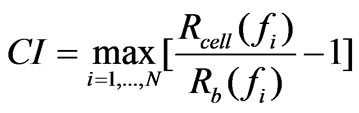
and , respectively. The CI is calculated by:
 (1)
(1)
where N is the number of the frequency points at which the impedance is measured. Several features of the CI can be derived: 1) Under the same physiological conditions, if more cells attach onto the electrodes, the impedance value becomes higher, leading to a larger CI. If no cells are present on the electrodes or if the cells are not well-attached onto the electrodes, Rcell(ƒ) is the same as Rb(ƒ), leading to CI=0; Thus, CI is a quantitative measure of the number of cells attached to the sensors; 2) For the same number of cells attached to the sensors, changes in cell status, such as morphological change, may also lead to a change in .
.
In addition to cell numbers, the impedance also depends on the extent to which cells attach to the electrodes. For example, if cells spread, there will be a greater cell/electrode contact area, resulting in larger impedance. Thus, the cell biological status including cell viability, cell number, cell morphology and cell adhesion may all affect the measurements of electrode impedance that is reflected by  on the RT-CES system. Therefore, a dynamic pattern of a given CI curve can indicate sophisticated physiological and pathological responses of the living cells to a given toxic compound [7].
Chemicals and Cell Cultures: Human glioma GH3 cell line (ATCC, USA) was maintained in F-12 Kaighhn’s (F12K) media containing 10  FCS, 100
  penicillin and 100 units
 streptomycin. The cells were culture at 37
  and 5
and 5  CO2. BetaEstrogen 17 acetate was purchased from Sigma-Aldrich Inc. (St Louis, USA).
2.2. Experiment Method and Dynamic Growth with Estrogen Stimulation
GH3 was plated onto 16x sensor device at density of  well in triplicate in F12K with 10 % FBS and cultured for 24 hours. Then the culture media was replaced with F12K without FBS. After 24 (hrs), two
  estrogen solutions with different concentrations were added into cell culture. The concentrations of estrogen at culture media were at range of 0.005 (nM) -1 (nM).
Figure 2 shows that the dynamic cell proliferation response to estrogen stimulation is dose dependant and increasing dose leads to increasing cell index ( ).
).
3. Model Development
As we mentioned in the introduction, the prevention strategy we develop is based on the predicted human
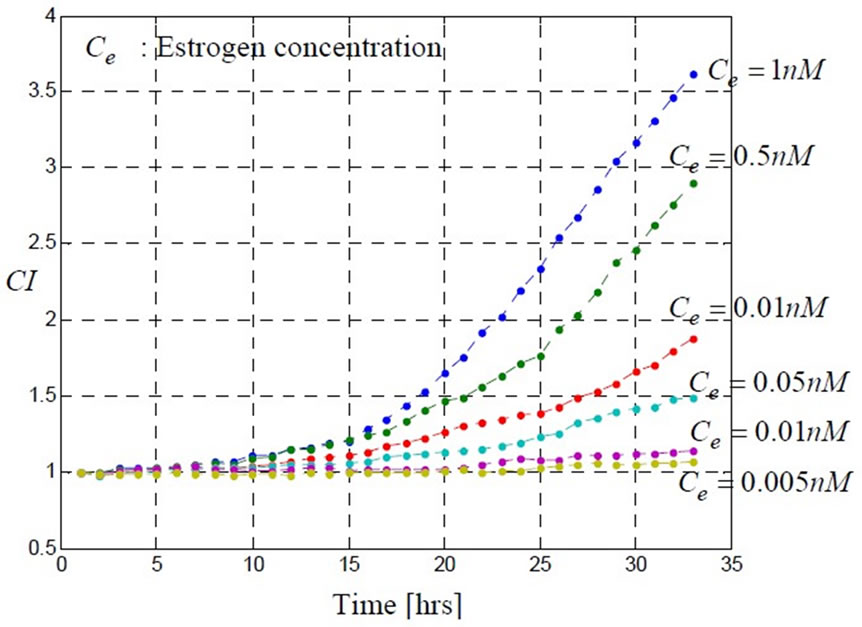
Figure 2. Dynamic proliferation response of GH3 cells to different doses of estrogen: 0.005; 0.01; 0.05; 0.1; 0.5; 1 [ ]. These data are measured by the real-time cell electronic sensor (RT-CES).
cells response to estrogen stimulation. A mathematical model which is able to predict this response is then needed. In order to build this mathematical model, we explore in the next section some biological insights which describe the estrogen transport mechanism from outside to inside the cell and which quantify the estrogen stimulative effects on cells. With biological insights, following the approach of [6] the model structures can then be determined. Experiment data from RT-CES such as the ones shown in Figure 2 can be used to fit the model parameters.
3.1. Estrogen Transport and Stimulative Effects
Estrogen circulates in the bloodstream and enters target cells by a non-energy-dependant process and the cell membrane provides a favourable lipid-rich environment for passage of estrogen by passive diffusion [15]. When estrogen enters a cell, it binds to high-affinity intracellular receptors (Figure 3). An estrogen receptor is a protein molecule found inside those cells that are targets for estrogen action. Estrogen receptors contain a specific site to which only estrogens (or closely related molecules) can bind [15]. The target tissues affected by estrogen molecules all contain estrogen receptors; other organs and tissues in the body do not. Therefore, when estrogen molecules circulate in the bloodstream and move throughout the body, they exert stimulative effects (cell proliferation) only on cells that contain estrogen receptors. From this introduction, we can hypothesize that a mathematical modeling strategy which reflects the effect of the estrogen concentration on cell proliferation response may consider two mechanisms, namely, the mechanism of estrogen transport into cell and the stimulative mechanism of estrogen inside the cell. Mathematical modeling of both mechanisms is presented next.
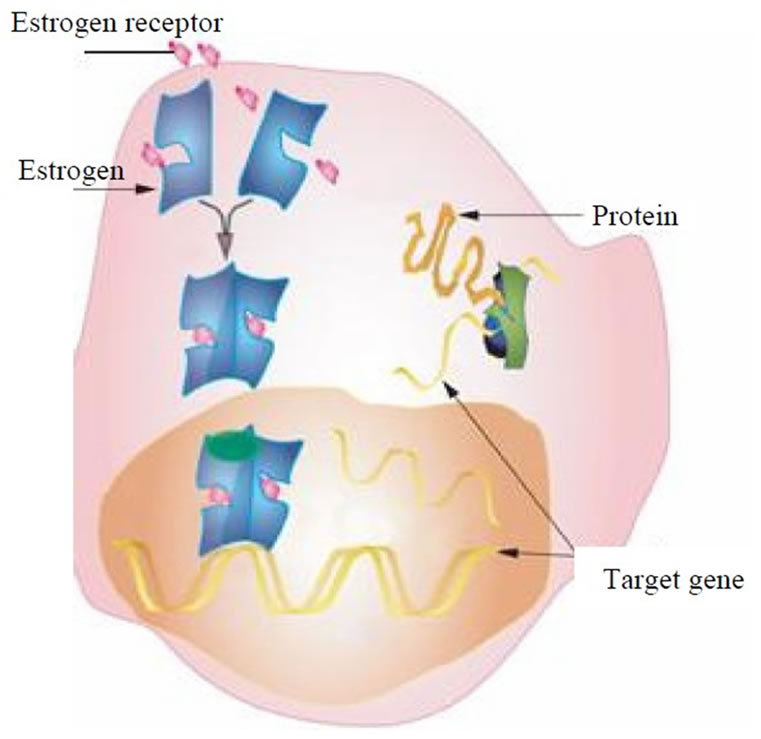
Figure 3. A schematic [16] of an estrogen target cell (breast, uterine, liver, etc).
3.1.1. Mathematical Modeling for Estrogen Transport Mechanism
The cell membrane functions as a semi-permeable barrier, allowing some molecules to cross it while fencing others outside the cell. This means that estrogen concentration outside the cell (refereed to as extracellular concentration ce) is not at immediate equilibrium with estrogen concentration inside the cell (refereed to as intracellular concentration ci) and a passive diffusion process takes place [15].
On the other hand, in a related area of pharmacokinetics and pharmacodynamics where the effect of drug is of main interest, it was accepted that passive diffusion transport of a toxicant (Doxorubicin) is described by relating the extracellular and the intracellular concentration by the following pharmacokinetic model [17]:
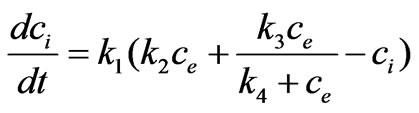 (2)
(2)
In this equation, the dynamics of the intracellular concentration are a combination of a linear diffusive component and a saturable, carrier-mediated component (Michaelis-Menten like kinetics). The parameters k1, k2, k3, k4, are positive and constant. Due to the fact that estrogen enters cell by passive diffusion, we can assume that estrogen transport mechanism into the cell may be described by Equation (2).
3.1.2. Mathematical Modeling for Estrogen Stimulative Effects
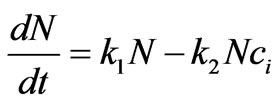
As mentioned previously, when estrogen enters a cell, it binds to intracellular receptors and then starts exerting stimulative effects leading to cell proliferation. By observing the related experiment shown in Figure 2, we can conclude that the proliferation rate is proportional to estrogen concentration. In addition, due to the presence of the receptors inside the cell, the intracellular concentration ci stimulates cell proliferation rather than the extracellular concentration. Mathematically, the proportionality of the cell proliferation rate to the intracellular concentration of estrogen can be expressed as follows:
 (3)
(3)
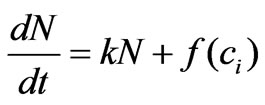
This equation is inspired from cell population dynamics under toxicity effect given by [18]:
 (4)
(4)
where N is cell population, kN is proliferation rate and  is cell killing rate which we replace by the function
  in the Equation (3). The function
  represents a term which reflects the effect of intracellular estrogen concentration on cell proliferation rate.
3.1.3. Mathematical Modeling for Cell Proliferation Dynamic under Estrogen Stimulation
As mentioned above, we aim to develop a prevention strategy when water is contaminated by estrogen. This prevention straggly is based on predicted cell proliferation response to estrogen stimulation. A mathematical model which reflects the extracellular concentration of estrogen in water and relates it to cell population dynamics is needed. Putting together the transport equation (Equation (2)) and the cell population dynamic equation (Equation (3)), we obtain the desired model:

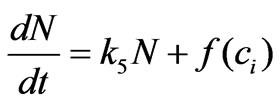 (5)
(5)
The remaining step is to know in which manner the intracellular concentration affects the proliferation rate, i.e. how to choose the function ? We may consider that this function is an unknown non-linear function. As a second order approximation, it is found the following structure is appropriate:
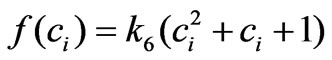
where the parameter k6 must be constant and set to be positive in order to ensure the proportionality between cell proliferation dynamics and the intracellular concentration as observed from the related experiments (Figure 2). This approximation is chosen after several structure search steps based on experiment data and we concluded that using this approximation provides better results than using other general functions such as 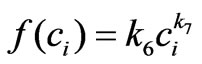 or
or 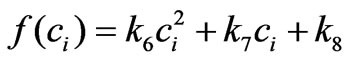 for instance. The criterion of the structure search is based on the confidence intervals of the parameters determined from the experiment data. Simulation results will demonstrate the success of this choice. The calculation of the confidence intervals of the model parameters is necessary in order to have an idea on the quality of the estimation. The derivation of the confidence interval is presented in the next section.
3.1.4. The Confidence Interval
In order to have a measure of the overall quality of the estimation and the uncertainty associated with a specific estimate, one needs to calculate the confidence intervals of the estimated parameters. A confidence interval is a region around an estimated value, and the true value of the parameters will be in this region with a confidence or probability of  (
( is the significance level).
Consider the model (5). Let a state vector be expressed as  and let the parameters vector be expressed as
 . The model (5) may be written in a compact form as:
 (6)
(6)
with the observation equation :
 (7)
(7)
The confidence interval for a parameter kj is given by:
 is the parameter index and
  is the critical value which equal to 1.960 for a 95% confidence interval [19].
The variance matrix C and the standard error  are given by:
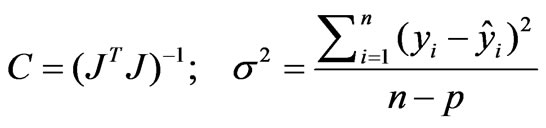
where  is the number of data points and
  is the number of the parameters.
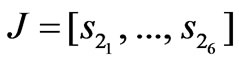
 is the sensitivity matrix which is given by :
 (8)
(8)
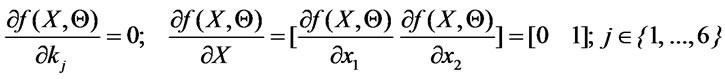
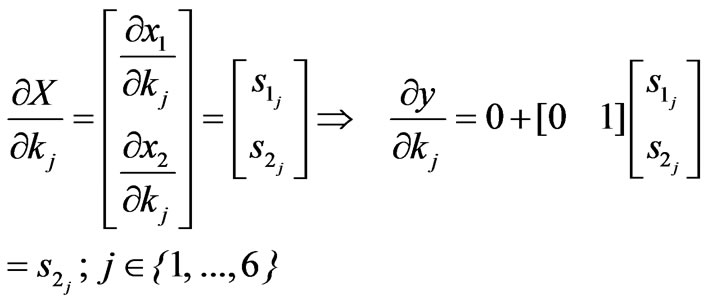
The term  represents the sensitivities of the state to the parameter kj. The sensitivity matrix can be expressed by:
 (9)
(9)
On the other hand,
 (10)
(10)
 (11)
(11)
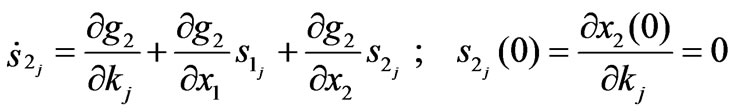
In order to calculate the sensitivities s2 j, which is necessary for calculation of the sensitivity matrix J, we solve the system equations (Equation (5)) together with the sensitivity equations (Equation (10)) and (Equation (11)).
4. Results
The results presented in this section demonstrate the ability of our proposed prevention strategy to meet the features mentioned in the introduction. For this purpose, we need to estimate the parameters of the proposed model (Equation (5)) from the experiments data provided by the RT-CES. These measurements represent cell population dynamics in response to different input concentrations of estrogen as shown in Figure 2. In our model identification procedure, part of these data is used for estimating the model parameters (for fitting) and the other part is compared to the predicted output of the proposed model for validation. The choice and the number of the data points used in the estimation procedure is done according to the requested biomedical scenario as mentioned in the introduction.
4.1. Prediction of Cell Response to Estrogen Stimulation of Different Doses
As we mentioned previously, the first feature of our proposed preventive strategy is the ability to predict cell response to different estrogen concentrations. The objective of this scenario is to validate the model developed as shown in Equation (5). This validation is also a demonstration of the first feature for the preventive strategy.
We use three sets of data shown in Figure 2 which correspond to [1 0.1 0.01] ( ) estrogen concentration for estimating the model parameters. Using three sets of measurements is equivalent to using 99 data points. The remaining three sets of data corresponding to [0.5 0.05 0.005] (
 ) estrogen concentration are used to validate the model. The parameter estimation procedure results in the parameters values and their confidence intervals which are presented in Table 1.
It was noticed during the parameter estimation procedure that the optimizer sets the parameter k5 to zero. This adds to our biological insights about the process that the
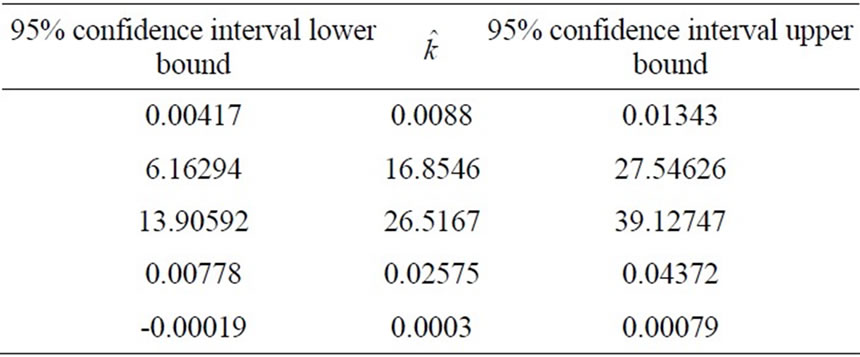
Table 1. The model estimated parameters.
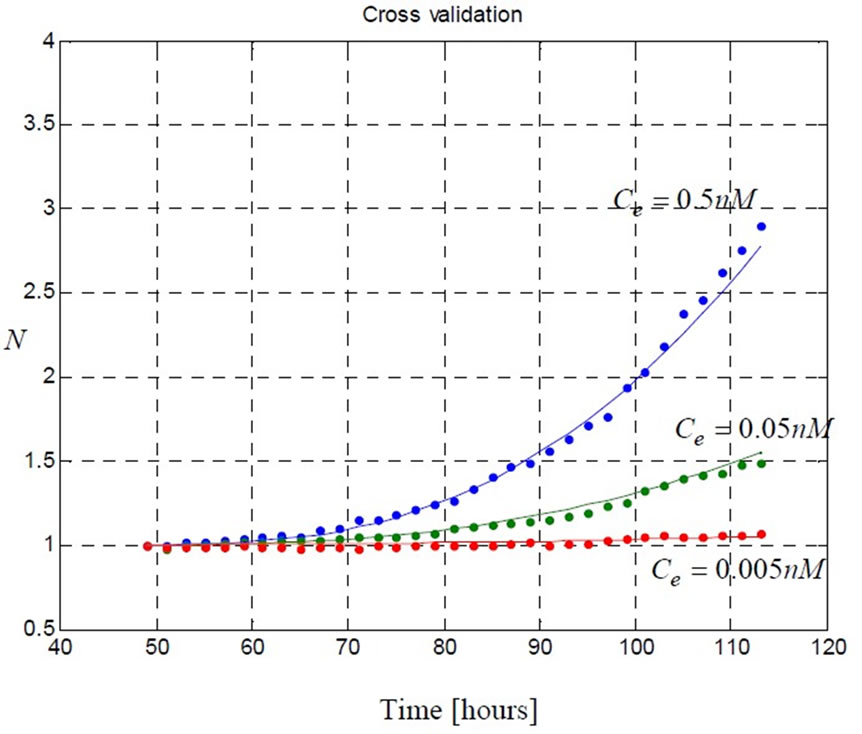
Figure 4. The model (5) with the estimated parameters (Table 1) predicts three sets of data corresponding to [0.5 0.05 0.005] ( ) estrogen concentrations. These data were not used in parameter estimation procedure. This demonstrates the ability of the model to predict cell proliferation response when concentration varies.
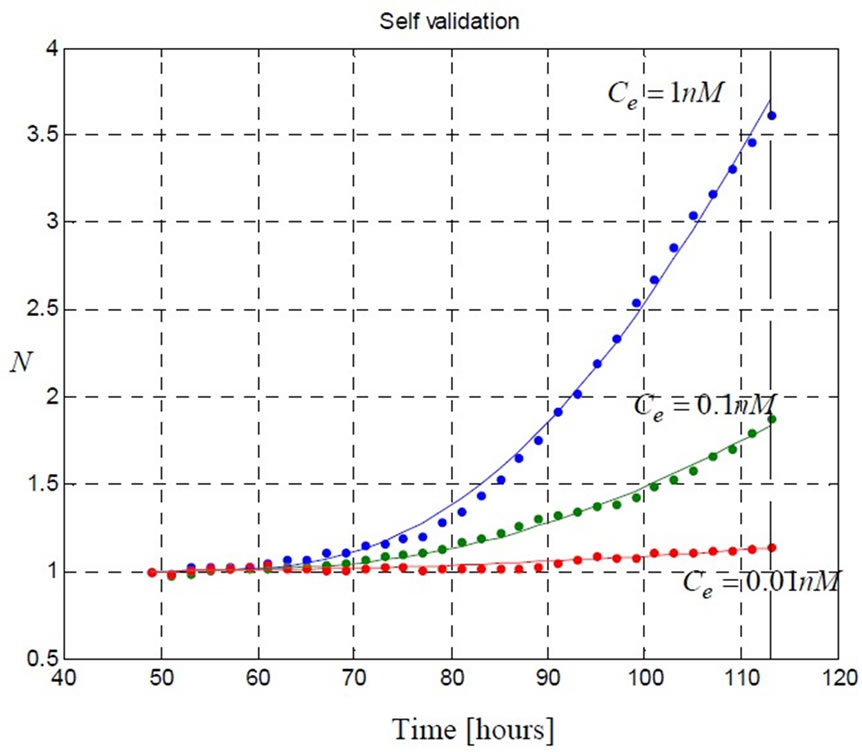
Figure 5. The model (5) fits the three sets of data corresponding to [1 0.1 0.01] ( ) estrogen concentration. These data are provided by the real-time cell electronic sensor RT-CES and used to estimate the model parameters presented in Table 1.
cell proliferation rate depends only on the intracellular concentration and not on the population variable N itself. This leads us to consider that the estrogen stimulation effect should be represented by the following model instead:

 (12)
(12)
The prediction performance of the proposed model using the estimated parameters in Table 1 is presented in Figure 4 and Figure 5. In Figure 5 the proposed model fits the data which is used in parameter estimation phase. In Figure 4 the model predicts the remaining data which does not participate in model fitting. These validations demonstrate the ability of the model to predict cell proliferation response when concentration varies.
4.2. Rapid Determination of Estrogen Concentration
In this scenario, we use the model (5) with the estimated parameters presented in Table 1 to estimate estrogen concentration from short term measurements. The concentration is treated as an unknown parameter for the model and is estimated from a short period of response. Examples of these concentrations correspond to 0.5 ( ) and 0.005 (
 ).
).
As shown in Figure 6, the proposed model is able to provide an estimation of the concentration that equals to 0.512, which is close to the real value 0.5 ( ), within 88 hours. Figure 7 shows that the model is also able to provide an estimation of the concentration that equals to 0.047 (
 ) within 84 hours, which is close to the real value 0.05 (
 ). This scenario provides the second feature of our preventive strategy which helps in the case where an early determination of the concentration is needed.
4.3. Future Prediction of Cell Response to Different Estrogen Doses Stimulation
In this scenario, we identify a set of parameters for the model (5) using short time measurements. The objective is to predict the future evolutions of cell responses based on the initial response. The purpose of this scenario is to provide the third feature of the proposed prevention strategy which helps medical experts to decide early whether an alert needs to be triggered using only short time measurements. We refer to this model as local or intermediate model and it is identified on-line after collecting some initial response data and then the model is used to predict the future evolution. This model is only
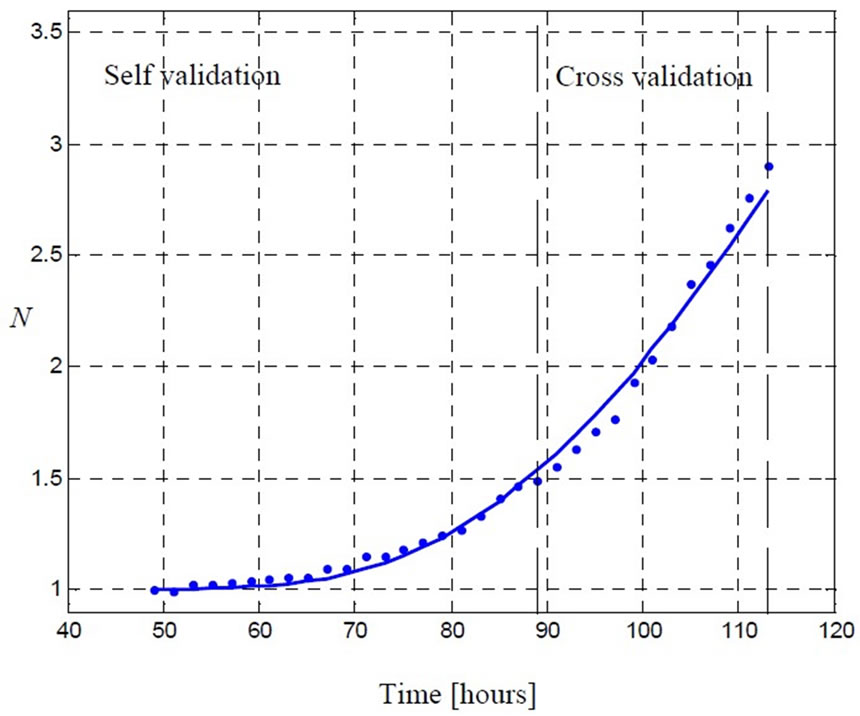
Figure 6. The model (5) is able to provide a close estimation of the concentration using short time data (up to 88 [hr]). The real concentration value equals to 0.5 ( ) and the estimated value equals to 0.512 (
 ).
).
Figure 7. The model (5) is able to provide a close estimation of the concentration using short time data (up to 84 [hr]). The real concentration value equals to 0.05 ( ) and the estimated value equals to 0.047 (
 ).
).
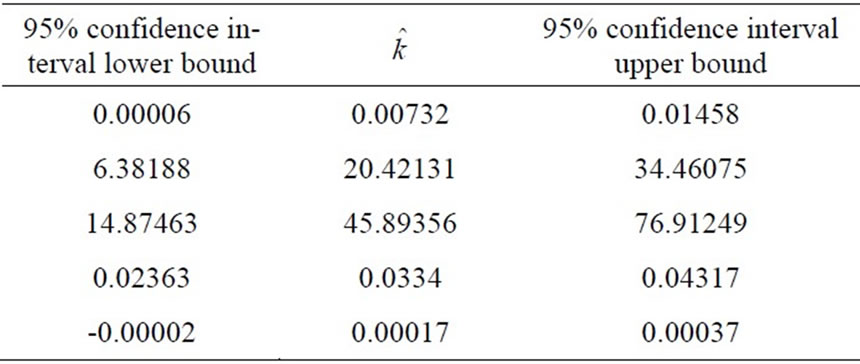
Table 2. The model estimated parameters.
for prediction purpose and the values of the estimated parameters vary with different length of data used, also
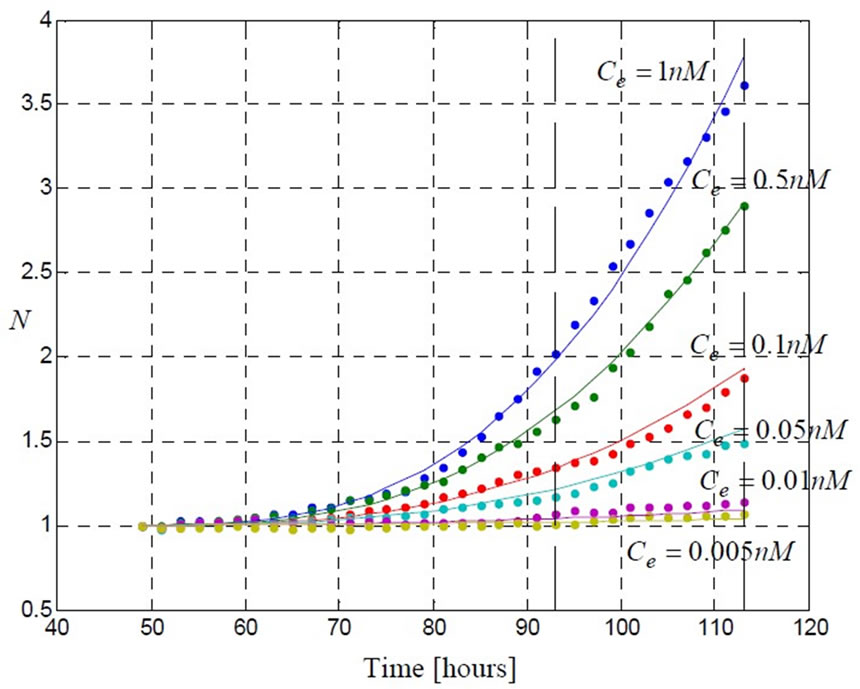
Figure 8. Using only a part of history data (up to 92 [hr]); a set of parameters is estimation (Table 2). Using this set of parameters, the model (5) is able to predict the future evolution.
known as adaptive estimation. As an example, using short time data (up to 92 [hr], which is equivalent to 138 data points) in parameter estimation procedure, we obtain the parameters values and their confidence intervals shown in Table 2.
Figure 8 shows that, using the set of estimated parameters presented in Table (2) for the model (5), the model is able to predict the future evolution of the data starting from 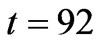 (hrs).
5. Discussions
The strategy presented in this paper has three main features which represent real scenarios in an early warning context. We have successfully achieved the objective through mathematical modeling and prediction based on data obtained from RT-CES experiments.
The heart of our prevention strategy is the mathematical modeling and prediction. Therefore the success of this strategy depends on the quality of the used model. The model we developed (Equation (5)) is able to provide a good cross validation with several choices of . However only the structure
  provides a reasonable confidence interval as shown in Tables [1,2]. Therefore in Section 3 we pointed out that this approximation is chosen after several structure search steps and the criterion for this structure search is based on the confidence intervals of the parameters determined from the experimental data. All other terms of the model are derived directly from fundamental biological insights. More understanding of the cell stimulation mechanism by estrogen doses will lead to a more precise expression of
 . However, in absence of such deep knowledge so far, data-based structure search is the best choice.
6. Conclusions
The main contribution of this work is the development of a prevention strategy composed of three prediction features for water protection area. This strategy is based on mathematical models. Theses models are able to describe estrogen effects on human cell dynamic response and they are cross validated using data which is not used in the model identification phase. The calculated confidence intervals of the parameters for the developed models show a good estimation quality.
The ultimate objective of our prevention strategy is to protect citizens as early as possible when water is contaminated by estrogen. This strategy is composed of three prediction features, namely, prediction of cell response to different stimulations of estrogen concentration, early determination of estrogen concentration and prediction of future evolution of cell response using short time measurements.
It is important to mention that the proposed strategy is not limited to the case when water is contaminated by estrogen. The same methodology may be adopted when water is contaminated with other toxins. The work presented here is our first step toward building a high performance early warning system for water protection.
7. Acknowledgment
The authors gratefully acknowledge the support of the Natural Sciences and Engineering Research Council of Canada (NSERC), Alberta Health (Water for Life Project) and Alberta Laboratory for Environment and Cancer Risk Assessment (ALECRA).
REFERENCES
- J. S. Patrick, J. A. Franklin, and J. J. C. James, “The environmental science of drinking water,” ISBN-13: 978−0 −7506−7876−6, 2005.
- K. N. Rajesh, “Endocrine disruptors: Effects on male and female reproductive systems,” CRC Press, 1st Edition ISBN-10: 0849331641, 1999.
- P. Lemieux and S. Fuqua, “The role of the estrogen receptor in tumor progression,” The Journal of Steroid Biochemistry and Molecular Biology, Vol. 56, No. 87−91, 1996.
- R. A. Hess and K. Carnes, “The role of estrogen in testis and the male reproductive tract: A review and species comparison,” Animal Reproduction, Vol. 1, pp. 5−30. 2004.
- M. L. Johnson, A. Salveson, L. Holmes, M. S. Denison, and D. M. Fry, “Environmental estrogens in agricultural drain water from the central valley of California,” Journal Bulletin of Environmental Contamination and Toxicology, Vol. 60, pp. 609−614, 1998.
- B. Huang and J. Z. Xing, “Dynamic modeling and prediction of cytotoxicity on microelectronic cell sensor array,” Canadian Journal of Chemical Engineering, Vol. 86, pp. 393−405, 2006.
- J. Z. Xing, L. Zhu, J. A. Jackson, S.Gabos, X. J. Sun, X. B. Wang, and X. Xu, “Dynamic monitoring of cytotoxicity on microelectronic sensors,” Chemical Research in Toxicology, Vol. 18, pp. 154−161, 2005.
- J. Z. Xing, L. Zhu, S. Gabos, and L. Xie, “Microelectronic cell sensor assay for detection of cytotoxicity and prediction of acute toxicity,” Toxicology in Vitro, Vol. 20, pp. 995−1004, 2006.
- T. M. Brosnan, “Early warning monitoring to detect hazardous events in water supplies,” In An ILSI Risk Science Institute Workshop Report, 1999.
- R. P. Araujo and D. L. S. McElwain, “A history of the study of solid tumour growth: The contribution of mathematical modeling,” Bulletin of Mathematical Biology, Vol. 66, pp. 1039−1091, 2004.
- F. Kozusko and M. Bourdeau, “A unified model of sigmoid tumour growth based on cell proliferation and quiescence,” Cell Proliferation, Vol. 40, pp. 824−834, 2007.
- P. Castorina and D. Zappala, “Tumor gompertzian growth by cellular energetic balance,” Physica A, Vol. 365, pp. 473−480, 2006.
- J. C. Panetta, “A mathematical model of breast and ovarian cancer treated with paclitaxel,” Mathematical Bioscience, Vol. 146, pp. 89−113, 1997.
- M. Eisen, “Mathematical models in cell biology and cancer chemotherapy,” Springer 30, New York, 1979.
- P. F. Lebowitz and S. M. Swain, “Cancer chemotherapy and biotherapy: Principles and practice,” Fourth Edition, Hormonal Therapy for Brest Cancer, Lippincott Williams and Wilkins, New York, pp. 809−838, 2006.
- “Lawrence livermore national laboratory exploring the link between diet and cancer,” https:// www.llnl.gov/ str/ December05/ Kulp.html.
- A. W. El-Kareh and T. W. Secomby, “Two-mechanism Peak concentration model for cellular pharmacodynamics of doxorubicin,” Neoplasia, Vol. 7, pp. 705−713, 2005.
- R. E. Eliaz, S. Nir, C. Marty, and F. C. Szoka, “Determination and modeling of kinetics of cancer cell killing by doxorubicin and doxorubicin encapsulated in targeted liposomes,” Cancer Research, Vol. 64, pp. 711−718, 2004.
- K. D. Bird, “Analysis of variance via confidence interval,” ISBN 0 76196357, SAGE Publication, 2004.
NOTES
1 The short version of this paper was presented in EPPH2009.