Journal of Software Engineering and Applications
Vol. 5 No. 11A (2012) , Article ID: 25176 , 11 pages DOI:10.4236/jsea.2012.531106
Performance Analysis and Improvement of Storage Virtualization in an OS-Online System
![]()
Department of Computer Science and Technology, Tsinghua University, Beijing, China.
Email: y-g06@mails.tsinghua.edu.cn
Received October 15th, 2012; revised November 16th, 2012; accepted November 25th, 2012
Keywords: Storage Virtualization; Performance Analysis; Cache Strategy
ABSTRACT
An OS-online system called TransCom is based on a virtual storage system that supports heterogeneous services of the operating system and applications online. In TransCom, OS and software which run in the client are stored on the centralized servers, while computing tasks are carried out by the clients, so the server is the bottleneck of the system performance. This paper firstly analyzes the characteristics of its real usage workload and builds a queuing model to locate the system bottlenecks. According to the study, the disk is the primary bottleneck, so an optimal two-level cache arrangement policy is developed on both the server and the client, which aims to avoid most of the server disk accesses. LRU algorithm is used in the client-side cache. A cache management algorithm called Frequency-based Multi-Priority Queues (FMPQ) proposed in this paper is used in the server-side cache. Experiment results show that the appropriate cache arrangement can significantly improve the capability of the TransCom server.
1. Introduction
During the last decade, with the rapid advance in the embedded and mobile devices, the traditional general-purpose desktop computing is shifting toward the greatly heterogeneous and scalable cloud computing [1,2], which aims to offer novel pervasive services for users in right place, at right time and by right means with some kinds/ levels of smart or intelligent behaviours. From the scalable service perspective, these pervasive services are highly expected, that a smart ubiquitous computing platform should enable users to get different services via a single light-weight device and a same service via different types of devices. Unfortunately, all of the current technologies cannot achieve the uneven conditioning services. In another word, users are often unable to select their desired service freely via the devices or platforms available to them. A new computing paradigm is proposed, namely, transparent computing [3,4], which aims to solve the problems above. The core idea of this paradigm is to realize the “stored program concept [5]” model in the networking environment, in which the execution and the storage of programs are separated in the different computers. All the OSes, applications, and data of clients are centered on the servers and are scheduled on demand and run on different clients in a “block-streaming” way. All the OS-, application-, and data-streaming can be intercepted, monitored, or audited independent of the clients. Due to the central storage of OSes and applications, the installation, maintenance, and managment are also centralized, leaving the clients light-weighted. A typical transparent computing system is illustrated in Figure 1.
We implemented a prototype of transparent computing, namely, TransCom [6], which is a distributed system based on C/S model. In TransCom, a client is nearly a bare hardware, which is responsible for the execution of programs and the interaction with users. Most programs including OSes and applications executed on the clients are centralized on the server, which is responsible for the storage and the management. In order to fetch the remote programs and data transparently, the virtual disk system (Vdisk) in TransCom extends the local external memory to the disks and the memory on the server.
Unlike the traditional distributed storage systems, Vdisk in TransCom is designed for the remote programs access rather than only the remote data access, which brings Vdisk some unique features as follows. Firstly, Vdisk supports for the remote program loading and paging. Secondly, all the virtual disks are transparent to the native file systems and applications. Thirdly, one program segment can be shared among different clients. At last, each client has a separate disk view.
Since Vdisk is designed for the special purpose, its behaviour is not the same as the traditional distributed
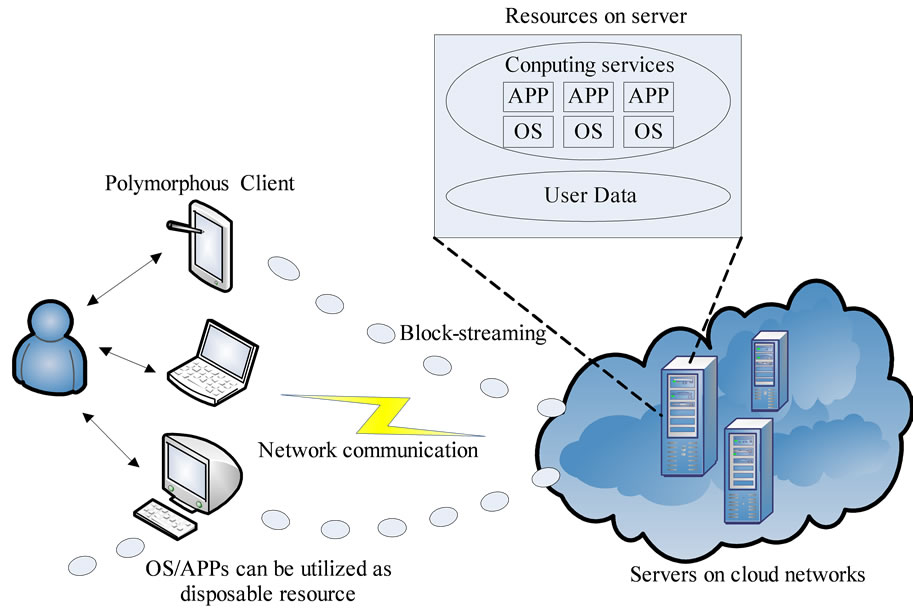
Figure 1. The computing environment of Transparent Computing.
storage systems. Understanding the workload characteristics of Vdisk is a necessary prelude to improve the performance of TransCom. In this paper, a trace-driven analysis method is used to observe I/O characteristics of Vdisk, and the effect of cache on both the server and the client side is discussed. Also an analytical model is built to evaluate the effect of several optimizations on a cache system.
The remaining sections are organized as follows. The overall architecture of the TransCom system is shown in Section 2. In Section 3, we build a queuing network mo- del to analyse the utilization of resources on the server. In Section 4, we identify the bottleneck on TransCom server and discuss the factors affect the cache hit ratio and the overall performance by simulation. In Section 5, we propose a two-level cache strategy optimization method and provide the experimental results in Section 6. The conclusions and future works are discussed in Section 7.
2. System Overview
TransCom system is based on C/S model, where a single server can support up to tens of clients connected in a network system. Figure 2 shows the overall architecture of a TransCom system with a server and a single client. Without the local hard disk, each client accesses the OS, software and data from the remote virtual disks which simulate the physical block-level storage devices. Vdisk, in essence, is one or more disk image files located on the server and accessed by the client remotely via Network Service Access Protocol (NSAP) [7]. TransCom server, running as an application daemon, maintains a client management process, a disk management process, and all Vdisk image files belonging to all clients in the system.
As seen from its structure in Figure 2, the Vdisk driver is composed of two parts running on the Trans-Com client and TransCom server, respectively. OS-Specific Driver (OSD) is mainly used to provide the interaction interface with a specific Client OS, so that Client OS may perform various operations on the virtual devices as usual. Independent Driver (ID) which runs in TransOS is used to fulfill the Vdisk functions that are irrelevant with a specific Client OS. The interface between OSD and ID is an ordinary hardware-level interface based on the I/O controller and register. Service Initiator is used to locate the TransCom server for ID and to transport the requests for Vdisk operations to relevant handling programs on the TransCom server via NSAP. Waiting for the response from the server, Service Initiator then passes the handling results to ID for further handling. Service Target is used to receive I/O requests from the TransCom client, search relevant database, check the access authority, perform operations to the corresponding Vdisk image files and physical devices, and finally return the results to the TransCom client. NSAP communication protocol is the communication protocol to locate the TransCom server, verify relevant authorization, and transport requests and responses for various I/O operations.
As mentioned above, the Virtual I/O (VIO) path needs to go through the TransCom delivery network (a roundtrip transportation) and the physical I/O operations of the TransCom server. Therefore, a complete VIO operation will take more time than commonly known I/O operations. More often than not, this makes the VIO the bottleneck of system performance. In order to enhance the
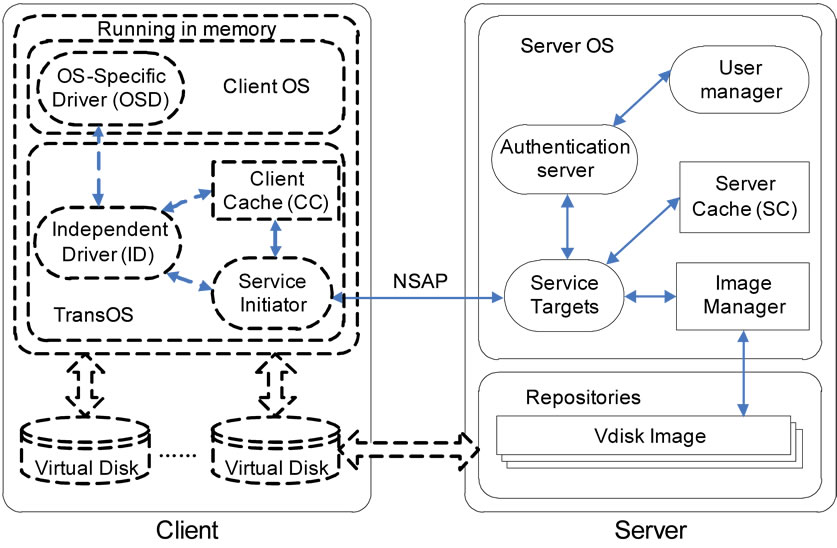
Figure 2. Overall architecture of a TransCom system with a server and a single client.
access performance to VIO in the TransCom system, it is necessary to add cache modules along the VIO path through “add-in” mechanism, so as to further improve the read or write performance.
The client cache is used to cache the requests or responses data from the Client OS and remote TransCom servers, and to reduce the I/O response time. The server cache is added based on Service Targets on the TransCom server. After the caching modules are added, in handling VIO requests sent from the TransCom client, the Service Targets will first search the cache for the I/O data requested by the user using the server cache. If the VIO data requested by the user is in the cache, it will directly return the I/O data to the TransCom client. Otherwise, the Service Target will directly operate on the Vdisk image file and its corresponding physical device, acquiring the VIO data requested by the users, updating the content in the cache buffer with the server cache, and then sending the result to the sending queue. The server cache also will determine whether it is needed to pre-read some VIO data into the cache buffer, according to the specific VIO request sent by the user. If it is needed, it will invoke the Service Target to operate directly on the Vdisk image file and its corresponding physical device, so as to read the VIO data beforehand.
Two features distinguish TransCom from previous diskless distributed systems [8-10]. Firstly, TransCom can boot and run heterogeneous OSes and applications, so the Vdisk driver is transparent to both OSes and applications. Secondly, Vdisks perceived by users can be flexibly mapped to the Vdisk image files on the TransCom server. Such flexibility allows TransCom to share OSes and applications to different clients to reduce the overhead of the storage and the management, while still isolating the personal files for the privacy of users.
We study a real usage case deployed in the network and system group in Tsinghua University. The system is set up as the baseline case. The server is Dell PowerEdge 1900 machine, equipped with an Intel Xeon Quad Core 1.6 GHz CPU, 4 GB Dual DDR2 667 MHz RAM, one 160 GB Hitachi 15,000 rpm SATA hard disk, and a 1 Gbps on-board network card. Each client is configured as Intel Dual Core E6300 1.86 GHz machine, with 512 MB DDR 667 RAM and 100 Mbps on-board network card. All the clients and server are connected by an Ethernet switch with 98,100 Mbps interfaces and two 1Gbps interfaces. All clients run the Windows XP Professional SP3. The server runs Windows 2003 Standard SP2, with the software providing the TransCom services.
In this paper, we study and optimize the above system. In the following sections, we will discuss what the bottleneck of this system is and How to improve the system.
3. Model Analysis
In this section, the most critical resources on the server are identified. The measurement data is analysed to build the queuing network performance models. In this section, we describe our models, the inputs, and the experiments conducted to obtain these inputs.
3.1. Models of TransCom System
Since the input requirements of our models dictate the quantities that must be measured, a description of these models is introduced at the beginning. We chose the queuing network performance models, because the models can achieve an attractive combination of the efficiency and the accuracy. There are three components in the specification of a queue network model: service centre description, customer description, and service demands. The service centre description identifies the resources of the system that will be represented in the model, such as disks, CPUs, communication networks, etc. The customer description indicates the workload intensity and the offered load, such as the average number of the requests in the system, the average rate at which requests arrive, the number of users and the average waiting time. The service demands indicate the average amount of the services which each request requires at each service centre.
Once these inputs have been specified, the model can be evaluated using efficient numerical algorithms to obtain the performance measures, such as utilization, residence time, queue length, and throughput. In essence, the evaluation algorithm calculates the effect of the interference, and queues the results when customers who have certain service demands share the system at particular workload intensity. Once created, the model can be used to project the performance of the system under various modifications. System modifications often have straightforward representations as modifications to the model inputs.
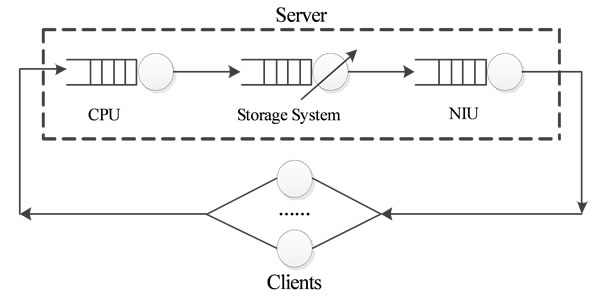
In TransCom system, a number of TransCom clients share a server over a local area network. Figure 3 illustrates the models used in our study. The server is represented by three service centres, corresponding to the CPU, the storage subsystem and the network subsystem. The execution of the requests at the CPU depends on the type of operations requested by the client, which may be either control or access operations. For the storage service, the execution of a request to the server is simpler. A user request for a control operation is translated to one or more access requests to the server by the client. The access and control requests at the server are handled in a similar way to an access request to a file service. The storage system is represented by a flow equivalent server centre, which is composed of a memory cache and some disks. Thus, the efficiency of the storage system depends on the effect of the cache system, which is usually presented by the hit rate. Each client workstation is represented by a delay centre, in which the delay time is a sum of latencies during the network transaction and the network stack processing on each client. The model includes one “token” or “customer” corresponding to each client. Each customer cycles between its client and the server via the network, accumulating the services and encountering the queuing delays which are caused by the competition from other customers.
3.2. Customer Characteristics
The I/O requests issued by the clients in the baseline system were traced in Tsinghua University for 4 weeks.
 (a)
(a)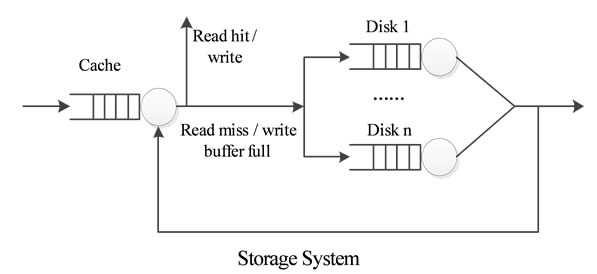 (b)
(b)
Figure 3. Models of TransCom system. (a) Queuing model of TransCom system; (b) Model of storage system in TransCom system.
There are 15 users, a professor and several graduate students, working on each client with Windows XP from 8 am to 6 pm. The applications used most frequently are the internet browser (IE 7.0), the text editor (Microsoft Office 2007) and the text viewer (Adobe acrobat reader 8.0). Besides, New Era English software, a multimedia application for English self-learning, is often used by students.
Wireshark 1.6 is used to set up a network monitor on the server to capture I/O requests related packets and to extract the required information, such as disk id, user id, requested initial block number, block length, operation command and time of packet issued/received. Note that, because of the limitation of the network packet size, TransCom clients need to split a large I/O request to several small ones. Some fields in each split packets are added to record the initial block number and the length of original requests.
The results of our trace analysis are summarized as follows. Note that a request referenced here is an original request before it is split by TransCom system.
1) The minimal request size is 0.5 KB, and the maximal request size is 64 KB. The average request size is 8 KB.
2) Most of the requests are short in length (70% less than or equal to 4 KB), and 4 KB is the most frequent request size (60%).
3) The proportion of the traffic between the read and the write requests is 1:3, while the proportion of the working set (amount of blocks that be accessed at least once) is 4:5.
4) On average, half of the requests are sequential.
According to the above observations, a 4 KB data is defined as a “typical request”. The service demands at the client are composed of the processes in user mode, and the overhead processes for transferring some 4 KB blocks. Since NSAP is a one-step protocol, the service demands of a client should be a constant when the scale of clients increases.
3.3. Measuring Service Demands
The parameters whose values are required for transferring 4 KB data are the service demands, such as the client CPU, the server CPU, disk and NIC, and the network. These service demands are measured in a series of experiments that transfer large numbers of blocks with the 4 KB block size. These experiments are repeated to ensure the reliability.
The CPU service demands at the clients or the server are measured by a performance monitor, which is a background process provided by Windows in all experiments. The server CPU consumption can be further divided into 3 parts: storage related consumption, network related consumption and I/O server consumption. The storage related consumption is the CPU service time spent on dealing with the cache system and controlling disks. Network related consumption is mainly associated with the overhead on UDP/IP network stack. I/O server consumption is used to calculate the requested image files and the position of the file access pointer.
Since it is complicated and expensive to deploy a monitor on the NIU (Network Interface Unit) to measure the service time of the NIU directly, the service time is estimated by the throughput and the network related consumption. Lots of 4 KB UDP packets are transferred continuously via 1Gbps Ethernet NIC in the server, so we measure the throughput and the network stack consumption on the server CPU, by which the service time on the NIU can be calculated. The disk service time of both the random and sequential accesses is measured by IOMeter. In the experiment, we found that the service demands of the CPU in the client and server were not dependent on the access mode. According to the results of our trace study mentioned above, we assume that a seek time is required once per two disk accesses in our model. The typical parameter describing the cache effect is the hit ratio, which is not easy to be measured in a real usage. The hit ratio is one of the factors, which affect the request response time and the utilization of each service centre.
3.4. Modeling Verification
To make the model simple and effective, several assumptions are proposed, some parts of which have already been mentioned in previous sections.
Assumptions of Service Centre are proposed as follows: 1) Service centres in the model are independent from each other; 2) The buffer of each service centre is unlimited, so no request will be dropped.
Assumptions of workload are proposed as follows: 1) the size of the requests is 4 KB; 2) A seek time happens once per two disk accesses.
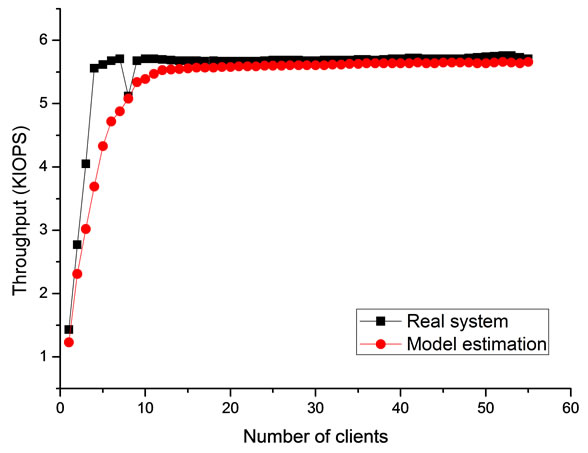
To examine whether the assumptions affect the accuracy of our model, the response time of the Vdisk requests calculated by the model is compared with the response time measured in the real system, as shown in Figure 4. The calculated values and the measured values are pretty similar to each other in the both two figures, which prove that the assumptions are reasonable in our scenario. In next section, this model is adopted to conduct the bottleneck analysis of TransCom system, especially, to evaluate the effect of the cache on both the server and the clients.
4. Performance Analysis of the Baseline System
The service demands are measured in the real system, as it is shown in Table 1" target="_self"> Table 1. The disk service demands at the server dominate among the shared resources, our research emphasizes on the investigation of the effect of the memory cache which can be presented by the hit rate.
4.1. Effect of Cache Hit Ratio at Server
The relationship between the server throughput at the heavy load and its cache hit ratio of the storage subsystem is plotted in Figure 5. The throughput isn’t sensitive to the hit ratio when the hit ratio is low, while it improves dramatically when the hit ratio is more than 80%. Besides, the large block size will achieve a higher throughput than the small one.
4.2. Congestion Analysis
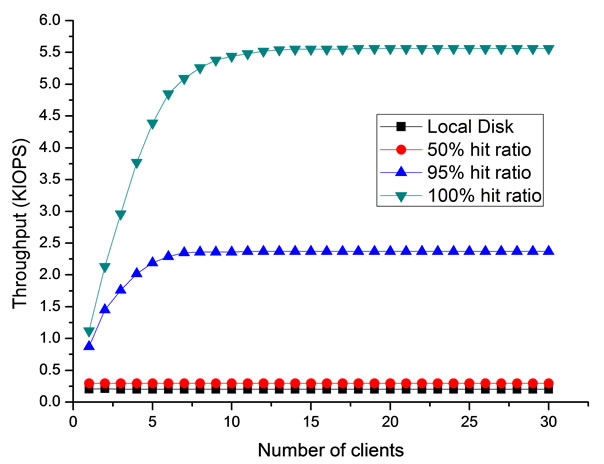
Figure 6(a) illustrates the throughput of the server at various loads. A fact can be observed that even the hit ratio is 100%, the server saturates at a rather small scale (about 15 clients). Another metric to evaluate the performance of our system is the latency issued by the clients. It is observed from Figure 6(b) that the access latency can be smaller than the local disk when the hit ratio is higher than a certain threshold. This indicates that remote disk accesses in TransCom may achieve better performance at a light load. According to Figure 6(a) and Figure 6(b), a design, that reduces light-load remote access latency at the expense of increasing service demands, would appear to be inappropriate. Conversely, a
 (a)
(a)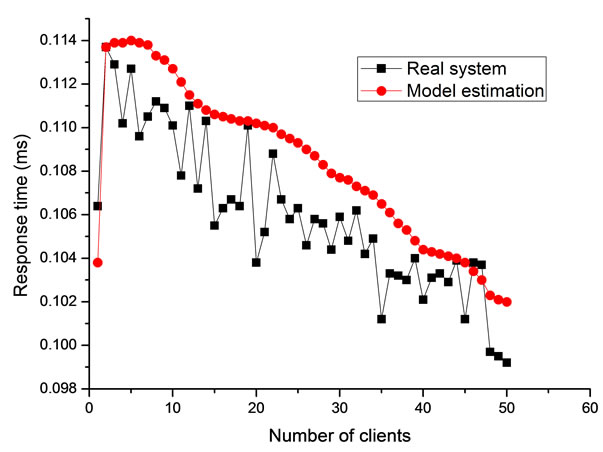 (b)
(b)
Figure 4. Performance comparison between model estimation and real system; (a) Throughput at various scales; (b) Average response time of each 4 KB request.
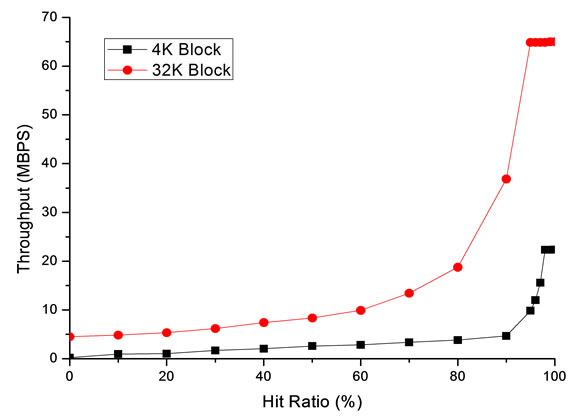
Figure 5. Relationship between the throughput and the server cache.
design, that reduces the service demands at the expense of some increase in light-load file access latency, would appear to be desirable.
 (a)
(a)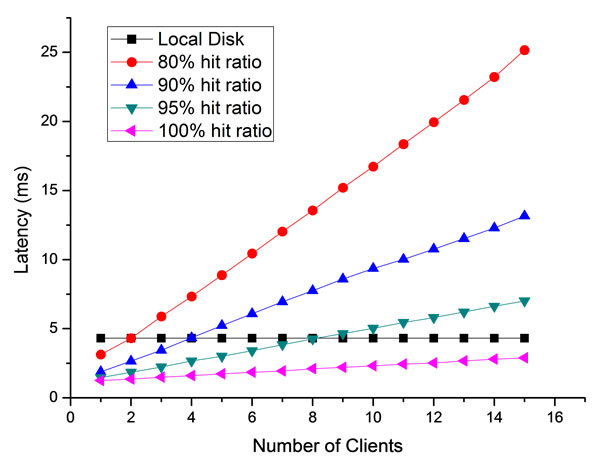 (b)
(b)
Figure 6. Congestion analysis at different server hit ratio; (a) Throughput at different server hit ratio; (b) Latency at different server hit ratio.
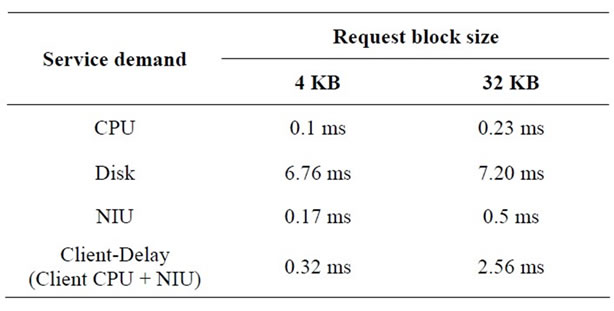
Table 1. Service demands to transfer a 4 KB or 32 KB request.
4.3. Bottleneck Analysis
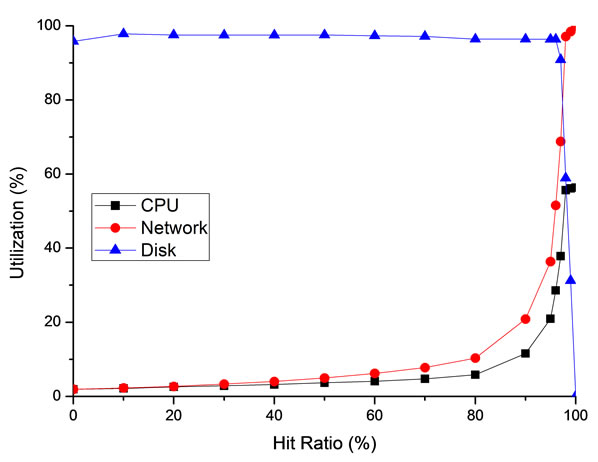
The bottleneck is the shared resource with the highest utilization at a heavy load. Because of the effect of the cache, the primary bottleneck may vary with the different hit ratios. Besides, the block size of a request, which is a factor that affects the ratio of the sequential and random accesses to the server disk, is also a potential factor that affects the bottleneck identification. Therefore, Figure 7" target="_self"> Figure 7 illustrates the utilization of some devices with the function of the cache hit ratio. Figure 7(a) presents a typical small block size (4 KB) and Figure 7(b) presents a typical large block size (32 KB). According to the two figures, the disk, or the storage subsystem, is the primary bottleneck when the hit ratio is lower than 90%, and the network becomes the primary bottleneck when the hit ratio is higher than 90%. The Utilization of the disk at a large block size drops more sharply than a small block size when the hit ratio increases.
5. Cache Strategy
In a caching scheme, requested blocks are saved in the main memory so that the subsequent requests for these blocks can be satisfied without disk operations. The performance of the cache depends on the behaviours of the workload, and the deployed location (client or server). In
 (a)
(a)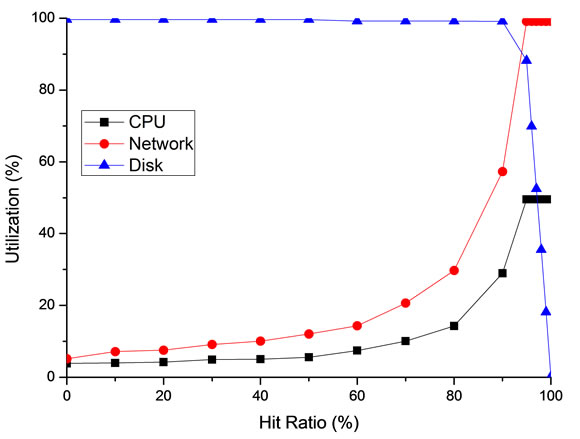 (b)
(b)
Figure 7. CPU, network and disk utilization at different server hit ratio; (a) Block size of request is 4 KB; (b) Block size of request is 32 KB.
this section, we discuss how these factors affect the cache hit ratio and the overall performance by simulation. We firstly study the client and server cache access patterns in TransCom. LRU [11] algorithm is used in client-side cache. A cache management algorithm called Frequency-based Multi-Priority Queues (FMPQ) proposed in this paper is used in server-side cache.
5.1. Cache Simulator
A program is written to simulate the behaviour of various kinds of caches, using the trace data to drive the simulations. The trace data is collected in the experiment mentioned in Section 3. The design of the simulator is similar to the classical stack algorithm, by which the hit ratios for all cache sizes could be calculated in a single pass over the reference trace.
The simulator represents the cache as a stack, with the most recently referenced block on the top. Each element of the stack represents a fixed-size blocks composed of several Vdisk sectors, and the upper k elements of the stack are the blocks in a cache. To simulate the image sharing mechanism, a block in the simulator is identified by a tuple < block_id, client_id > block_id is the linear address of the initial sector, and client_id is the MAC address of the client who “owns” the block. “Owner” of a block indicates a client who creates the block. A block with a specific owner, namely private block, is created when the owner firstly attempts to modify the content of a shared block with same block_id. Since then the client can access the new block instead of the shared one.
When the trace indicates that a range of sectors in Vdisk is read or written, the range is firstly divided into one or more block accesses. For each block access, the simulator checks to see if a corresponding private block owned by the requesting client exists. If so, it finds the private block in the stack and moves the block to the top of the stack. If not, the simulator checks whether it is a read or write request. If it is a read request, the simulator searches the shared block. If it finds the requested block, it moves the block to the top of the stack. Otherwise, it creates a shared block, and pushes it in the stack. If it is a write request, the simulator creates a private block belong to the client, and pushes it in the stack.
If a block is referenced at the level k, it is a “hit” for all sizes presented by the level k and larger. Counters are deployed in each level of the stack. It is response for recording the number of “hit” occurred at the certain level. To work out the hit ratio of the cache size k, we only need to sum all the counter numbers of the upper k levels.
5.2. Two-Level Cache Characteristic
Figure 8 illustrates the relationship among the hit ratio,
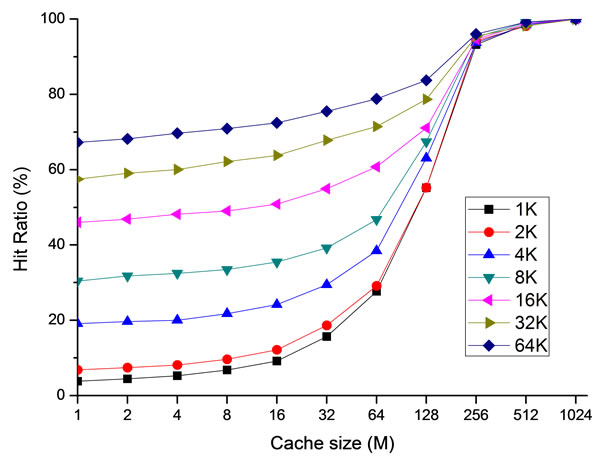
Figure 8. Cache hit ratio at the server.
the cache size and the block size at the server. As mentioned in Section 4, if the server cache hit ratio is raise up to 90% or higher, disks will not be the primary bottleneck of the system. Figure 8 shows that it is possible to achieve a hit ratio over 90% if the cache size is larger than 256 M. Since it is common for a PC or a server configured with several gigabyte memories today, it is reasonable to keep most working sets in the memory to achieve a high hit ratio in this scenario.
The simulation results of the client cache are similar with the server cache. However, since the client resources are usually limited, we focus on the hit ratio produced by a small cache size. As it is illustrated in Figure 9, the block size is the critical factor that affects the cache hit ratio, and the effect of the cache size increasing from 1 M to 16 M is negligible. This fact can be explained that the workload of Vdisk, filtered by the file system cache of the operating system, is lack of temporal locality.
Although, a large block size is able to increase the hit ratio of the client cache, it also increases the expenses of single request transfer, and produces more cache pollutions. Therefore, the model should be enhanced by adding the storage subsystem component to the delay centre. The new model is parameterized by the service demands and the simulation results of the client cache hit ratio, especially the server cache hit rate is assumed as 95%. Assumption of the workload is the same as the previous section.
A large cache block size achieves a higher hit ratio shown in Figure 9, however, it also makes the average response time longer at a large scale. This feature is distinct from the conclusions observed in the local disk analysis [12], that the average access time reduces as the block number increases. Because 95% server cache hit ratio dominates the access latency. In this scenario, a block size of 8KB allows the minimal access latency at a
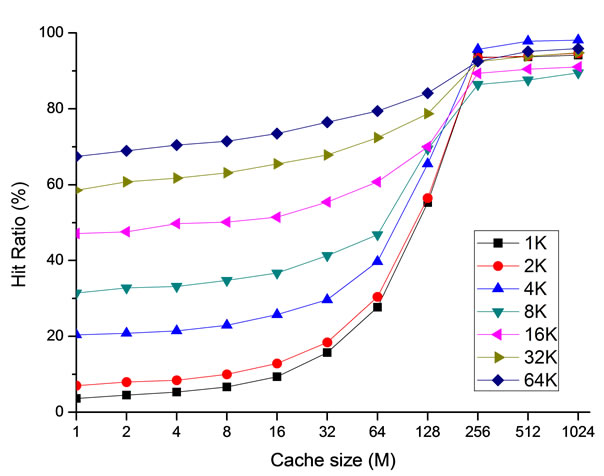
Figure 9. Cache hit ratio at the client.
scale of 50. Compared to a large server cache, a small client cache only reduces 27% at the optimal block size. Therefore, there are some benefits that can be achieved from the client cache. However, it is quite limited.
The effect of the cache at both the server and the client is analysed. According to our observations, several conclusions can be summarized. We firstly study whether data accesses in the client and server cache have temporal locality characteristics. Previous studies have shown that the client cache accesses show a high degree of temporal locality [13]. LRU algorithm, which takes full advantage of temporal locality, is mainly used in the client cache. Those blocks which have temporal locality characteristics may remain in the client cache, and at the same time the block requests unmet in client cache will access the server cache buffer cache. Therefore, the server cache is a critical mechanism to improve the overall performance of TransCom. The capability of the server increases slowly along with the hit ratio when the hit ratio is at a low level. However, it increases dramatically when the hit ratio is over 90%. Since the Vdisk image is widely shared, the working set size is small enough that a reasonable large cache size achieves a high hit ratio on the server. The workload of the server cache is less of temporal locality, so appropriate cache algorithm which achieves a higher hit ratio can reduce the access latency.
5.3. Frequency-Based Multi-Priority Queues (FMPQ)
In TransCom client, the client cache has temporal locality characteristic. Therefore, some cache replacement algorithm based on the temporal locality, such as LRU can be used. We use LRU algorithm as the client cache management algorithm. In the TransCom server, I/O requests accesses in the server cache show the characteristics, that some of the frequently accessed blocks satisfy a higher proportion of accesses, so we designed a cache replacement algorithm, namely Frequency-based MultiPriority Queues, which is based on the access frequency priority. FMPQ gives the highest priority on the blocks which are accessed most frequently. FMPQ also gives different priorities for the blocks depending on the access frequencies, and reserves for different periods according to the priorities of the blocks in the server cache.
FMPQ uses more than one LRU queue (Q0, Q1 to Qw–1) to store the different priorities of the blocks. w is an adjustable parameter. If the priority of Qi is lower than the priority of Qj (i < j), the life cycle of the blocks in the Qi will be less than Qj. FMPQ also sets up a queue Qoff, which records the access frequencies of the blocks which have recently been replaced. Qoff is a FIFO queue with a limited size, which only stores the identities and the access frequencies of the blocks.
FMPQ sets a function QCount(g) = log2g, which puts the blocks on the proper LRU queue. g is a given frequency. When the frequency of a block is changed, the function ascends the position of the block. For example, the block P is hit in the server cache, and then P is firstly removed from the LRU queue. And according to the current access frequency of the block P, the function QCount(g) = log2g calculates the result which is presented as d. The block is put at end of the Qd queue. For another example, the block P is accessed eighth times, and then P will be upgraded from the Q2 queue to the Q3 queue. When the block P has not been hit, FMPQ selects a block which is evicted from the server cache to make a room for the block P. When the replacer is chosen, FMPQ starts to query the head of Q0 queue. If Q0 is an empty queue, FMPQ will query the queues from Q1 until it finds a non-empty queue Qi with the lowest level, and then replaces the head of the queue. If the block R is replaced, its identity and the current access frequency will be inserted into the end of the historical cache queue Qoff. If Qoff is full, the identity reserved for the longest period in Qoff will be deleted. If the request block P is in the Qoff records, P will be loaded from the hard disk into the server cache, and the value of its frequency g is set to be the record value of the access frequency in Qoff plus 1. If the block P is not in Qoff, it will be loaded into the server cache, and its frequency g is set to 1. At last, according to QCount(g), P is moved into the relevant LRU queue.
In the server cache, FMPQ sets a failure time parameter, OverTime, for each block, which is used to drop the inactive blocks from the high priority queue to a low priority queue and is used to exceed the access count limit. “Time” here refers to the logical time, which is the access count. When a block enters a LRU queue, OverTime is set to be NowTime + DurationTime. The DurationTime is an adjustable parameter for setting the survival time of each block in a LRU queue. When an access happens, FMPQ compares OverTime of the head block of the queue with NowTime. If OverTime is less than NowTime, the block will be moved to the end of the next level queue and the value of its OverTime will be reset.
Similar to 2Q [14] algorithm, FMPQ also has a time complexity O(1). Because all of the queues use the LRU list, w is usually very small. When an access happens, up to w-1 head blocks will be checked for the possible downgrade. Relative to FBR [15] or LRU algorithm, FMPQ is highly efficient and very easy to be implemented.
6. Optimization and Experiment
6.1. Evaluation of FMPQ
We have evaluated the local algorithms for the two level buffer caches using trace-driven simulations. We used the analysis of the I/O request access patterns in the Section 3 to simulate FMPQ algorithm. LRU cache replacement algorithm is used in the client’s Vdisk driver, on server-side the FMPQ and three existing replacement algorithms, LRU, FBR, and 2Q, are implemented. The block size is set to 4 KB. The requests have a significant temporal locality characteristic in the client cache, so this section will not evaluate the performance of the client cache algorithm in TransCom client, and focus on the performance of FMPQ algorithm in the server cache.
In the trace load tests, the performance of LRU algorithm is not very good, even if it has a good performance in the client cache. There is no algorithm worse than LRU, because the longer minimal distance in the server cache makes the access frequency inaccurate. The performance of FBR algorithm is better than LRU, but it is always worse than FMPQ, in several cases the difference is very large. Although FBR considers the access frequency in order to overcome the defects of LRU algorithm, but it is difficult to adjust the parameters to combine the frequency and recency properly. The performance of 2Q algorithm is better than other algorithms except FMPQ. To set up a separate queue, for the blocks only accessed once, 2Q will store the blocks accessed frequently in the queue for a long time. When the server cache size is small, 2Q hit ratio is lower than FMPQ, because the life cycle of a block in the server cache is not long enough to reserve it to be accessed in the next cycle. To learn more about the test results, we use the temporal distance as a measurement to analyse the performance of the algorithm. The analysis in Section 5 shows that the access to the server cache mostly tends to maintain a longer temporal distance, so the performance of the server cache replacement algorithm depends on the extent that it meets the survival time attribute of the block.
If the temporal distance of the majority accesses is longer than S, the replacement algorithm which cannot save most of the blocks during a period that is longer than S is unlikely to have a good performance.
We choose to the trace load to analyse in detail. Table 2 shows the hits and misses of different algorithms in the two types of access when the size of the server cache buffer cache is 256 MB. FMPQ has a significant reduction in misses in the right column, as shown in Table 2, the misses of FMPQ in the right column is 2573 k, which is 33% less than LRU. Similar to the FBR algorithm, the FMPQ algorithm has some misses in left column, but the number of the misses is very small, only about 13.2% of the whole number of misses. Overall, the performance of FMPQ is significantly better than other algorithms.
6.2. System Optimization
According to the discussion above, the remote memory accesses are faster than the local disk, because the remote fetching, paging and swapping of the programs in TransCom are done more efficiently than the local disk, even if tens of clients work together. The key point to achieve the goal is to avoid the server disk accesses as much as possible. Therefore, several key points are proposed to enhance the system performance effectively, especially at a heavy load.
1) Strategy A: A large memory cache (e.g. 1 - 2 GB) should be configured at the server to ensure a high hit ratio. A small memory (e.g. 1 MB) cache is enough at the client, and the block size is more significant than the cache size.
2) Strategy B: FMPQ algorithm is used in the server cache and client cache as a two-level cache strategy.
3) Strategy C: A disk cache at the client is deployed to localize the accesses to “shadow image”. Given the capabilities of the cheap disks today, the disk cache can be considered as large enough to contain all a user’s modified blocks. The shadow image localization absorbs nearly all the write accesses and partial read accesses at the client, which greatly reduce the overhead of both the server and the network.
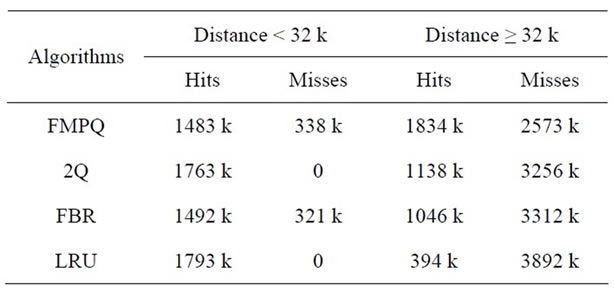
Table 2. Hits and misses distribution with a 256 MBytes buffer cache.
4) Strategy D: As shown in Section 4, the network is the primary bottleneck, if the cache works effectively. We investigate the efficiency of the UDP transmission in different OSes, and the result presents Linux is much more efficient than Windows. Therefore, using Linux as the platform of TransCom server applications is much better in term of the performance.
OS boot is a typical I/O intensive procedure in TransCom. The concurrent boot time in multi-clients is a metric used frequently to evaluate the performance of the system. In this experiment, we emulate a scale of 50 clients and compare the boot time with the four optimizations mentioned above.
In the experiment, hardware configurations of the server and the client are the same as the baseline system described in Section 3. There are 50 clients and a server connected by a switch in LAN. We develop an I/O emulator, called IOEmu, which is deployed on each client. IOEmu is a software which is used to emulate multiclients’ behaviours. An emulated client is a thread running on a workstation, which sends requests continuously instructed by a trace file. The trace files are the logs of Vdisk requests, and each entry of the log records the information of a request, such as the initial block number, the requested block length, and the request issued time. Therefore a trace file can be considered as a script of the workload. In addition, IOEmu is able to emulate more than one client on a workstation by creating multiple emulation threads.
We enable the 4 optimizations incrementally to observe the benefits of each one. As shown in Figure 10, each optimization is able to reduce the boot time. A combination effect of the four optimizations can decrease the boot time by 63%. The results not only prove the optimizations we proposed are effective in TransCom, but also prove the correctness of our analysis method for this kind of systems.
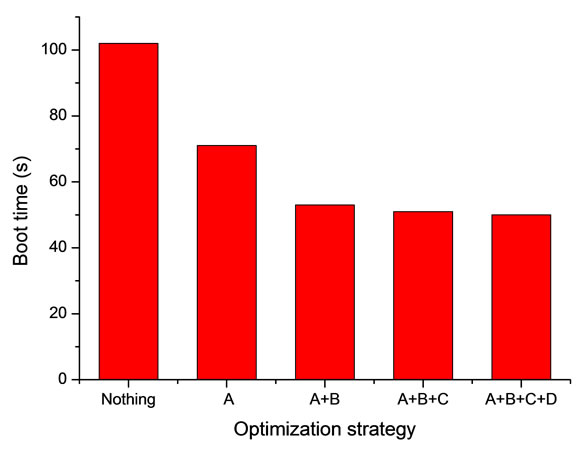
Figure 10. Comparison of Boot time using different optimization strategy.
7. Conclusions and Future Work
TransCom is a novel pervasive computing system which allows users to download and execute heterogeneous commodity OSes and their applications on demand. This paper analyses the characteristics of its real usage workload, builds a queuing model to locate the bottlenecks of the system, and studies the client and server cache access patterns in TransCom system. Finally, we evaluate several design alternatives which are able to improve the capability of TransCom server.
Research in this paper aims to increase the throughput and the capability of the server so as to achieve a high scalability by reducing the server demands of the bottleneck resources. To solve this problem, another solution is to combine the clients’ cache to form a cooperative cache system. A p2p protocol should be introduced to locate and download required block from other clients’ memory. Our research discovers that the workload of Vdisk system is lack of temporal locality. The multi-level buffer cache has been well studied in the data centres and several replace algorithms about the weak locality have been already proposed. All these replace algorithms could be carefully evaluated in the transparent computing environment.
REFERENCES
- M. Armbrust, A. Fox, R. Griffith, A. D. Joseph, R. Katz, A. Konwinski, G. Lee, D. Patterson, A. Rabkin, I. Stoica and M. Zaharia, “A View of Cloud Computing,” Communications of the ACM, Vol. 53, No. 4, 2010, pp. 50-58. doi:10.1145/1721654.1721672
- R. Buyya, “Market-Oriented Cloud Computing: Vision, Hype, and Reality for Delivering IT Services as Computing Utilities,” 10th IEEE International Conference on High Performance Computing and Communications, Dalian, 25-27 September 2008, pp. 5-13.
- Y. X. Zhang, “Transparent Computing: Concept, Architecture and Example,” Chinese Journal of Electronics, Vol. 32, No. 12A, 2004, pp. 169-174.
- Y. X. Zhang and Y.-Z. Zhou, “4VP: A Novel Meta OS Approach for Streaming Programs in Ubiquitous Computting,” 21st International Conference on Advanced Information Networking and Applications (AINA 2007), Niagara Falls, 21-23 May 2007, pp. 394-403.
- W. Aspray, “The Stored Program Concept,” IEEE Spectrum, Vol. 27, No. 9, 1990, pp. 51-57. http://dx.doi.org/10.1109/6.58457
- L. Wei, Y. X. Zhang and Y.-Z. Zhou, “TransCom: A Virtual Disk Based Self-Management System. Autonomic and Trusted Computing,” 4th International Conference (ATC 2007), 11-13 July 2007, Hong Kong, pp. 509-518
- W. Y. Kuang, Y. X. Zhang, Y.-Z. Zhou, et al., “NSAP—A Network Storage Access Protocol for Transparent Computing,” Tsinghua University (Science & Technology), Vol. 49, No. 1, 2009, pp. 106-109.
- B. Pfaff, T. Garfinkel and M. Rosenblum, “Virtualization Aware File Systems: Getting beyond the Limitations of Virtual Disks,” Proceedings of the 3rd Symposium on Networked Systems Design and Implementation (NSDI06), San Jose, 8-10 May 2006.
- S. Tang, Y. Chen and Z. Zhang, “Machine Bank: Own Your Virtual Personal Computer,” Proceedings of the 21st IEEE International Parallel and Distributed Processing Symposium (IPDPS’07), Long Beach, 26-30 March 2007, pp. 1-10.
- D. T. Meyer, G. Aggarwal, B. Cully, G. Lefebvre, et al., “Parallax: Virtual Disks for Virtual Machines,” EuroSys’08, Glasgow, 31 March-4 April 2008.
- C. I. Aven, E. G. I. Coffmann and I. A. Kogan, “Stochastic Analysis of Computer Storage,” Reidel, Amsterdam, 1987.
- W. H. Windsor and A. J. Smith, “The Real Effect of I/O Optimizations and Disk Improvements,” UCB/CSD-03- 1263, University of California, San Diego, 2003.
- R. Karedla, J. S. Love and B. G. Wherry, “Caching Strategies to Improve Disk System Performance,” Computer, Vol. 27, No. 3, 1994, pp. 38-46. doi:10.1109/6.58457
- T. Johnson and D. Shasha, “2Q: A Low Overhead High Performance Buffer Management Replacement Algorithm,” Proceedings of Very Large Databases Conference, Seoul, 12-15 September 1995, pp. 439-450.
- J. Robinson and M. Devarakonda, “Data Cache Management Using Frequency-Based Replacement,” Proceedings of ACM SIGMETRICS Conference Measurement and Modeling of Computer Systems, Boulder, 22-25 May 1990, pp. 134-142. doi:10.1145/98457.98523