Journal of Service Science and Management
Vol.11 No.02(2018), Article ID:84006,23 pages
10.4236/jssm.2018.112016
Divergence between Value Stream Mapping Western Understanding and Material and Information Flow Chart Principles: A Japanese Automotive Supplier’s Perspective
Zuhara Chavez1, Takefumi Mokudai2, Michiru Uyama3
1Department of Automotive Science, Kyushu University, Fukuoka, Japan
2Department of Business and Technology Management, Kyushu University, Fukuoka, Japan
3Department of Industrial Management, Kyushu Sangyo University, Fukuoka, Japan

Copyright © 2018 by authors and Scientific Research Publishing Inc.
This work is licensed under the Creative Commons Attribution-NonCommercial International License (CC BY-NC 4.0).
http://creativecommons.org/licenses/by-nc/4.0/


Received: March 21, 2018; Accepted: April 23, 2018; Published: April 26, 2018
ABSTRACT
Through visualization, mapping techniques help manufacturing organizations prioritize and guide improvement strategies. For this reason, mapping of the value chain is applied as a method of progress toward lean manufacturing. The purpose of this paper is to illustrate the essence of the material and information flow chart (MIFC) approach, known as value stream mapping (VSM) in the West, to provide a different perspective and understanding and to identify its manner of integration with measurement systems. Metrics complement mapping tools allow the tracking of various stages of an organization’s lean journey and continuous improvement (CI). While the time dimension is predominant in performance metrics in lean environments, these metrics do not link the economic factor directly to improvements. The research comprises a case study in which lessons are learned from tool placing and metric determination. Empirical research included critical case sampling and semi-structured interviews, and data were analyzed to compare the conventional Western understanding of VSM with that of a Japanese supplier that learned the principles directly from the source and applied their own version of MIFC. An understanding of the tool based on core knowledge will enable organizations to reevaluate their current measurement systems and choose more suitable ones.
Keywords:
Value Stream Mapping, Mapping Tool, Lean Measurement, Performance Measurement

1. Introduction
Many companies have used the tools applied by Toyota with some success in their operations, but often failed to achieve the remarkable quality, speed, and productivity results for which Toyota is known [1] . Manufacturing leanness is a continuous process improvement technique that strives to generate optimum value from the process [2] .
The American lean interpretation of the Toyota production system (TPS) is designed for the Western world to catch up and is twofold: 1) lean transformation, regarding how to change fast and effectively, and 2) lean philosophy, regarding what to change and what to aim for [3] .
The implementation of an inappropriate lean strategy for a given situation can sometimes lead to increased manufacturing waste, cost, and lost production time. Because of poor lean strategy selection, changes may disrupt the process that is targeted for improvement. It is crucial to have a systematic method for the implementation of appropriate lean strategies, based on waste identification in manufacturing processes [2] .
The classic two-pillar TPS representation tends to seduce users into just picking some tools out of the TPS and might have supported a narrow-minded view of the process. In every case, tool-picking allows the attainment of a certain improved level, but that is non-optimal and probably unstable. Therefore, it is important to present new representations of TPS that show the interactions between the tools and how they mutually require each other [3] .
Developing an organization’s managerial system or model to this end is not about copying the tools and techniques that another organization has come up with―that would be to jump at solutions. Each organization has unique characteristics and exists under unique conditions [4] .
The most-taught and commonly applied lean concepts in Western countries are mainly concerned with value stream mapping (VSM) and muda (wastage) identification and elimination, as well as the lean transformation approach. In addition, a strong tool-based belief is at the core, which often deviates from the real origin of the problem itself. This is a different approach from the original TPS [3] .
After analyzing the literature about lean tool classification by several authors [5] - [10] , [2] proposed that the most commonly used lean tools include line balancing, concurrent engineering, cellular manufacturing, process layout, 5S, single minute exchange of dies (SMED), total quality management (TQM), total production management (TPM), and automation. While these existing lean evaluation tools do describe the lean status of an organization, they do not assist with tracking and identification of improvement activities. Of the many Western companies implementing lean thinking today, very few can demonstrate the benefits of lean; this is partly because their performance measurement systems do not focus on doing so [11] .
VSM is the pioneer tool known in manufacturing for tracking flow and observing ways to remove waste by identifying its source [12] . VSM is a tool that helps you to see and understand the flow of material and information as a product makes its way through the value stream by creating a diagram that is, mapping. Mapping in VSM means following a product’s production path from customer to supplier and carefully drawing a visual representation of every process in the material and information flow. Then a set of questions is posed and a “future state” map is drawn of how the value should flow [12] . The objective in drawing the map is to identify each significant action required to create the desired value.VSM visualization aids in prioritizing improvement efforts. More novel tools such as value stream costing (VSC), cost-time profiling (CTP), and metric-based process mapping (MBPM), as well as VSM variants, that is, value stream macro mapping (VSMM) and value network mapping (VNM), are demonstrating potential in solving needs of particular environments that regular VSM cannot solve(e.g., tracking a whole supply chain, tracking processes involving complex products with shared resources and multi-level bills of materials, showing the waste effect in cost, etc.). In this paper, however, for practical reasons we will focus on assessing only VSM; we will briefly introduce the variants of VSM that, to this date, are intended to reduce the constraints of traditional VSM in the Western world. The case study is only focused on the application of material and information flow chart (MIFC), or VSM for Western readers.
The metrics to track the manufacturing performance associated with mapping tools?in particular, VSM?only consider time frame, and misunderstanding still exists on where each tool is placed in a value stream. Some authors have raised similar concerns that still require resolution [2] [13] .
There is a conventional understanding of tools in the Western countries, based on knowledge acquired by Western researchers directly from Toyota. While the knowledge is not incorrect, researchers have adapted the raw information based on their understanding, bias, and translation to Western environments.
For instance, VSM [12] and MIFC are terms that refer to the same mapping tool. The first term was brought to Western countries, while the second is the direct translation (MIFC in Japanese) “mono to jouhou no nagarezu” from Toyota, which is the originator and teacher of the tool’s principles to direct suppliers. As a consequence, practitioners in the original environment refer to the tool as MIFC, and the method varies from VSM.
These findings lead to our central research question: how do mapping tool approaches, that is, VSM and MIFC, differ between Western and Japanese organizations; and how does this affect the selection of measurement systems? This study focuses on comprehending how mapping integrates with measurement systems in continuous improvement (CI) environments. Mapping occurs in all the lean-related phases of existing lean transformation models, and for this reason, the mapping is the focus of this research. It aims to comprehend the essence of VSM in lean transformation. The importance of VSM or any other such tool or technique is situated in the statement that they can either boost or sabotage improvements. This research intends to provide a neutral understanding of the utilization of VSM and MIFC to help organizations and practitioners gain the representative advantages of their usage.
The structure of the article is as follows. Section 2 comprises a literature review, which briefly describes mapping in lean manufacturing. As such, it sets the scene for exploring the core topic of this research, which is VSM and performance metrics linked to CI in organizations. Section 3 describes the study methodology, which comprises a case of a Japanese automotive supplier located in Japan. Section 4 describes the case study to exemplify an adaptation of knowledge through mapping by MIFC. Finally, Section 5 presents conclusions, limitations, and future research recommendations.
2. Literature Review
2.1. Mapping and Performance Measurement
2.1.1. Value Stream Mapping: Attainments and Constraints
The increased implementation of VSM shows that many companies are interested in tools to compress the time dimension of their processes; also, awareness is stronger than ever that smooth and quick flows of product through the process are desirable characteristics [14] .
Several arguments exist for considering VSM’s potential to improve production systems: 1) the analysis of the initial situation is based on data acquisition; 2) the integration of numerical data with a graphical interface makes it easy to see the relationship between material and information flows; 3) a systematic vision reflects the inefficiencies of the manufacturing system for each family of products; 4) a common language unifies the concepts and techniques in a single body; and 5) it provides the possibility of a starting point for a strategic plan for improvement [15] .
VSM is seen as one of the most powerful tools to understand basic manufacturing principles, see how the manufacturing system works, and begin the lean transformation of Western companies, not only in industries, but also in services. Performing a VSM exercise showing muda and recursive loops provides only a limited view of lean, but is often applied. Nevertheless, it is mentioned as an ideal approach for starting the lean journey [3] . The purpose of VSM is to identify every single process in the flow, pull each one out from the background clutter of the organization, and build an entire value stream according to lean principles. The point is not “mapping”, but implementing a value-creating flow [12] .
In a value stream map, there is a high emphasis on the creation of a future state to align the organization’s strategy. It has been argued [4] that a future-state value stream map is a challenge that focuses and aims for individual improvement efforts toward a shared breakthrough goal. The map defines the standard direction for improvement for the individual processes inside the value stream, which helps to connect the process improvement efforts in each area.
Reference [4] emphasizes the future state as a focal point for aligning individual improvement efforts by aiming these at an overarching goal. They use VSM to help establish a strategic challenge and then utilize the skills taught by practicing improvement kata (IK) and coaching kata (CK) to work toward that challenge.
Studies related to VSM tend to focus on its application [16] [17] [18] . Researchers [19] undertook a literature review on VSM (120 studies were selected in the manufacturing industry), analyzing the tool’s evolution, application, and performance. They found that in previous research, authors utilized both lean and non-lean tools. In the subject of performance, available literature indicated that reduction of lead time (LT) is the key performance indicator that most of the researchers targeted in their papers, where the average improvement is 52.26 percent when applied. Europe came up as the area with more research about VSM; however, Asia has contributed notably to the development of knowledge in this field too, especially in recent years; these efforts have primarily advocated modeling and simulation studies.
Despite its success, VSM has shortcomings when it is used to analyze complex processes where the value is mostly intangible and varies for different stakeholders. In addition, traditional VSM lacks a practical way of modeling elements (e.g., costs, interfaces, harms, etc.) that are present in multiple steps of the value stream, and does not provide a systematic approach to generating different types of improvement ideas in incremental and step changes [20] . Reference [14] states that VSM considers only the time dimension and ignores the accumulation of cost during the manufacturing processes.
In cases in which the applicability of VSM is analyzed, the following weaknesses are highlighted [21] [22] :
1) It fails to map multiple products that do not have identical material flows.
2) It fails to identify delays and unnecessary transportation, as well as changes in lots of transfers due to poor plant layout design and handling of materials, and operational parameters, such as machine cycle times (CTs) and performance measures.
3) Economic “value” measures such as utilities, operating costs, and inventory costs are not considered.
4) It fails to show the impact that the plant distribution has on delays that arise from inefficient materials handling and poor batch sequencing in each process flow; at the same time, it omits container sizes, trip frequencies between operations, etc.
5) It is based on the manufacturing of low range, high volume systems.
6) It lacks visibility of inefficiency impacts (e.g., the creation of larger amounts of WIP, cost of operation, downtimes, and leisure) due to products travelling large distances, unintegrated workflows, the lack of independence in a process, and nonexistent protocols.
2.1.2. Value Stream Mapping: Emerging Variants
Most of the variants of VSM have appeared recently; this could be due to many reasons, such as new challenges in the market, the weaknesses of the traditional VSM, and its ease of adaption to the characteristics of different production environments [19] .
There are two technical variants of VSM: VSMM and VNM. Both of them emerged in an industry different from the automotive, but their precepts can be of help for future research applications.
VSMM, as its name implies, is an extension of VSM; it allows manufacturers not only to see the waste and flow within a company, but also to understand the material and information flows throughout the supply chain, involving several companies. It provides a complete view of the processes of the value chain of a specific product family, as well as the identification of suppliers and their production processes; and allows the identification of waste inherent in the value chain of the family of products selected for mapping [23] [24] .
VSMM generates the possibility of applying lean concepts and techniques into all macro manufacturing, since the display of the value of the product flow promotes the application of these techniques as a whole and not individually, that is, along the supply chain. The main objective of macro value chain mapping is to allow agents of the supply chain to identify waste, particularly mura, that is, unevenness or inconsistency, and focus on flowing together to create the ideal state and thus allow the analysis of the necessary interfaces for the composition of the future state, incorporating improvements [23] . Tackling mura can prevent causing muri that is, overburden, and as a consequence reduce muda―the seven wastes as categorized by Taiichi Ohno within TPS.
VNM was developed to eliminate the limitations imposed on the traditional methodology when “many value streams have multiple different flows that merge” [22] . It can map the complete network of intra-flows in a value chain that belongs to a complex product, with a complex bill of material and several levels of assembly. VNM has been shown to be a more suitable approach for the predominant current context in company structures and production strategies. This context is characterized by: working in complex environments where the processes required to manufacture products involve several subassemblies and a complex bill of materials; work is made or engineered to order for a given scheme; volume is low, but variety high; LTs must be low and at a reasonable cost; and budgets for tool application are limited [25] . Despite the improvements that VNM brings to VSM, in the application of the tool to contexts that are more like a project environment than a serial production scheme, it shows several deficiencies, some of them are shared with VSM. Specifically: it lacks information on lot sizing, CT, job sequencing, and work in process buildup at each process due to queuing delays; it requires better design of the future state map; it does not consider capacity limitations of the system when multiple assemblies require capacity use of a shared process; and it lacks detailed analysis of the material handling systems and processes connecting different pairs of process boxes.
More contemporary VSM approaches have emerged, for instance, [20] presents a VSM model, stating that the main improvements compared with traditional VSM approaches are in analyzing the intangible and fuzzy aspects of the value stream and in providing better support for systematic generation of ideas for improvement. They presented VSM for complex processes and systems in essence as a fusion between the original VSM and the theory of inventive problem solving (TRIZ). The hybrid method consists of nine steps, and the analysis section represents a bigger component compared with traditional VSM. In this method, the analysis is performed in sections―workflow, interfaces and delays, steps of the workflow, and key problems―before creating the future state.
In a proposed methodology, [2] identified VSM, time study, and visual controls as possible tools to visualize the current states of any process and identify wastes and non-value-adding activities.
Another approach that targets the modern factory is VSM 4.0, its objective being to indicate potentials of process stabilization, to find out the current state of management of information in the value stream, and to identify inefficient and ineffective information flows clearly. The focus of the method is that the various kinds of data collection, the handling of information, the storage media, the key performance indicators (KPIs), and the utilization of the collected information can all be represented visually [26] .
2.1.3. Measuring Performance in Mapping
Firms often fail to maximize the benefits of lean at a macro level, because they fail to develop the performance metrics needed to evaluate improvements in effectiveness and efficiency. Different methods to measure systems leanness exist. One of the most prolific approaches has been to observe how many lean tools, techniques, or principles a company has implemented [14] . This derives from the classical “temple” representation of the TPS, often leading to the interpretation that lean is a toolbox from which one can select independent tools. By picking just some tools, however, the full potential of the TPS certainly cannot be exploited, and in the worst case, it may even cause production disruption [3] .
Given the inherent complexity of manufacturing processes, a measurement method to deal with these complications is particularly critical. Moreover, [27] state that conventional measures have the disadvantages of measuring mainly financial metrics (rate of return on investment, cash flow, and profit margins), thus tending toward an inward-looking focus, failing to include intangibles and lagging indicators.
The effectiveness of an organization increasingly depends on investments by suppliers and customers, and thus the relationship will move from being dominated by customer purchasing power and short-term product cost and quality considerations, which can be measured by traditional metrics, to a relationship involving a much longer-term commitment by all the parties involved, for which new metrics must be developed [13] .
Information collection from manufacturing processes is mainly adapted for mass production, and product cost represents crucial management information. In the modern economy, however, customer value and measuring the cost of resource usage are the priorities. Many companies are not able to identify and recognize complete value streams [28] , failing to recognize situations when it is necessary to take proper action promptly.
Value stream costing (VSC) is a technique under the lean accounting canopy that was introduced around the year 2000. It is based on the value stream concept and is intended to avoid the drawbacks of traditional costing. VSC aims at capturing the cost of materials, labor, and every resource directly within the value stream, with little or no overhead cost allocation. The VSC-based lean manufacturing system creates an understandable and timely way of costing a product family (at an intermediate level of detail), thus driving CI and decision-making in combination with nonfinancial performance measures [29] .
Reference [30] suggest VSC as a way to simplify production cost calculations when an organization has achieved certain milestones, such as short LT, low and stable inventory levels, and flexible value chain lines. VSC is compatible with other tools, as shown by study cases on VSM [29] and CTP [28] . In both cases, VSC was indicated as a great supporter of lean initiatives [31] . Differences between direct and indirect costs disappear when value stream costing is applied; all costs within the value stream become direct, and costs outside of the value stream map are not included [28] . Metrics and future states presented by [29] [32] reflect the improvement achieved after value stream costing. A drawback of VSC is that a methodology that treats all items as equal might work well for short-term performance measurement and short-term decisions, but not when considering the long term [29] .
VSC is not a standalone tool; it serves in support of mapping tools, that is, VSM, CTP, and MBPM. It covers the need for a costing method that works better with lean manufacturing, as long as there is a level of lean maturity in the organization, as mentioned by [31] .
The researchers in reference [33] focus on the analysis and VSM use to obtain improvements through the efficient implementation of kanban scheduling systems and milk runs. Their strategic influence is measured by means of two lean metrics: lean rate (LR) and dock-to-dock time (DtD). These metrics are essential to establish gains and identify areas for further improvement. Improvement objectives were to reduce stocks while avoiding idle periods or worker movements due to the accumulated material. Both objectives were reached, and the LR and DtD metrics were improved.
LR and activity ratio (AR) are the most well-known numerical indexes used to represent how lean an organization is. The concept behind them is very similar, even though the names of their components are slightly different. Both support mapping tools such VSM and MBPM, and the indexes are recalculated and analyzed to control improvements. LR is useful for finding and tallying inventory accumulations where the flow of value had to be interrupted due to process problems [33] . In general, LR represents the percentage of the time that adds value to a production system; the aim is to increase it as much as possible.
AR also represents a percentage, used as a metric. It is already set up when performing an MBPM analysis [34] . The percentage is the fraction of the time of the total performed work.
Continuous performance measurement (CPM) is a more novel method proposed by [2] to assess the current state of the process and measure production efficiency and effectiveness. The CPM metric is applied to compare the efficiency and effectiveness before and after lean implementation; it simply compares output and input values in terms of time frequency. The proposed method is a useful approach; nevertheless, the study still only considers the time dimension, while wastes were identified by time studies and process mapping. An additional restriction mentioned by the author is that the organization must have a lean team of skilled personnel from different departments of the company at the early stages of lean implementation.
Reference [17] introduced a methodical approach that connected VSM and methods-time measurement (MTM) and offered a new approach to reduce LT and measure productivity based on lean principles and standardized processes.
2.2. Summary of Literature Review
The literature shows that the implementation of tools, often with remarkable test results from their originators, does not necessarily lead to the same kinds of outcomes in other companies. Each organization has unique features and needs. Therefore, replication of tools and techniques from company to company is not equivalent to success; regardless of the company leanness degree originated by the tools, the adopter organization needs to adapt to some extent.
The applications in the literature suggest that practitioners often omit the internalization and adaptation of the tool―there is a higher priority on achieving targets and metrics than on internalizing a best practice or technique.
For instance, the future state in VSM is a step in the process of applying the tool that serves as goal-setting (quantifiable) and a way to lead workers towards the same vision; it is often created by management’s need to ensure that all members of the organization are working towards the same objectives. Thus a greater emphasis is placed on the future state creation than on the conception and understanding of the current condition. This differs from the conventional understanding about mapping tools, as transferred by the original source, Toyota.
We can refer to an example in the literature [35] , a typical illustration showing that the real aim of the TPS and its tools are often misunderstood: Western companies tend to believe that the time-reducing SMED set-up technique is carried out to gain more production capacity by reducing the non-value-adding set-up time, that is, explicitly to chase muda, whereas the original idea of SMED is to implement a mixed product cell, that is, to lower the pitch to manufacture different products several times a day within the same cell to allow JIT manufacturing.
We can see evolution and innovation with the mentioned emerging mapping tools and VSM variants; they are showing potential in constantly changing and complex environments, while the cases demonstrate that they are tackling needs that regular VSM cannot solve. The solutions may not always be optimal regarding achieving JIT long term, but the progress is noticeable, since they are already looking for solutions on the challenges encountered with VSM, incorporating elements that enhance the tool, instead of accepting the constraints. The literature about lean transformations, however, could employ a deeper analysis about the selection of those tools, to avoid applying efforts erroneously.
Metrics complement the mapping tools that allow the various stages of an organization’s lean journey to be tracked. While the time dimension is predominant in the metrics used to measure performance in lean environments, the economic factor is not directly linked to improvements.
The time dimension, that is, LT, CT, and processing time can serve as a basis for tracking improvements. However, we can also associate other data (WIP, man-hours, inventory), the specific details of which facilitate better direction in designing improvement projects and in rapid decision-making.
Organizations often omit the adaptation of metrics, when using proper metrics can benefit increases in performance as well as utility. Knowledge transfer systems must be in place to facilitate routines for the learning of internal protocols. Reducing the weaknesses and shortcomings of a system is itself a challenge, but it is also necessary to adapt it to a particular application environment.
3. Methodology
Case studies are generalizable to theoretical propositions and not to populations or universes. In this sense, the investigator’s goal is to expand and generalize theories (analytic generalization) and not to enumerate frequencies (statistical generalization) [36] . That said, a single case study is used because, as stated by [37] , theory-building based on case studies can be done with the objective of not only uncovering contingency effects, but also of producing empirically grounded explanations for them. We employed purposive sampling, a particularly critical case sampling technique. Critical case sampling can facilitate “logical generalizations” with the reasoning that “if it happens there, it will happen anywhere”, or, vice versa, “if it does not happen there, it will not happen anywhere” [38] .
The supplier analyzed in this case is called supplier A. This supplier was selected for its active employment of the mapping tool MIFC (as the supplier commonly calls it) in its operations and seems to be working under a CI mindset. This supplier adopted the knowledge related to MIFC directly from Toyota, which makes it a suitable case study to illustrate an adaptation example of a mapping tool in a real environment. One of the coauthors visited supplier A for another research project and happened to learn that the supplier had achieved remarkable improvements in productivity and quality through active utilization of VSM. On request from the coauthor, the supplier agreed to participate in the project. The case of supplier A is outlined in more detail in Section 4.
The first phase involved a site visit focused on examination, as well as semi-structured and unstructured interviews with management (details of the interviews are shown in Appendix). The company was at first sight assessed with regard to the following areas:
1) Overview of the operations.
2) Kaizen programs in place (if any).
3) The knowledge level across the organization about lean thinking.
4) Metrics or indicators in place to track performance and measure improvement on the production floor.
5) Mapping tools usage and support tools such as VSM and variants, MBPM, CTP, and VSC (in case any of them were used).
6) The education and training programs for the utilization of the tool(s), or for any other tool or technique in place.
Furthermore, the researchers expected to get a sense of best practices and employees’ knowledge around CI, organizational behavior, habits and routines, and leadership. The second phase focused on empirical studies and the gathering of data that would allow a numerical, objective description of the production floor, as well as the future definition of a metric with an economic value, which is in real terms based on original data. The data that would enable the definition of a metric must contain numerical production line information. Data could include CT, production rates, inventory of raw material, work in process (WIP) and finished goods (FG), material control protocols in place (leveling rules, demand, in-line supply systems, etc.), and current performance metrics. These data are the tangible proof and counterpart of the visual observations.
Different forms of data were collected from the supplier, including interview recordings and transcripts from researchers, field notes, and documents received from the company. The documents obtained from the company comprised MIFC maps, organizational charts, metric data charts, job instructions, and other hard copies of information (i.e., CT, value and non-value-adding activities, WIP, take time, etc.). Oral permission to record interviews was obtained from each participant, and official permission was obtained for photo shooting before plant tours.
Three researchers of differing national background (Japanese and foreign) attended all the visits and plant tours. The three have studied and observed the application of the mapping tool in different environments―both in Japan as MIFC and in Western countries that adopted the mapping tool as VSM [12] . The three different researchers reviewed the interview transcripts and analyzed the data. Data analysis included reading all the collected data and sharing the different field notes and documents received. Multiple clarifications of information between the researchers took place before deciding to set a question for the following visit. All the data from the semi-structured and unstructured interviews, as well as observations, were compared to secure interviewees’ impartiality and objective analysis.
The researchers performed four scheduled visits. The first two visits represented preliminary investigations. One of the coauthors interviewed the president and senior managers of supplier A about their kaizen activities and general usage of MIFC during the first visit. The coauthor then visited supplier B, the parent company of supplier A, to establish the strategic roles of supplier A in the group, and verified that MIFC was used group-wide. The subsequent two visits comprised the main research. The agenda for each of the visits included an interview and a plant tour. All interviews were recorded, and insights from the plant tours were written in field notes; all content was transcribed. The visits started with a semi-structured interview, followed by a plant tour with an unstructured interview on the production floor while observing the production lines and visiting the relevant meeting points for kaizen activities. The researchers assessed the visual information on display and clarified unclear facts described by management during the preceding semi-structured interview. Each visit was finalized with a briefing session to discuss additional questions, clarify doubts from the observed operations, and close the visit. Each of the visits had an average duration of three hours.
On the first visit, senior management team members presented the history and business profile of the company. One of the members, who collaborated with the researchers during those visits, was directly involved in the design and deployment of the current CI program of the organization. Semi-structured questions, therefore, provided the advantage of gathering knowledge from dual perspectives, namely that of creator and implementer.
The first visit was focused on the KPIs that are used to monitor production lines, CI, and training programs. The focus then shifted to the utilization of MIFC, kaizen tools, and techniques other than MIFC, as well as the company’s collaboration with their group, shared best practices, support for production operations, and the launch of production lines or production systems within the group.
The second visit followed approximately three months after the first, once the information and data gathered during the previous visit (charts, metrics, and visual aids, mapping instructions) were processed and analyzed. The analysis generated more questions and discussion points to focus on, and assisted with preparation of more pointed questions that likewise facilitated the research team’s understanding of the supplier’s production system model.
The questions on the second visit related to the MIFC the company is employing, which is a hybrid model developed by one of the interviewees. Supplier A’s model emerged from TPS techniques and from MIFC mapping principles learned directly from Toyota. The researchers aimed to study the application of the model, training, and integration of the model into the daily operations.
The case of supplier A allowed the researchers to exemplify how the original mapping technique, learned directly from Toyota, is applied in an environment similar to where it was developed (the same national culture and employees with similar thinking and customs), and how the users have adapted it to the company’s needs. The authors sent the manuscript to supplier A for review and identification of any inaccuracies, and to obtain permission for publication.
4. Case Analysis and Discussion
In this section, the manner in which supplier A has adopted and adapted the mapping tool MIFC to its particular needs is explained―instead of using it merely as a tool, the supplier has managed to transform the organization and develop their CI model, which is continually adapted and improved.
4.1. Company Background
Supplier A is a subsidiary of a major first tier automotive supplier and has a satellite plant producing body and engine components. It also produces semiconductors and LCD manufacturing equipment. This research considers empirical data obtained mostly from their automotive door check production line. A door check is a sub-assembled component that controls the closing and opening of a car’s door by holding the door with a small arm.
This particular line has been used as a model line for the introduction of CI practices and training around lean manufacturing in the organization. The specific reason why this area was chosen (according to management) has to do with the simplicity of the processes in the door check production line, and ease of teaching by using this as a base case. In addition, the supplier’s characteristics allowed for the movement or relocation of any machines or equipment, if required. The door check production line consists of metal part pressing, plastic part injection, and assembly. Technical specifications of door checks differ per vehicle. Even within the same vehicle, there are slight differences between the front and rear doors. These technical features prompt supplier A to address a wide variety of the specifications through frequent setup changes.
4.2. Supplier a Material and Information Flow Chart Compared with Traditional Value Stream Mapping
Supplier A actively employs VSM. This supplier learned the tool’s principles directly from Toyota. Therefore, supplier A refers to the tool as MIFC. However, the tool as they use is an altered version of the approach known in Western countries. Supplier A has developed their mapping protocol with the proper chart (Figure 1) and formats linked to it. They explained that the tool is a means to an end, which in their case is to apply TPS―what would be called a lean production system in the West. MIFC is also a way to assess an employee’s knowledge of the processes and is used as a means of training people.
Another important fact to discuss on supplier A’s particular protocol around MIFC is the future state. Instead of creating a future state, as considered in VSM, “future goals” are established as a type of blueprint that contains entire goals per

Figure 1. Material and information flow chart components for supplier A.
process. Each one of the processes has future goals sectioned into two phases (medium-term goals and long-term goals), with specific metrics associated with each of them. Teams determine the phases; the members of such teams belong to different areas, and they work together to establish the goals. Starting from downstream to upstream, moving backward as they establish the future goals, and reaching consensus and agreements of all parties involved in the process, the goals are set with an ultimate objective in mind: “achieve one-piece flow to the maximum level”. In contrast with the traditional VSM approach, a future state represents for this supplier a gradual progression that will have two different stages from the start. At first, it may seem that not much emphasis is placed on creating a “future state” by definition, because the greater emphasis is on developing the most accurate version of the “current state”, while training individuals and taking short-term actions. The supplier sees this practice as part of having a solid basis on which to build further improvements. For supplier A, developing employees with substantial training and practical experience is a warranty that improvement will happen without a future state map.
Table 1 compares the particular method of this supplier with the traditional VSM by [12] . By examining this chart, we may think that the methods differ to such an extent that they refer to completely different techniques. Nevertheless, the basics are highly similar; this is not a surprise, considering that both learned the technique directly from Toyota. MIFC for supplier A is a more detailed analysis of the production floor that requires a higher level of understanding of the production processes by the person who intends to create the chart. Table 1 considers nine different characteristics, which link to the principal elements of VSM. First, the selection of a product family is the starting point. Second, is necessary to stress that, even though supplier A has the same approach as VSM, the

Table 1. Comparison of the general characteristics of VSM and MIFC at supplier A.
emphasis is placed on gradually performing the mapping of the whole plant as a means for the creator(s) to gain knowledge of all the processes and detect problems along the complete value stream. The organizational levels of the employees performing the mapping for supplier A is lower than those followed for VSM; management members merely serve as support and trainers. The people who do the work are the owners of the tool. The third characteristic is the information volume. Compared with VSM, MIFC requires a significantly higher level of information-gathering and entails more data collection on each resource; it comprises a process in which it is not possible to specify the total amount of time required to develop the chart. At this moment, supplier A was not able to provide a reliable time frame; they stated that it depends on the creator’s expertise and the complexity of the processes that are analyzed at each time.
In Figure 1, MIFC is exemplified for supplier A. The chart contains fifteen different numbered elements, and data components are contained in the boxes. Some of the data components are common with VSM (e.g., CT, bottlenecks, set-up times, man-hours, demand, LT, etc.), while others are particular to MIFC (e.g., delivery frequency, form of packages, location codes, supermarket arrangements, processing methods, production line codes, transportation units, etc.). This provides a better idea of the information volume that is required when filling in the chart.
The sequence of the fifteen elements is illustrated exactly as found in supplier A’s MIFC maps (both in their instruction sheet and in their current maps) at the moment of our visits. Each element recalls at least four sub-elements, which are information and data that describe each element. The creator of the protocol determined the sub-elements by assessing his acquired knowledge with practical experience. Elements number eight and number nine in Figure 1 are the most comprehensive and recall around sixteen sub-elements each. For instance, element number eight refers to “process” and contains sub-elements such as processing time, units, line code, CT, bottleneck CT, setup, frequency, etc.; and element number nine, which refers to “materials handling,” contains sub-elements such as transportation method, transportation equipment, transportation unit, timing, method of supply, form of package, location codes, etc. These examples provide a better idea of the information volume that is required when filling in the chart.
The level of detail is remarkably high; an example of the detail is found in elements six, nine, and ten, which require measuring the width and depth of locations and containers. In this sense, we can say supplier A goes a step ahead, gathering data that can be used not only to assess and understand their current processes, but can also be employed to redesign their material distribution and replenishment systems. The only element not fully present in MIFC compared with VSM is the LT line at the bottom of the map. As we will mention later, it is only calculated at certain points in time; it is a dynamic element, the rest of them are mandatory and necessary to understand the functioning of the system and how the flows integrate.
A differentiating aspect between MIFC and VSM is the unit used for measuring improvement; supplier A does not have fixed measurement indexes and selects appropriate ones depending on the focus of their improvement activities. For instance, at the time of the visits, supplier A was considering inventories (purchased goods, work-in-process, and finished goods) and man-hours, each of which could be linked to an economic measure of value; in VSM, a common metric is LR. For VSM the unit is time, and there is always an LT indicated on the created map. However, the LT or time unit on the MIFC map is not required in every case―it is calculated at specific points when needed. Supplier A stated that this is due to the dynamic aspect of the processes, rather than because they do not care about production flow.
The next characteristic, the future state for supplier A, consists of two levels, namely, medium- and long-term goals. Each goal phase is set through consensus by a team from different areas in the organization, which secures the commitment in the long run. This supports the latest description of a future-state value stream map by [4] , that is, a challenge that focuses and aims individual improvement efforts toward a shared breakthrough goal.
The downside for MIFC is the time required to develop a full map; supplier A does not use any software as an auxiliary for the steps related to the creation of MIFC and all the tasks are manual. Under lean principles, this could be in the category of a non-value-adding practice or waste, but for supplier A it is considered as a “learning by doing” approach.
An outstanding difference, not specified in Table 1, is that MIFC for supplier A is seen not as a tool itself, but as a means to deliver knowledge and training on TPS and lean principles; this is not the case for VSM.
When [2] found a negative effect of VSM on the performance of organizations, they highlighted that a possible explanation for this might be that the organizations studied have not been able to obtain such benefits due to implementation, management and/or sustainability problems with lean methods. Our study supports their explanation and the reasoning behind it. In their study, however, when they mention JIT as one of the five lean methods analyzed, they seemed to disregard that the objective of lean is to make a production system as close as possible to JIT, hence producing just what is needed when it is needed, as is the case of supplier A striving to achieve TPS.
Most of the weaknesses highlighted for VSM when analyzing applicability [21] [22] relate to this study case and MIFC. Nevertheless, some are excludable, because when applying MIFC, supplier A considers factors such as container size and trip frequency between operations and can measure value by tracking inventories on their map.
Our research agrees with the new TPS representation by [3] ―a multilevel mono-pillar in which they show an interaction between the main lean tools. Their model demonstrates the relationship between the complexity of production, techniques and their purpose, theory, vision, and philosophy behind each one of the levels. Nonetheless, VSM was portrayed merely as a tool to reveal inefficiencies, but in our research, we found that mapping, in this case, MIFC, can also be used as a way to achieve TPS and train people, not just act as a tool to diagnose and reveal waste. This could be due to their work referring particularly to Western VSM; in this instance, it gives validation as to why MIFC should also be studied.
4.3. Usage of Material and Information Flow Chart and Kaizen Processes
From management experience, supplier A stated that there are numerous ways to introduce TPS. For this supplier, MIFC represented ways to introduce and trigger kaizen activities. Depending on the context, other organizations may require a different tool. For example, in some cases, a simple or more basic approach such as 5S is sufficient, while in other cases a full kaizen analysis is required, which could lead to the use of more tools to help in problem-solving. MIFC for supplier A could be considered in the manner shown in Figure 2; MIFC is used to train people as a means to achieve TPS.
Figure 2 describes four categories, introduced at different points of time in the organization’s evolution. Categories from bottom to top are: first, “training
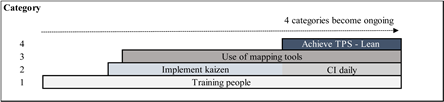
Figure 2. Categories in achieving lean.
people” to start employees on their journey; later on (category two), kaizen projects can be implemented to boost CI on a daily basis. The goal is to add value with incremental daily improvements―not just to respond to crises with standalone kaizen events that require more intense efforts. The introduction of category three takes place when kaizen implementations are already ongoing; mapping tools aid in the diagnosis and problem-solving. Category four represents the mature level at which the organization has mastered the knowledge around the three previous categories, and works with TPS and lean principles. The organization still recognizes that the journey is endless, because it is not problem-free, but is more resilient and eager to learn when problems appear.
4.4. Training
Training is an ongoing activity from the beginning of operations. The journey starts with the training of employees in the basic principles and know-how of initiating a kaizen implementation or improvement activities. Once employees have reached the desired level of understanding of the mapping tool (in this case MIFC), they start to use the tool and continue the implementation of improvements. As time passes, this becomes a habit, which later turns into a routine that allows the supplier to reach the desired lean level. Once they reach a certain lean level, the four categories are functioning at an ongoing pace; training people and daily improvements with the help of MIFC becomes a continuous path to a higher lean level.
Supplier A implements small group activities through so-called “voluntary study groups,” of which the development and training of employees is the core objective. These groups are in charge of improvement projects that result from the application of MIFC. Problems or waste areas are called challenges, which become projects to be addressed by teams. Each team member―leaders as well as operators―has a preset training journey to follow, along with the completion of the project to which he or she is assigned by the direct supervisor. In this way, the project becomes a practical means of knowledge acquisition. The team members learn by doing: answers are not given by leaders; instead, they are encouraged to seek answers by observation and experimentation.
The knowledge that employees need to address the challenges that occur are obtained gradually, from basic to complex; people cannot move to the next stage until they are ready, according to their superiors, and before their required qualifications have been approved. The meaning of the statement “being ready” equals mastering by understanding. For instance, MIFC demands the ability to gather data to create a process profile, a chart containing line information: CT, machine cycle time (MCT), inventory, shifts, etc. Employees must be able to gather that information before they can start thinking about creating an MIFC map. Approximately 50 percent of supplier A’s employees on the door check production line can currently create the line profile. It took approximately five years to achieve that level of understanding. Supplier A trusts the competent decision-making of their employees, as knowledge preparation and projects occur in parallel.
5. Conclusions
The study considers that mapping tools play a significant role in transformation, and therefore aims to understand their role in lean transformations and CI environments. Practitioners can benefit from experimentation and further application thereof in their environments. By assessing the central research question, this paper provides a different perspective to enhance the understanding of readers who may have preconceived ideas about mapping efforts with VSM, based on learning from Western sources. It is evident in the case of Toyota’s MIFC and VSM that the conventional and predominant understanding of VSM comes from studying the principles of a digested version of the tool as presented by Western researchers.
The case of supplier A provides a new perspective, aiming to modify the practitioner’s understanding of mapping tools and VSM particularly. It shows that even in a non-Western environment, tool adaptation was required. Supplier A used the basics of an existing tool to develop an internal protocol that might or might not enable other organizations to accomplish the same improvements.
MIFC do not require a future state as such; it is a progressive process that is achieved through small and gradual improvements that are determined by the workers. The improvements arise when there is a complete understanding of the current state, with empowerment to take action. The rationale behind this frame is that it becomes natural for workers to know the value that their work provides and to employ correct decision-making that complies with desirable goals or a desirable future state (by management).
This study found that knowledge transference is a critical component, as are the systems in place to develop workers’ routines associated with learning techniques, tools, or any internal protocols. In the case of supplier A, “the voluntary study group” protocol was created to ensure this essential component. Without it, the CI plan and MIFC protocol may not be functional.
Considering the research question of this study, the value can be measured in many different ways. Our study suggests that each organization should determine the most suitable data to track according to their needs and goals―for example, supplier A currently tracks man-hours and inventories (purchased goods, WIP, and finished goods). All VSM variants presented in this paper can function with time as a base measurement. The tools help to track the data that the organization selects, but the required degree of detail varies between tools.
Western practitioners seem to be more advanced regarding the technology linked to the tools, but their pursuit of attaining tool simplicity can lead to more abstract comprehension, which can sometimes result in a misunderstanding. In that sense, being lean becomes less strenuous, but not simple. On the other hand, in a Japanese environment, practitioners may opt for “simple,” even if it requires more effort. A tangible example is performing manual tasks rather than using technology for repetitive activities such as maps, physical counting of parts, and daily production planning, to mention the most common that could be observed to date. An understanding of the reasoning behind the decision to keep those methods provides the opportunity to interpret the manner in which practitioners respond to these needs.
Previous literature and practical work have strong tool-based beliefs; the cases attained a certain level of improvement, but did not seek to improve the system flow as a whole―to achieve one-piece flow. Therefore, it is important to present research that helps understand how the organization’s approach with VSM or MIFC directly affects the level of success in the implementation of TPS, lean, or JIT systems.
The main contribution of this paper is that it provides a divergent perspective about mapping tools and an understanding of the utilization of an alternative version of MIFC. With an understanding of the tool’s core knowledge, not only researchers, but also practitioners will lead organizations to reassess their current measurement systems and choose more apposite ones.
This research has some limitations, which are related to the definition of the research method. This points to opportunities for future work. A single case was used, and the research question has not been applied in the context of a Japanese supplier that is actively employing the VSM in its Western version or another variant. The intention would be to study whether a different tool or no tool is in place, as well as to identify the metric(s) for tracking performance. Based on the analysis of more cases, future work would be dedicated to developing a simple calculation method for metrics determination that can be integrated into mapping, thus simplifying the practitioner’s work.
Acknowledgements
The authors are very grateful for the cooperation of the managers of supplier A and supplier B. We would like to thank Martin Schroeder for his constructive comments, which improved the manuscript significantly.
This work was supported by JSPS KAKENHI (Grant Number JP17K03933).
Cite this paper
Chavez, Z., Mokudai, T. and Uyama, M. (2018) Divergence between Value Stream Mapping Western Understanding and Material and Information Flow Chart Principles: A Japanese Automotive Supplier’s Perspective. Journal of Service Science and Management, 11, 219-241. https://doi.org/10.4236/jssm.2018.112016
References
- 1. Toivonen, T. (2015) Continuous innovation—Combining Toyota Kata and TRIZ for Sustained Innovation. Procedia Engineering, 131, 963-974.
- 2. Karim, A. and Zaman, K. (2013) A Methodology for Effective Implementation of Lean Strategies and Its Performance Evaluation in Manufacturing Organizations. Business Process Management Journal, 19, 169-196. https://doi.org/10.1108/14637151311294912
- 3. Rüttimann, B. and Stöckli, M. (2016) Going beyond Triviality: The Toyota Production System-Lean Manufacturing beyond Muda and Kaizen. Journal of Service Science and Management, 9, 140-149. https://doi.org/10.4236/jssm.2016.92018
- 4. Rother, M. and Aulinger, G. (2017) Toyota Kata Culture. Building and Organizational Capability and Mindset though Kata Coaching. McGraw Hill Education, New York.
- 5. Bhasin, S. and Burcher, P. (2005) Lean Viewed as a Philosophy. Journal of Manufacturing Technology Management, 17, 56-72. https://doi.org/10.1108/17410380610639506
- 6. Detty, R.B. and Yingling, J.C. (2000) Quantifying Benefits of Conversion to Lean Manufacturing with Discrete Event Simulation: A Case Study. International Journal of Production Research, 38, 429-445. https://doi.org/10.1080/002075400189509
- 7. Karlsson, C. and Åhlström, P. (1996) Assessing Changes towards Lean Production. International Journal of Operations & Production Management, 16, 24-41. https://doi.org/10.1108/01443579610109820
- 8. Motwani, J. (2003) A Business Process Change Framework for Examining Lean Manufacturing: A Case Study. Industrial Management & Data Systems, 103, 339-346. https://doi.org/10.1108/02635570310477398
- 9. Martinez, A. and Perez, M. (2001) Lean Indicators and Manufacturing Strategies. Journal of Operations & Production Management, 21, 1433-1451. https://doi.org/10.1108/01443570110407436
- 10. Shah, H.A. (2007) A Role Delineation Study for the SME. PhD Thesis, Eastern Michigan University, Michigan.
- 11. Srinivasaraghavan, J. and Allada, V. (2006) Application of Mahalanobis Distance as a Lean Assessment Metric. The International Journal of Advanced Manufacturing Technology, 29, 1159-1168. https://doi.org/10.1007/s00170-005-0004-2
- 12. Rother, M. and Shook, J. (1998) Learning to See: Value Stream Mapping to Create Value and Eliminate Muda. Lean Enterp. Inst. Brookline. Lean Enterprise Institute, Cambridge.
- 13. Williams, R., Bertsch, B., Van Der Wiele, A., Van Iwaarden, J. and Dale, B. (2006) Self-Assessment against Business Excellence Models: A Critique and Perspective. Total Quality Management and Business Excellence, 17, 1287-1300. https://doi.org/10.1080/14783360600753737
- 14. Rivera, L. (2006) Inter-Enterprise Cost-Time Profiling. PhD Thesis, Virginia Polytechnic Institute and State University, Blacksburg.
- 15. Chavez, Z. and Mokudai, T. (2015) Putting Numbers to Value: Going Simplistic for Reaching Lean Manufacturing. Lecture Notes in Engineering and Computer Science, Hong Kong, 18-20.
- 16. Serrano, I. (2007) Análisis de la aplicabilidad de la técnica ValueStreamMapping en el rediseño de sistemas productivos. PhD Thesis, Universitat de Girona.
- 17. Kuhlang, P., Edtmayr, T. and Sihn, W. (2011) Methodical Approach to Increase Productivity and Reduce Lead Time in Assembly and Production-Logistic Processes. CIRP Journal of Manufacturing Science and Technology, 4, 24-32. https://doi.org/10.1016/j.cirpj.2011.02.001
- 18. Seth, D. and Gupta, V. (2005) Application of Value Stream Mapping for Lean Operations and Cycle Time Reduction: An Indian Case Study. Production Planning and Control, 16, 44-59. https://doi.org/10.1080/09537280512331325281
- 19. Romero, L.F. and Arce, A. (2017) Applying Value Stream Mapping in Manufacturing: A Systematic Literature Review. IFAC-Papers on Line, 1075-1086. https://doi.org/10.1016/j.ifacol.2017.08.385
- 20. Toivonen, T. and Siitonen, J. (2016) Value Stream Analysis for Complex Processes and Systems. Procedia CIRP, 39, 9-15.
- 21. Braglia, M., Carmignani, G. and Zammori, F. (2006) A New Value Stream Mapping Approach for Complex Production System. International Journal of Production Research, Taylor & Francis: STM, Behavioural Science and Public Health Titles, 44 3929-3952. https://doi.org/10.1080/00207540600690545
- 22. Khaswala, Z.N. and Irani, S.A. (2001) Value Network Mapping (VNM): Visualization and Analysis of Multiple Flows in Value Stream Maps. Proceedings of the Lean Management Solutions Conference, St Louis, 10-11 September 2001, 1-18.
- 23. Fontanini, P. and Picchi, F.A. (2004) Value Stream Macro Mapping—A Case Study of Aluminum Windows for Construction Supply Chain. Proceedings of the 12th Annual Conference of the International Group for Lean Construction, Elsinore, 576-587.
- 24. Jones, D., Womack, J. and Brunt, D. (2011) Seeing the Whole Value Stream. Lean Enterprise Institute, Inc., Cambridge.
- 25. Chavez, Z. (2012) Redesign of a Production System of the Medical Industry through Mapping Techniques. Master’s Thesis, Sonora University, Hermosillo.
- 26. Meudt, T., Metternich, J. and Abele, E. (2017) Value Stream Mapping 4.0: Holistic Examination of Value Stream and Information Logistics in Production. CIRP Annals—Manufacturing Technology, 66, 413-416. https://doi.org/10.1016/j.cirp.2017.04.005
- 27. Gunasekaran, A. and Kobu, B. (2007) Performance Measures and Metrics in Logistics and Supply Chain Management: A Review of Recent Literature (1995-2004) for Research and Applications. International Journal of Production Research, 45, 2819-2840. https://doi.org/10.1080/00207540600806513
- 28. Gracanin, D., Buchmeister, B. and Lalic, B. (2014) Using Cost-Time Profile for Value Stream Optimization. Procedia Engineering, 69, 1225-1231.
- 29. Ruiz-de-Arbulo-Lopez, P., Fortuny-Santos, J. and Cuatrecasas-Arbos, L. (2013) Lean Manufacturing: Costing the Value Stream. Industrial Management & Data Systems, 113, 647-668. https://doi.org/10.1108/02635571311324124
- 30. Maskell, B. and Baggaley, B. (2003) Practical Lean Accounting: A Proven System for Measuring and Managing the Lean Enterprise. Productivity Press, Boca Raton.
- 31. Chavez, Z. and Mokudai, T. (2016) Mapping Tools Selection towards Lean Transformation in Manufacturing Environments. Euroma 23rd Conference, Norway, 17-22 June 2016, 1-10.
- 32. Ruiz, P. and Díaz, P. (2008) Alineando los costes con la producción lean: Lean Accounting. 2nd International Conference on Industrial Engineering and Industrial Management, Burgos, 3-5 September 2008, 1152-1162.
- 33. Álvarez, R., Calvo, R. and Peña, M.M. (2009) Redesigning an Assembly Line through Lean Manufacturing Tools. International Journal of Advanced Manufacturing Technology, 43, 949-958. https://doi.org/10.1007/s00170-008-1772-2
- 34. Martin, K. and Osterling, M. (2013) Metrics-Based Process Mapping: Identifying and Eliminating Waste in Office and Service Processes. 2nd Edition, CRC Press, Boca Raton.
- 35. Rüttimann, B.G. and Stöckli, M.T. (2016) Lean and Industry 4.0-Twins, Partners, or Contenders? A Due Clarification Regarding the Supposed Clash of Two Production Systems. Journal of Service Science and Management, 9, 485-500. https://doi.org/10.4236/jssm.2016.96051
- 36. Yin, R. (2013) Case Study Research: Design and Methods. 5th Edition, Sage Publications, London.
- 37. Sousa, R. (2003) Linking Quality Management to Manufacturing Strategy—An Empirical Investigation of Customer Focus Practices. Journal of Operations Management, 21, 1-18. https://doi.org/10.1016/S0272-6963(02)00055-4
- 38. Patton, M.Q. (2002) Qualitative Research and Evaluation Methods. Sage Publications, Thousand Oaks.