Journal of Service Science and Management
Vol.6 No.5A(2013), Article ID:41519,17 pages DOI:10.4236/jssm.2013.65A004
Recommender Systems as a Mobile Marketing Service
![]()
1University of Missouri-St. Louis, St. Louis, USA; 2Naval Postgraduate School, Monterey, USA; 3Voltari, Inc., New York, USA.
Email: krideld@umsl.edu, *drdolk@nps.edu, david.castillo@voltari.com
Copyright © 2013 Donald J. Kridel et al. This is an open access article distributed under the Creative Commons Attribution License, which permits unrestricted use, distribution, and reproduction in any medium, provided the original work is properly cited. In accordance of the Creative Commons Attribution License all Copyrights © 2013 are reserved for SCIRP and the owner of the intellectual property Donald J. Kridel et al. All Copyright © 2013 are guarded by law and by SCIRP as a guardian.
Received October 14th, 2013; revised November 13th, 2013; accepted December 11th, 2013
Keywords: Marketing Service; Predictive Analytics; Recommender Systems; Collaborative Filtering; Similarity Measures; Euclidean Distance; Cosine Distance; Pearson Correlation; Recommender System Generator; Adaptive Modeling; Customer Targeting
ABSTRACT
Recommender systems (RSs) have become a familiar artifact in cyberspace as a vehicle for increasing revenues while deepening customer loyalty and satisfaction. Typically RS are developed in house by companies with a large product line and customer base. However, the structure of RS is often straightforward, and effective systems can be developed at relatively low cost, and thus offered as a marketing service. We discuss the anatomy of a specific recommender system designed for a telecommunication carrier which uses predictive analytics in the form of collaborative filtering techniques to recommend products to users. Collaborative filtering (CF) is based upon the premise that users who have purchased a particular product will have similar preferences to other users who also purchased the product. We discuss and compare three versions of a CF-based recommender system based upon customer purchase history, customer browsing history, and user segments respectively. The results in terms of increased sales suggest that RS offer substantial value as a mobile marketing service. We suggest ways in which RS can be generalized into RS generators for more rapid development and deployment. We then invert the RS perspective from product-centric to user-centric and suggest how this would work in customer targeting for mobile advertising campaigns. We conclude that RS in the largest sense are heavily model-feedback in nature and require increasingly sophisticated automated modeling and predictive analytics capabilities layered on a scalable big data infrastructure.
1. Introduction
A research domain of particular relevance to the confluence of computer science, information system, and marketing disciplines is the design of service systems for mobile applications. Recommender systems (RSs) constitute a class of service systems which provide suggestions for items related to various user-specific decision-making processes, such as what product(s) to buy, where to dine, what movies to watch, or what routes to take to reach a destination efficiently. Recommender systems have become commonplace on Internet sites and especially on mobile applications; almost everyone with a laptop, PC or mobile phone is familiar with Amazon’sTM book recommender system, Netflix’TM movie recommender [1], and/or restaurant advisory services such as OpenTableTM and TripAdvisorTM.
The RS literature is vast (see, e.g. [2-6]), and RSs continue to be a topic of a very active research, especially with the proliferation of mobile phones and their penetration to millions of users and potential consumers. Although much attention has been paid to numerous RS technologies and mobile applications, very little has appeared in the literature about deploying RS as a marketing service in and of itself. It appears that RSs are often very application-specific if not proprietary, and therefore not typically designed for generalized usage across multiple domains. This unnecessarily limits their utility as service systems.
Many companies, especially larger companies, employ RS directly as a market service for the reasons shown in Table 1. However, smaller companies (e.g., small to medium size businesses (SMB)) who could profitably leverage this technology may not have sufficient resources to buy or develop such systems. A company that wishes to provide innovative services to their clients, who may in turn be other companies, might very well consider portable RSs in the form of software as a marketing service as a way to provide significant added value.
We have developed a general-purpose RS based upon predictive analytics and the use of automated modeling in model feedback loops [7]. The system contains data ingestion, off-line model development, and real-time scoring and filtering. Data ingestion flexibly allows for various data inputs:
• first-party data (from clients or customers of clients, e.g., purchase history, browse history, customer segments, customer usage and expenditures, etc.);
• second-party data (data collected directly from the Voltari1 eco-system, e.g., clicks, impressions, conversions, etc.);
• third-party data (demographic information, POIs, device information, etc.).
The ingestion process is running continuously as new data arrive.
Off-line analytics uses various forms of modeling (depending on specific RS requirements):
• collaborative filtering (CF);
• econometric models (logistic regression, multinomial logit, least squares regression, etc.);
• segmenting or clustering models (decision-trees, kmeans clusters, etc.);
The necessary modeling approaches will vary for various client needs. For example, for an application where there are a relatively few products and where these products are relatively “stable, a collaborative filtering technique is often employed. On the other hand, for ad-serving the “creative”, campaigns and clients change frequently. In this case, a richer modeling approach (econometrics and clustering) will be utilized. Off-line models are updating continuously; as models are refreshed, the real-time system (cache) is re-loaded to utilize the most recently updated models.
Real-time scoring must utilize the appropriate modeling scorecard, “build” necessary data to deploy the score card—that is “score”, and provide results very quickly. For example, in real time bidding (RTB) systems for advertisement serving where we have to decide if we want to bid, and if so, how much, the typical response rate has to be significantly less than 50 milliseconds.
Here, we will describe the first implementation of the generalized RS: a mobile service system, ReCo, for generating hybrid collaborative filtering recommender systems (RSs) for mobile market-places. Collaborative filtering (CF) is the most common approach employed by RS as we discuss in more detail in the next section. Our CF-driven RS combines purchase behavior, previous browsing behavior, and user segments into a hybrid system which can be used to augment a part of a firm’s current CRM process, especially with regard to customer and product targeting, and customer purchasing patterns.
The structure of the paper is as follows: we initially provide a brief overview of the RS literature and then describe in detail the anatomy of our CF-based ReCo application. We then evaluate customer purchasing history using our RS service that is an effective instrument in increasing customer purchase rates for a specific portfolio of telecommunication products. In the next two sections, we discuss how to migrate from the ReCo case to a more generalized architecture which allows reuse of RS in the form of a marketing service which can be leveraged by a company’s clients as well as the company itself, and then conclude by showing how this architecture can be adapted to a new generation of RS which implements sophisticated real-time customer targeting for mobile media marketing campaigns using automated econometric models. This advanced version of RS is based upon the same fundamental concepts which the simpler ReCo employs. In this paper, we will focus on the ReCo application which illustrates the basic underlying foundation for this class of decision support systems.
2. Brief Overview of RS
Recommender systems (RSs) employ various algorithmic strategies that provide suggestions for items related to various user-specific decision-making processes, such as what product(s) to buy, where to dine, what movies to
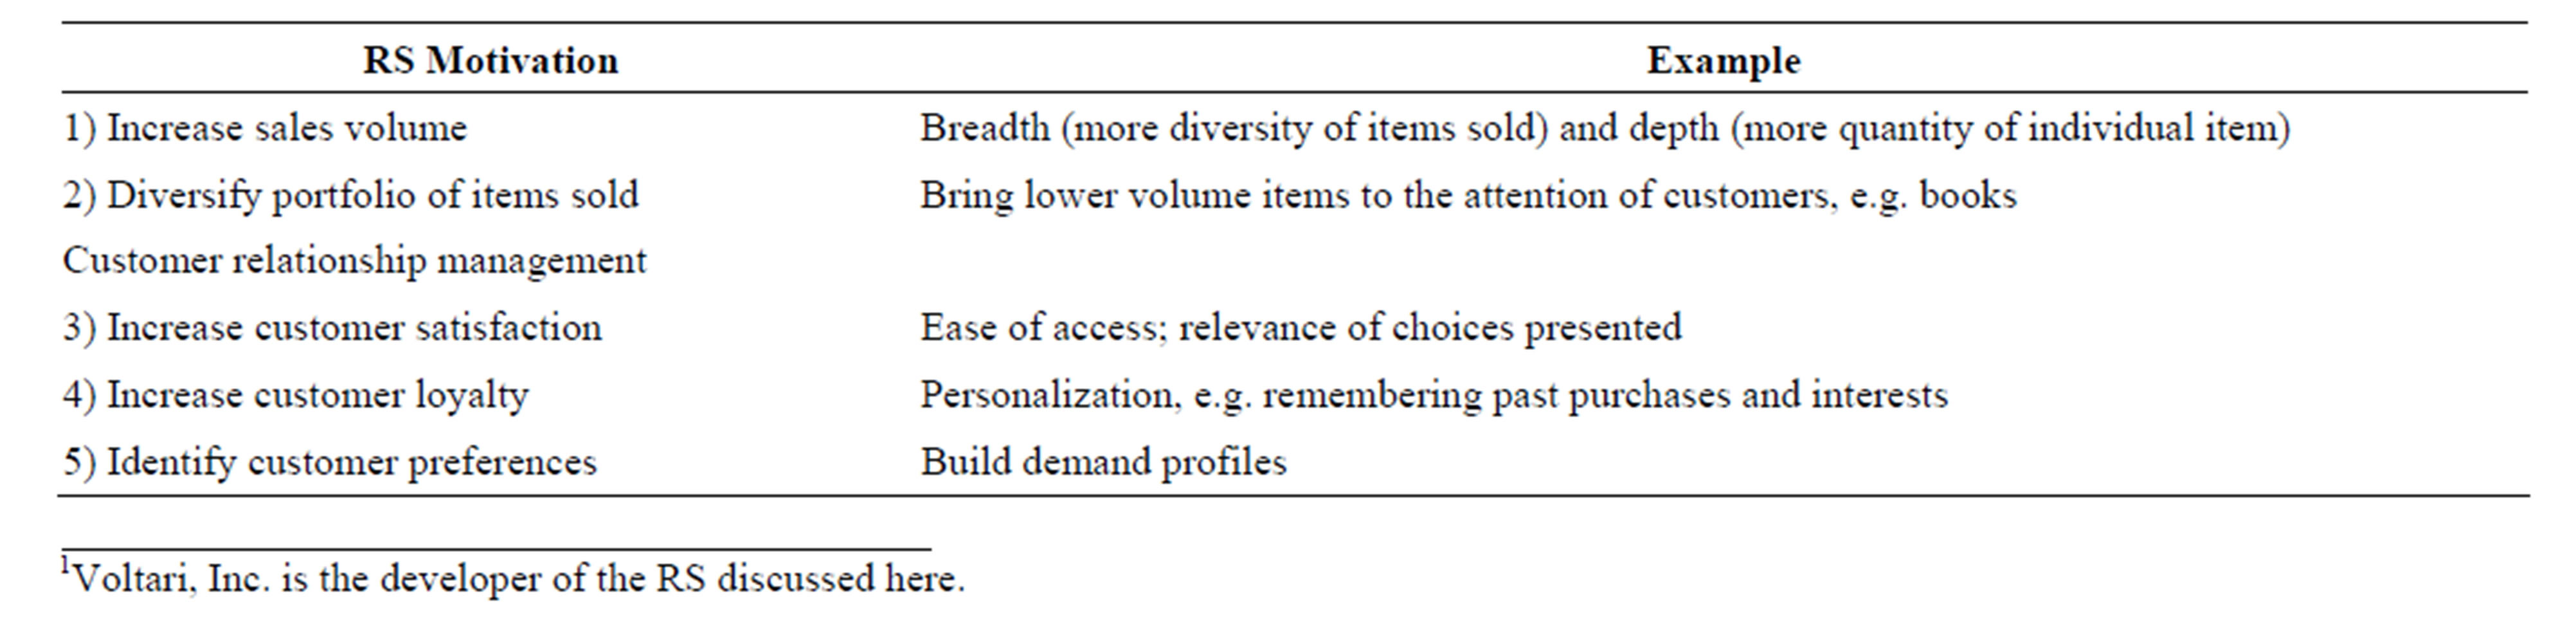
Table 1. Market service provider motivation for RS [2].
watch, or what routes to take to reach a destination efficiently. Depending upon the context, they can be thought of alternatively as electronic “word of mouth” sources (“here’s what other people are reading” as in Amazon), expert systems or advisors (e.g., what stocks or mutual funds to buy), marketing instruments (a list of available mobile phone plans for a particular vendor), search engines, and locator systems (“here’s where to find the closest AAA office”).
RSs are intended to help individuals filter the potentially overwhelming information available on relevant Web sites (Table 2). In their simplest form, recommendations are presented as personalized ranked lists of items which are predictions of products or services that best match a user’s preferences and constraints. The matching process must construct a database of user preferences from an array of possible sources: preferences explicitly expressed as in filling out a survey specifying ratings for products, implicitly inferred by interpreting user actions such as past purchases (it is common practice, for example, to treat “click throughs (CTs)” to a particular Web page as a proxy for user preference for the product(s) advertised on that page), and/or gathered from 3rd party (primarily demographic) data sources. Additionally, the system may have access to item-specific profile attributes such as product descriptions.
RS can be differentiated by the ways in which they manipulate the available data sources to identify potential matches between users and items. Conventional wisdom about the taxonomy of techniques differ slightly from author to author, but encompass primarily collaborative filtering (user-user), content-based (item-item), knowledge-based (user-item), community-based (user-user), and hybridization. There are not always distinct boundaries between these approaches, for example there are many hybridization approaches within the CF discipline as well as between CF and content-based.
2.1. Collaborative Filtering (CF)
Collaborative filtering is probably the most widely implemented and best understood technique. CF is a userbased, or user-user, form, which recommends to an individual user, items that other users with similar tastes liked in the past. CF is essentially item-agnostic, focusing instead upon users’ ratings of items rather than attributes of the items themselves. The main challenge in implementing CF is to define effective measures of similarity based upon the comparative ratings history of the users under consideration. We discuss some of these measures in more detail in the Section 3.
2.2. Content-Based
The item-based, or item-item, approach derives a user preference for an item based upon how the user rated similar items. In contrast to CF, content-based recommendation is based upon the availability of item descriptions in conjunction with a profile that assigns importance in the form of weights to these characteristics. This is a variation of multi-criteria decision-making models such as the Analytical Hierarchy Process [9] where users identify criteria and associated weights for various items or products in general which then can be used to generate a ranked list of preferences for specific instances of those items and products. As with CF, defining suitable similarity measures is of key importance in implementing this approach.
2.3. Knowledge-Based
Knowledge-based RS are used in applications where there is no prior, or else a very scant, purchasing history, e.g. if an individual wants to purchase an electronic reader. Absent such data, a more dynamic interaction between the user and RS is required to elicit user preferences manually.
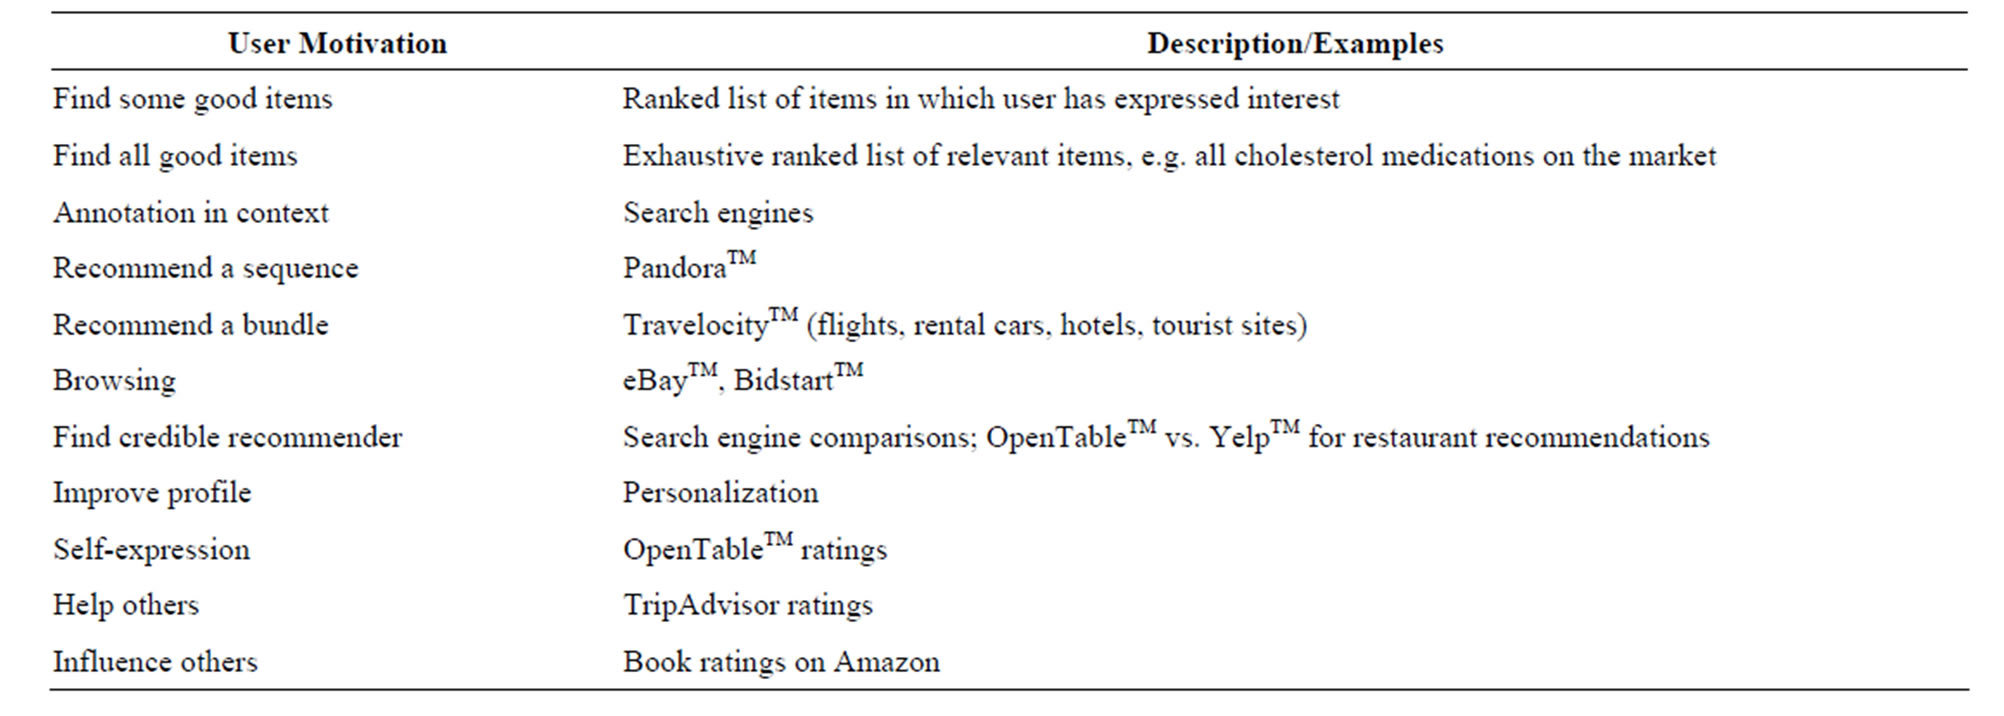
Table 2. Individual’s motivations for using RS [2,8].
2.4. Community-Based
Community-based RS are typically social network-driven based upon the premise that individuals are more likely to buy products which their friends have bought. Often termed social recommender systems, they are motivated by the realization that people might weight recommendations from their friends more highly than from similar, anonymous individuals. Community-based RS requires information about a user’s social network, for example, identifying friends and primary influencers. Research in this area is still in its infancy although gaining momentum in concert with the rabid interest in social network technology (see, e.g., [10,11]).
2.5. Hybridization
Hybridization is an attempt to combine the beneficial features of different approaches to improve the overall effectiveness of recommendations. [2] suggest general ways of integrating CF and content-based approaches that can be summarized roughly as monolithic, pipelining, and parallelization. Within the CF universe, there have been numerous attempts to combine CF approaches which use different similarity measures. Our focus in this article is solely on CF RS using hybridization of similarity measures which we present in the following section.
3. Anatomy of an RS
In this section we discuss the development of a specific recommender system, ReCo that we designed for a telecommunications carrier. This compact case study will highlight some of the main features of RS and illustrate how predictive analytics can be leveraged to provide a valuable marketing service for businesses. Since RS are typically applicationand client-specific, we investigate in the succeeding section ways to design RS generators which can accelerate the development and deployment of specific RS and thus enhance their value as a marketing service.
3.1. Telecommunication Carrier Application
The main objective of this project was to build a mobile-based recommender system marketing service for the client, a major telecommunications carrier, which would increase overall revenues, increase customer satisfaction, and deepen customer loyalty (Table 1, Rows 1, 3, and 4 respectively). This could be expressed in marketing terms as promoting up-sell and cross-sell and “sticky” behavior resulting in customers returning more often to the portal and purchasing more products. The types of products in this case are items such as songs, ringtones, ring-back tones and other apps which run on users’ feature phones.
3.2. Carrier ReCo RS
Figure 1 shows a high level schematic of how the recommendation environment functions. The RS analyzes subscriber information and displays personalized offers on the home page, within product pages as the user is browsing, and on the confirmation page that appears after a purchase. The engine analyzes both a user’s purchase history to dynamically display the highest scoring offers, and a user’s product purchase to dynamically display complementary offers. The engine also implements additional filters such as device compatibility so that no items are recommended inconsistent with the requesting device, previous user purchases so that items the user has already purchased are not included in the recommendation set, and accommodating customer requests to include or exclude specific top sellers.
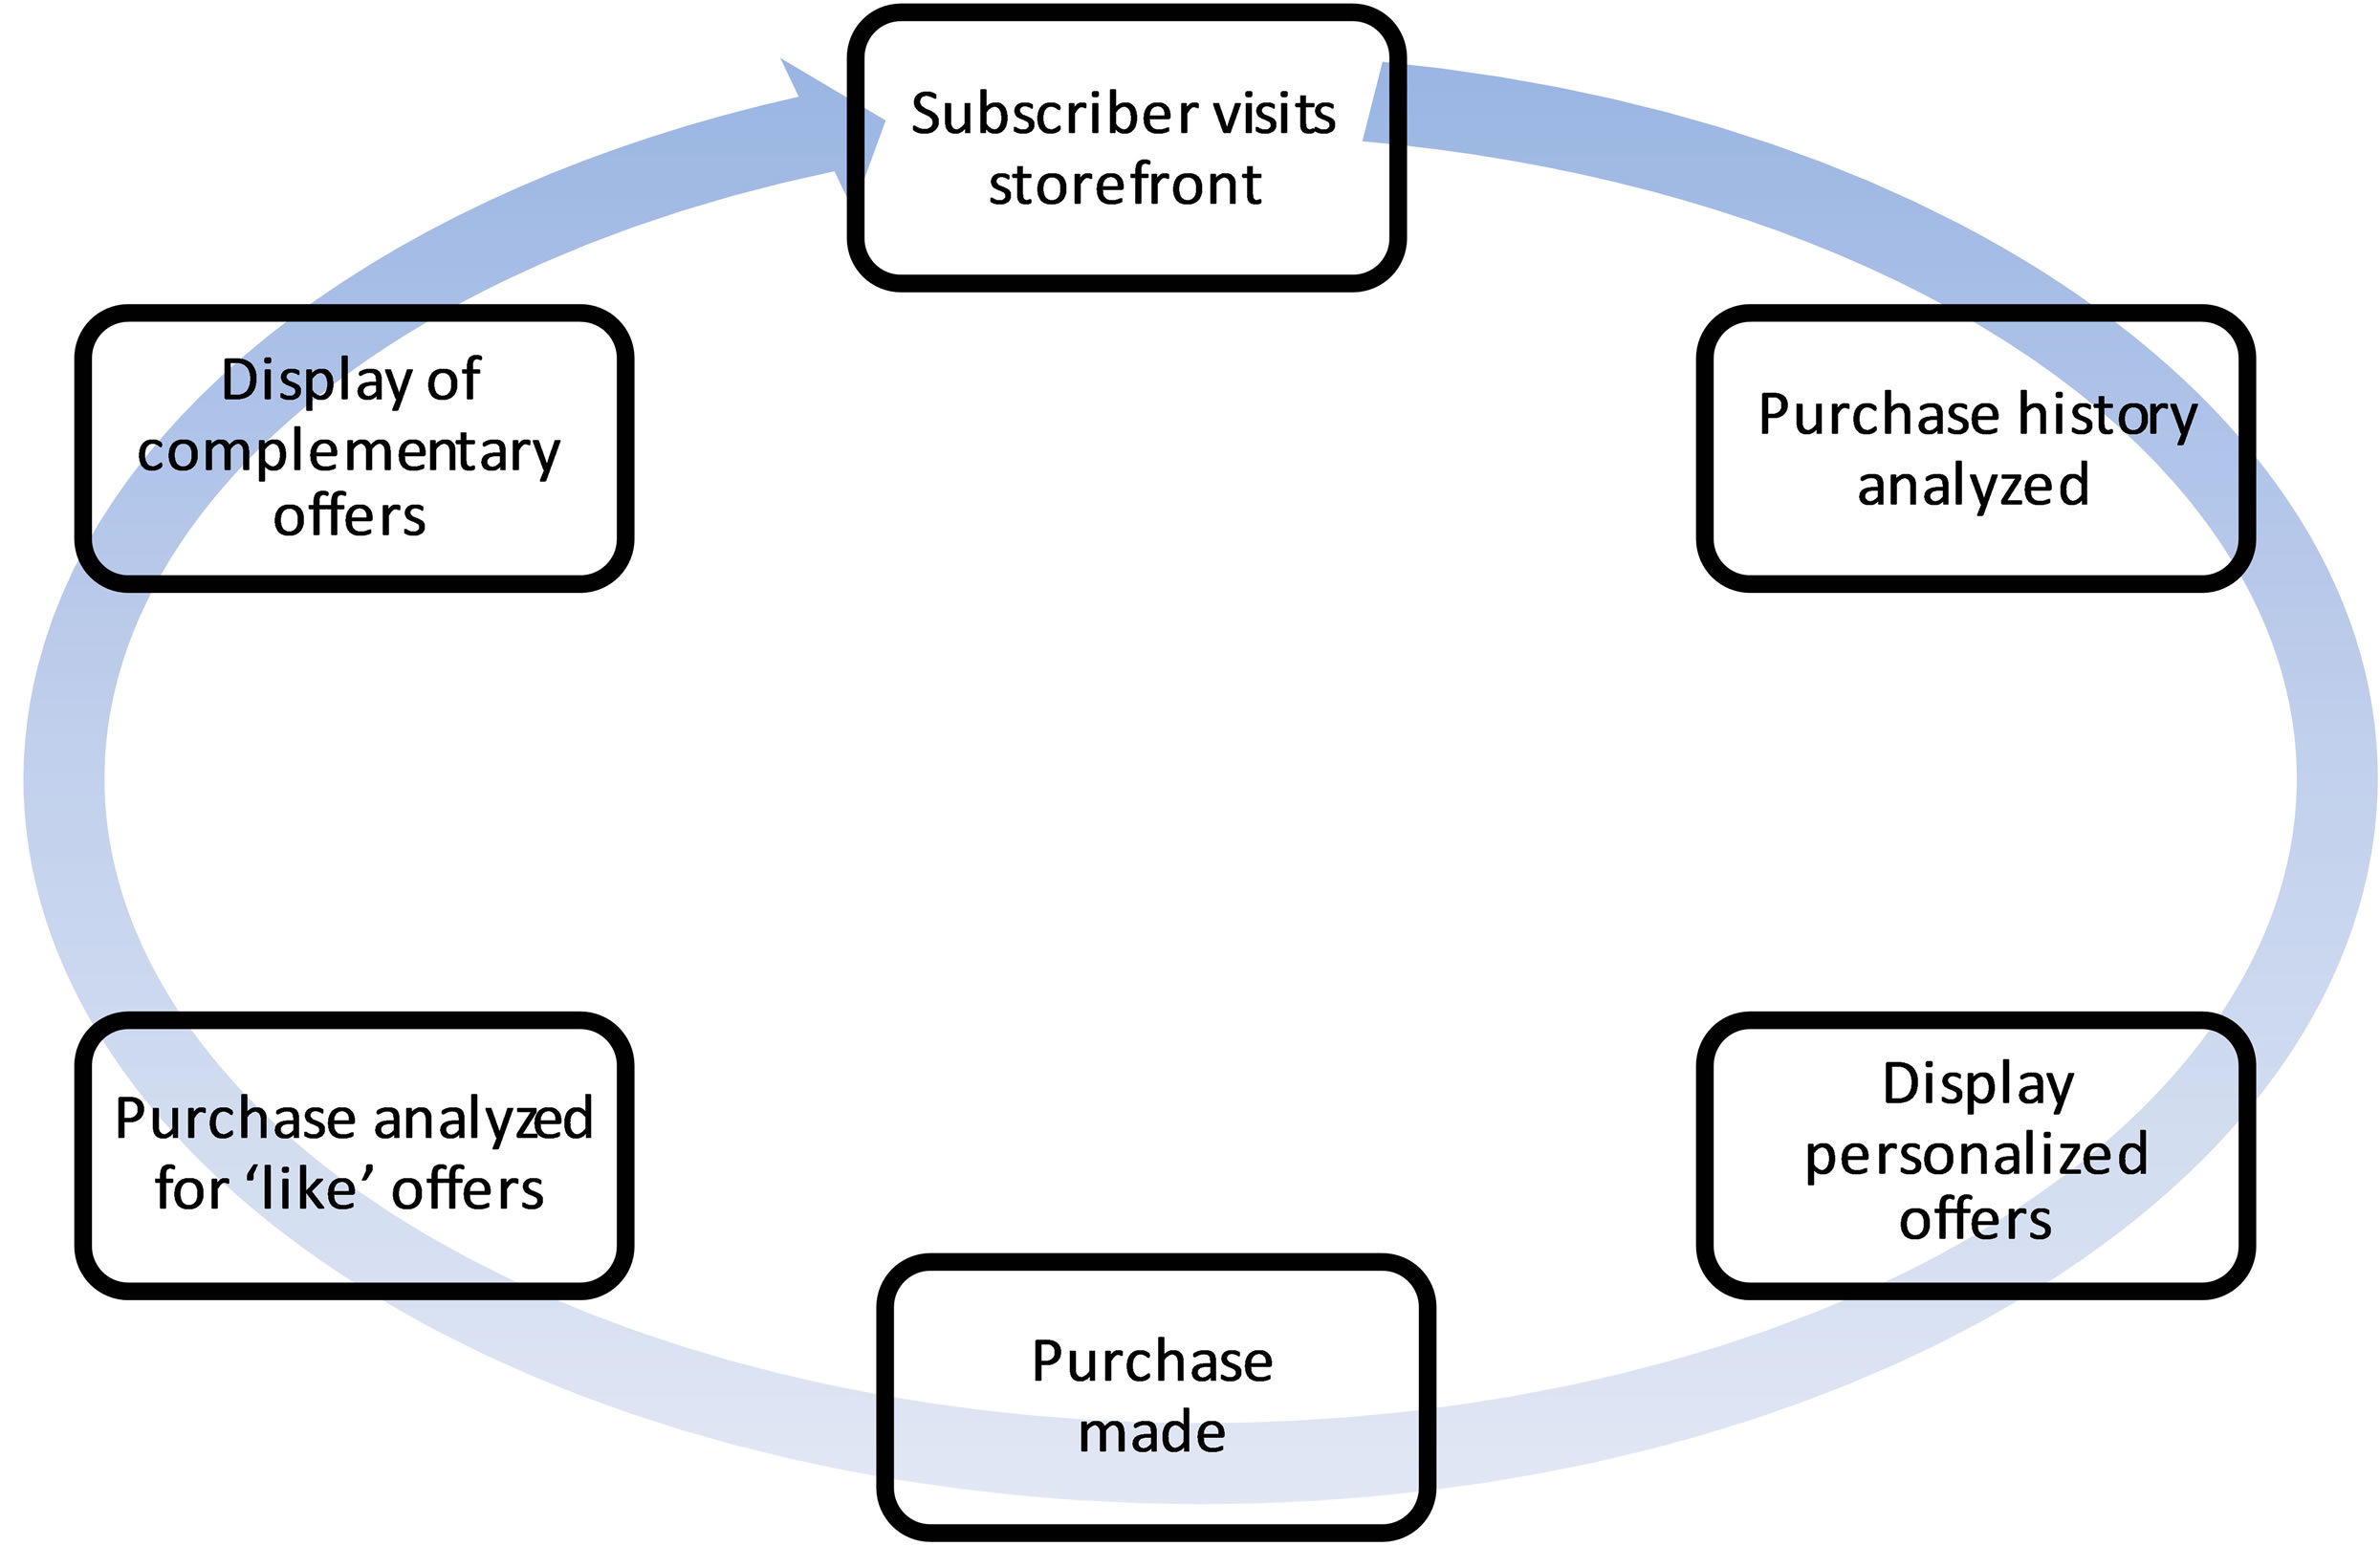
Figure 1. Carrier ReCo recommendation environment workflow.
3.3. Data Sources
There are three primary data sources underlying the Carrier RECO: customer purchases, browsing, and device database. Customer purchases are provided from the carrier’s database and are updated every 24 hours. In order to prevent a customer’s new purchases (i.e., any purchase within the past 24 hours) from being included in the recommendation set, it was necessary to include a realtime loop to capture these recent transactions. Browsing data is also captured from carrier data sources but only “prior” browsing data is used, i.e., when a user browses an item before purchasing it; “post” browsing, browsing afterwards, is not. The device database contains attributes such as screen size for the device making a request which ensures that recommended items are compatible with the requesting hardware.
3.4. Multiple ReCo’s
Separate ReCo’s were developed for purchase behavior (ReCo 1), previous browsing behavior (ReCo 2), and user segments (ReCo 3) respectively. The motivation was to generate three parallel recommendation sets and then compare and eventually combine them into a single,, integrated scorecard (Figure 2). This technique is typically called hybridized collaborative filtering [2].
Customer purchases and browsing behavior are fairly conventional collaborative filtering approaches. User segmentation is a bit more ambitious however. The basic idea behind user segmentation is to apply marketing science theory to partition users into “segments” based upon user-item attributes such as device or frequency of useand then utilize only these relevant segments when generating the related ReCo. For example, overall we may observe that items i1 and i3 are typically purchased together, but for a certain segment, items i1 and i5 are purchased in tandem. In principle, if segments are small enough, then we would expect to see each of them behave differently. The marketing science view of segments is that there will be very small intra-group variation in conjunction with very large inter-group variation. Practically, however, as we discuss in the evaluation section, these segments end up being quite large, and therefore this ReCo version proved less useful than the other two.
3.5. Collaborative Filtering Computations
Collaborative filtering techniques are characterized by the similarity measures employed to predict from other users’ purchases the most likely items or products to recommend to a specific user. Similarity, or distance, measures are a feature of cluster analysis which attempts to classify a set of data points into distinct groups based upon their proximity to one another. A variety of similarity measures and CF approaches have been suggested in the literature (see, e.g. [12-14]), the most durable and popular of which for RS are Pearson’s Correlation, Euclidean Distance and Cosine (see Appendix for mathematical descriptions). The efficacy of each of these measures varies from data set to data set so we have applied all three to each of purchase behavior, browsing behavior, and user segmentation ReCo’s to determine in each case which measure is superior.
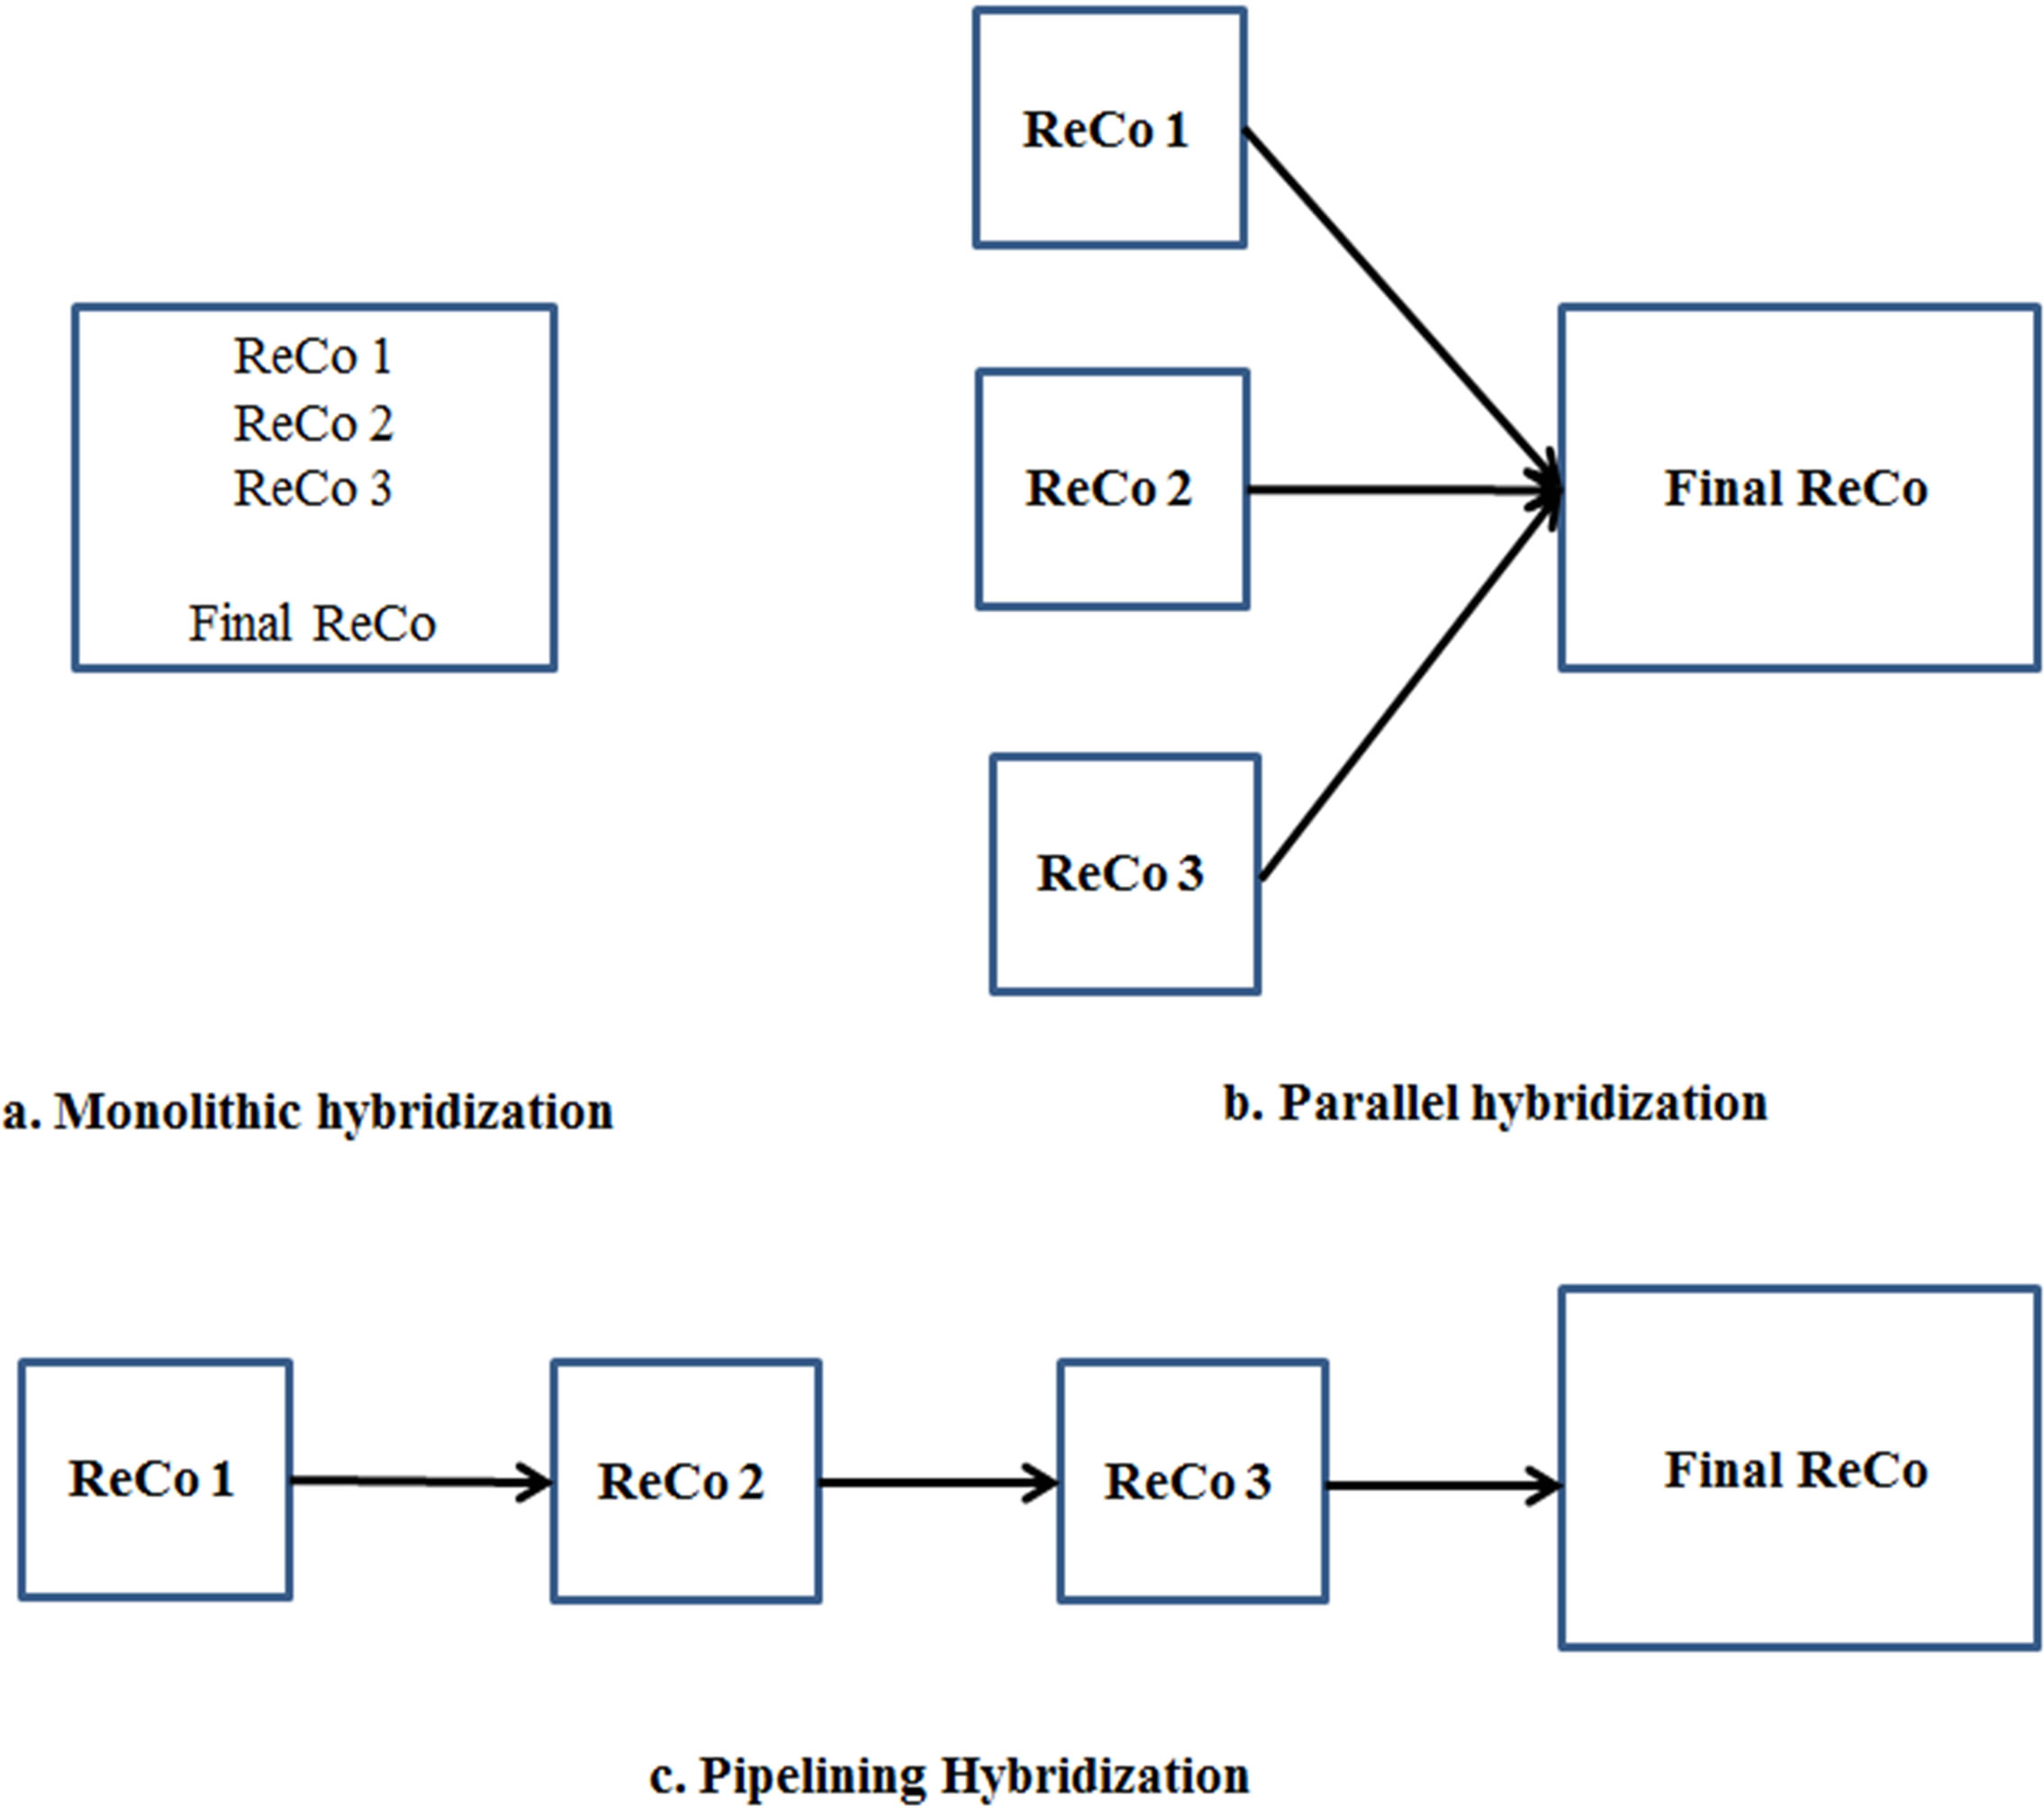
Figure 2. Three modes of CF hybridization.
3.5.1. Customer Purchase ReCo
To demonstrate how CF works, we take a simple example of customer purchase behavior data and derive the subsequent ratings for products to recommend to a user. The first step in applying collaborative filtering techniques is to construct a matrix of users and purchased items created from the appropriate data source(s) as shown in Table 2 (products and items are used synonymously in this example). Recall the objective is to identify products which other users have purchased in addition to the item in common with the user for whom recommendations are being made. Thus we are looking for product similarity which we measure by applying the Pearson, Euclidean, and cosine metrics respectively as shown in the corresponding tables in Figure 3. We illustrate the calculation for the Pearson Correlation Coefficient (Appendix Equation (3)) from the Item-User table for the cell (Prod2, Prod5):
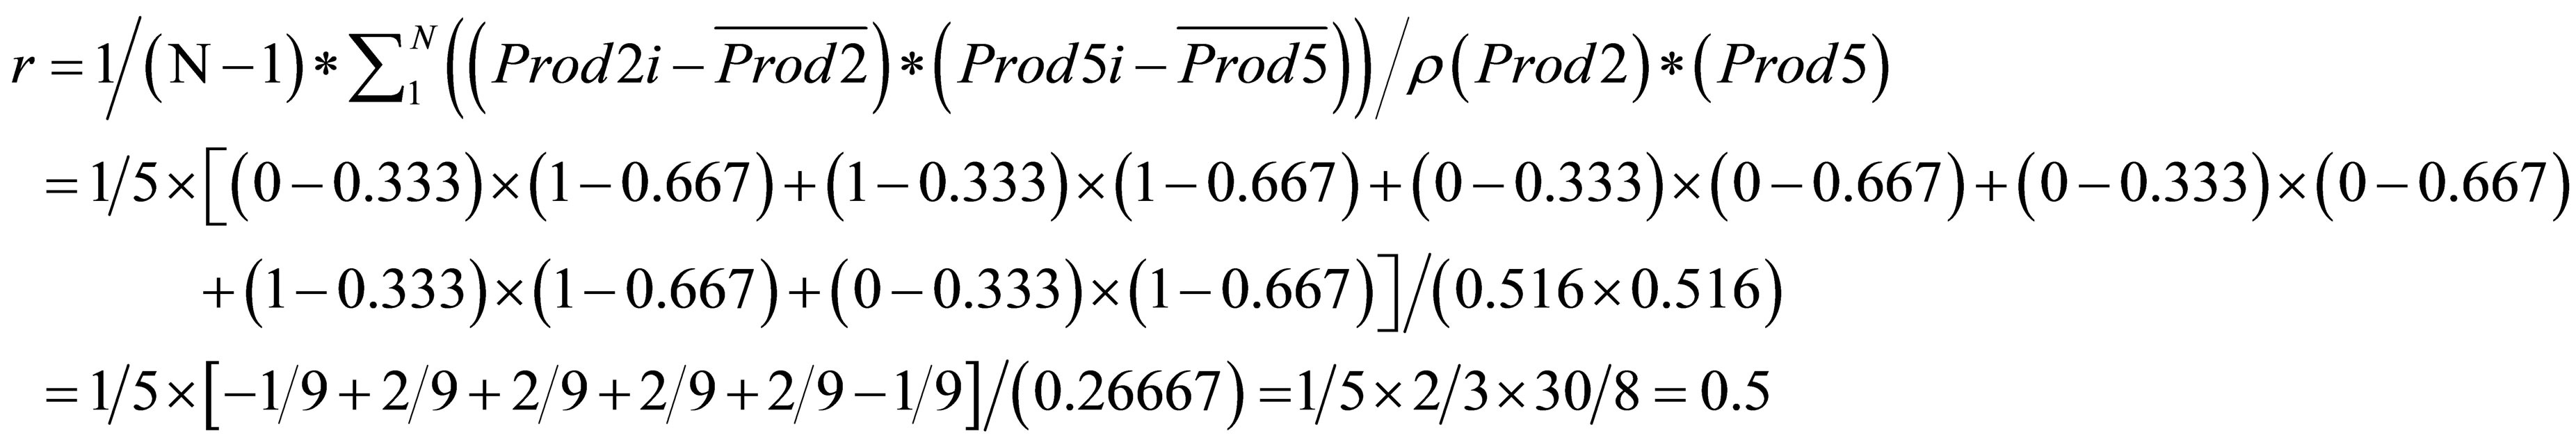
Each of the resulting matrices is symmetric for this purchase behavior ReCo. The interpretation of the similarity measures in the form of recommendations is shown in Figure 4. Note that lower values in the Euclidean distance indicate higher preference whereas the opposite is the case for Pearson correlation and Cosine.
3.5.2. Browsing Behavior ReCo
The browsing behavior example is more complicated because we must take account of browsing and purchasing combinations and the relative times of each. We specifically want to keep track of those instances when (a) a user browsed one item and later bought it, (b) browsed one item and later bought another, and (c) bought an item without first browsing. We do not want to include situations where users bought an item and subsequently browsed it, therefore it is necessary to timestamp purchase and browsing events. The same algorithms apply as in the Customer purchase ReCo but they are now applied to an effective “join” between the browsing data and the purchase data. Figure 5 shows a simple example of browsing and purchasing items for a set of six users. The top two tables show which users purchased which items and which users browsed which items (with associated timestamps) respectively. The remaining five tables show browsing behavior for each of the users who purchased an item. For those tables, the green-filled cells with red font indicate items that were browsed after the item in question was purchased, i.e. the browsing timestamp was more recent than the purchase timestamp (not shown explicitly in the tables).
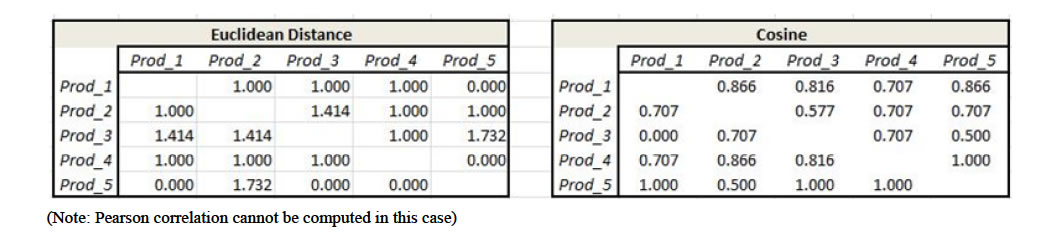
The distance calculations (Figure 6) must account for valid combinations of browsing and purchasing. In particular, for any specific item, we want to calculate the “distance” across all users, i.e. for any pair of items, users who purchased both items, one of the two items, or neither of them. Thus, for example, referring to the (Prod1, Prod2) cell in the cosine distance table in Figure 6, the similarity formula is calculated, using Appendix Equation (2), from the Bought_Prod 2 table as the cross-product of the Prod_1 and Prod_2 columns divided by the square root of the inner products of the Prod_1 times Prod_2 columns:
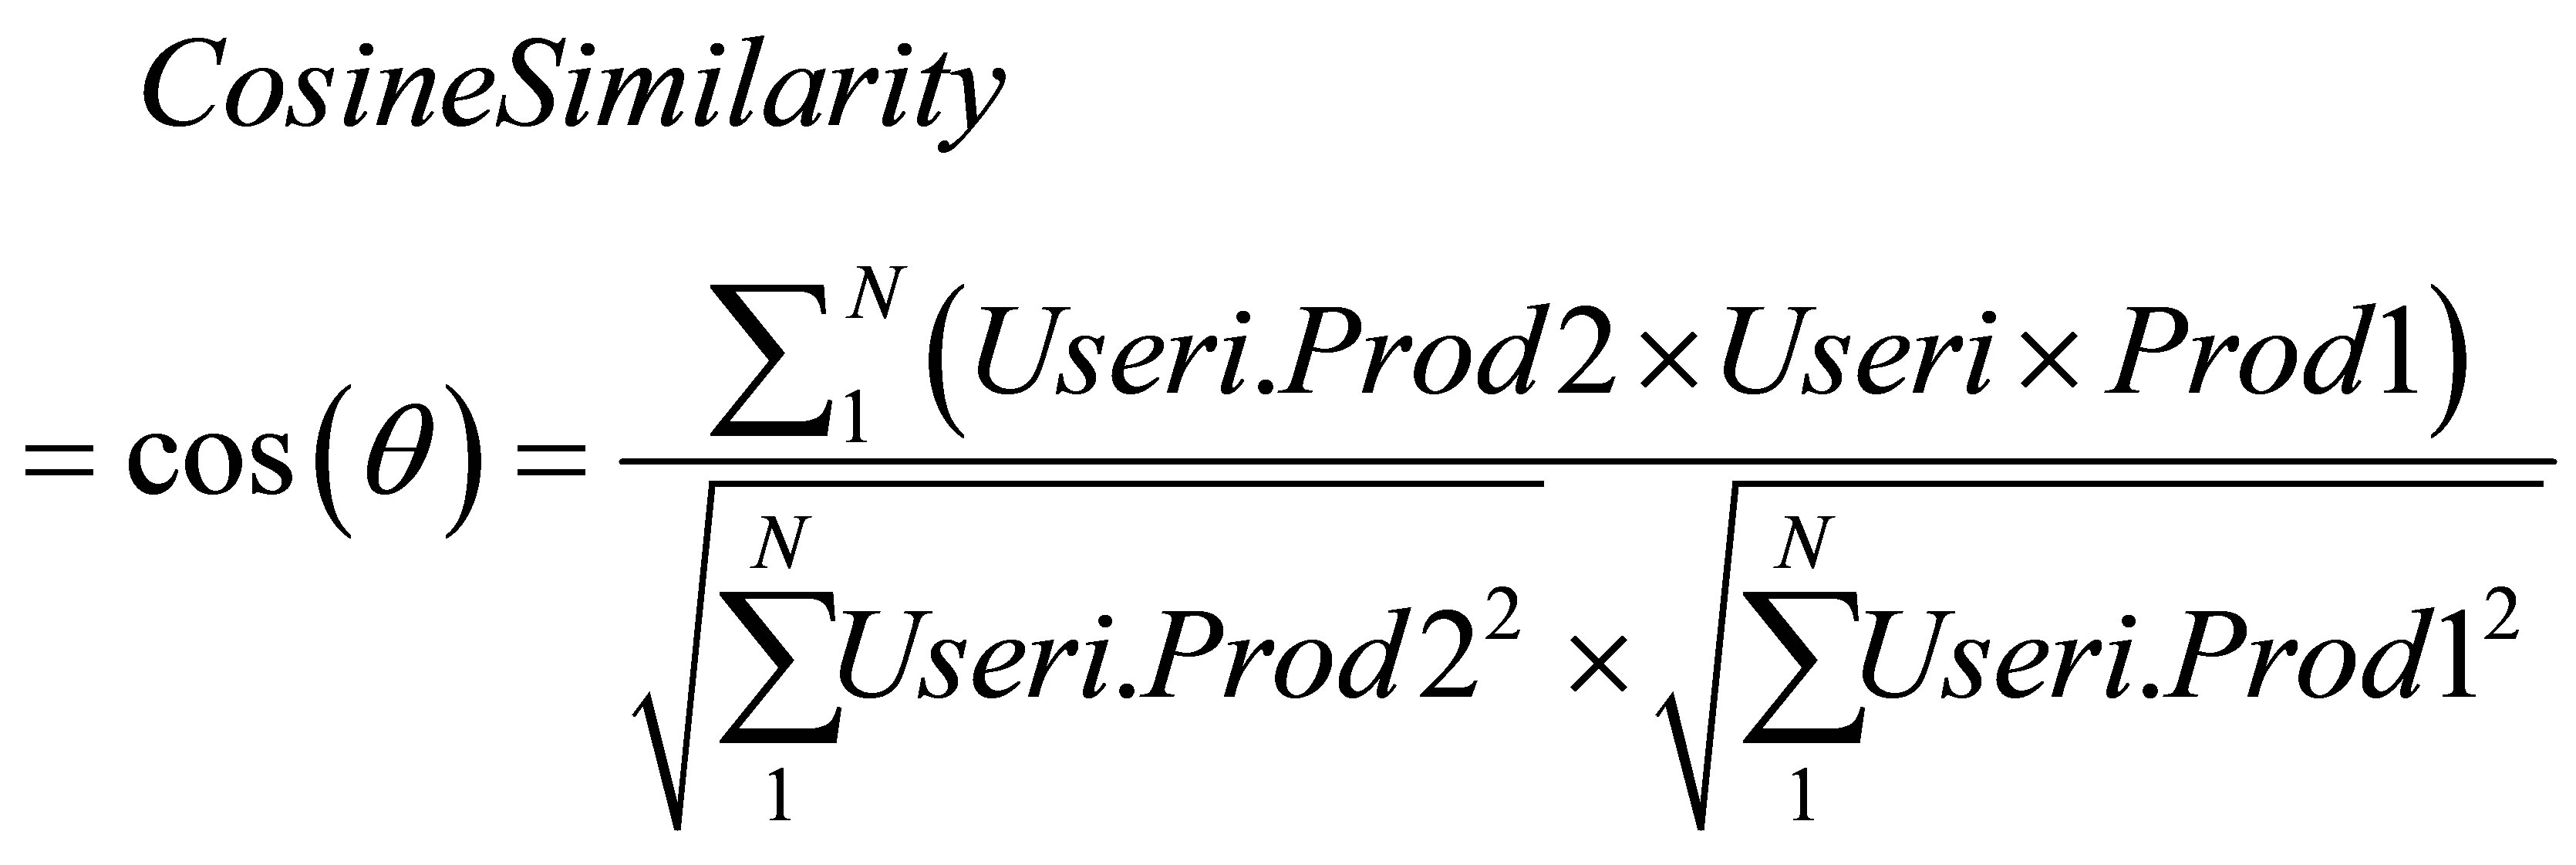
Substituting the values from the Prod_1 and Prod_2 columns of the Bought Prod_2 table yields

Note that this matrix, unlike the Customer Purchase matrix is not symmetric. Performing the related calculation from the Bought Prod_1 table yields a different number in this case. Note also that the browsing scenario does not allow for the calculation of the Pearson correlation matrix because the Buy behavior does not change, i.e., the user always bought the item under consideration.
Figure 7 shows the Recommendations derived, in this case, solely from the Cosine measures in Figure 6. Recommendations are made for each item the particular user
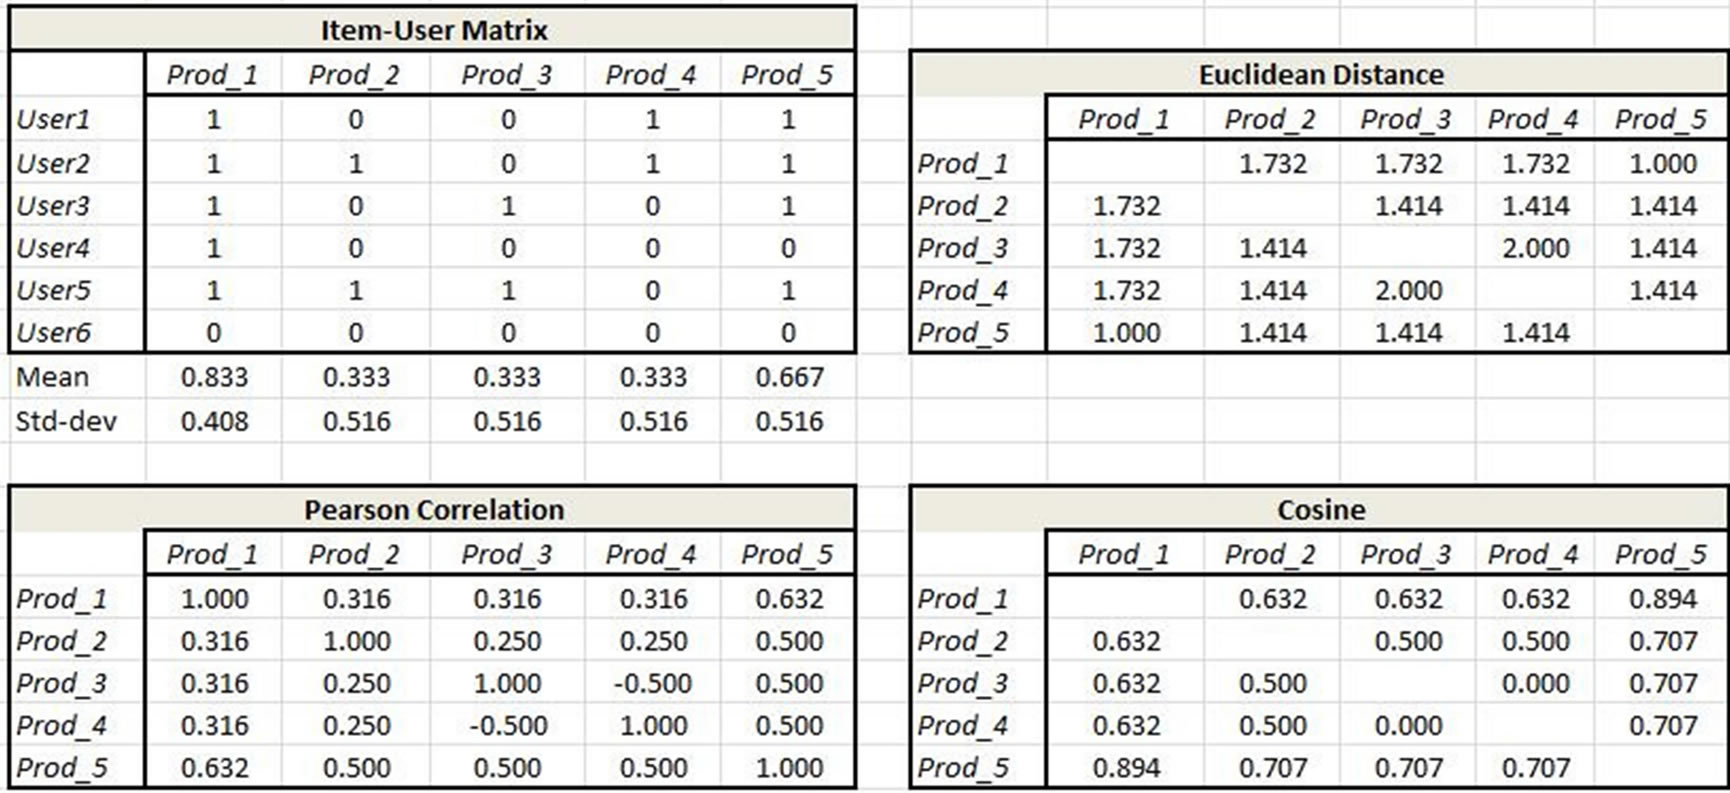
Figure 3. Simple example of user-item purchases and associated similarity measures (all examples show significance to three decimal places).

has browsed, discarding previous purchases in the process. So, in Example 2, the user has browsed items 1 and 4. For each of these two items, a recommendation is calculated from the associated item (product) row in the Cosine table with the high values of the Cosine being the most desirable. In this case, the user being a new customer has no previous purchases. Example 3 on the other hand involves a customer with 4 previous purchases leaving only one outcome in the recommendation set.
3.5.3. User Segment ReCo
The user segment ReCo differs from the Purchasing and Browsing ReCos in that it focuses upon user-specific attributes, seeks to classify users according to these attributes, and then to relate purchasing behavior to the resultant classification categories [15]. Attributes may be product-related, i.e. they may be attributes of products which the user already has purchased such as mobile_ device type. The idea behind this approach is to drill down below simple product designations and to segment products by their attributes in the assumption that users with the same product attributes are likely to make similar subsequent purchases. Thus, for example, users who have the same screen size on their mobile devices might be expected to purchase from the same set of apps with the best displays for that screen.
More importantly, attributes may be strictly user-related as opposed to product-related. Thus, we may include demographic attributes such as income, education level, marital status, etc. which opens much broader horizons for potential market segmentation. However, this requires significantly more extensive data collection as well as commensurately more sophisticated analytical modeling to fully leverage as we discuss in the section on research extensions. In our carrier ReCo, users were segmented as shown in Table 3.
The user approach has two steps: identifying similar users and then mapping these users to items via their purchase history. Figures 8 and 9 show the similarity measure results and associated recommendations of the user identification first step. Note that the values in the User-Attributes table are not binary, rather they refer to attribute categories. For example, Attribute 1 may refer to device screen size where value 1 signifies screen size < 2”, 2 means 2” < screen size < 3”, and so forth. This requires a database of attributes, associated attribute categories, and a cross-walk between customers and the associated attributes which they have purchased or are using. These data for this application were provided by the telecommunications carrier from their proprietary databases.
Once user similarity has been defined, it is then nec-
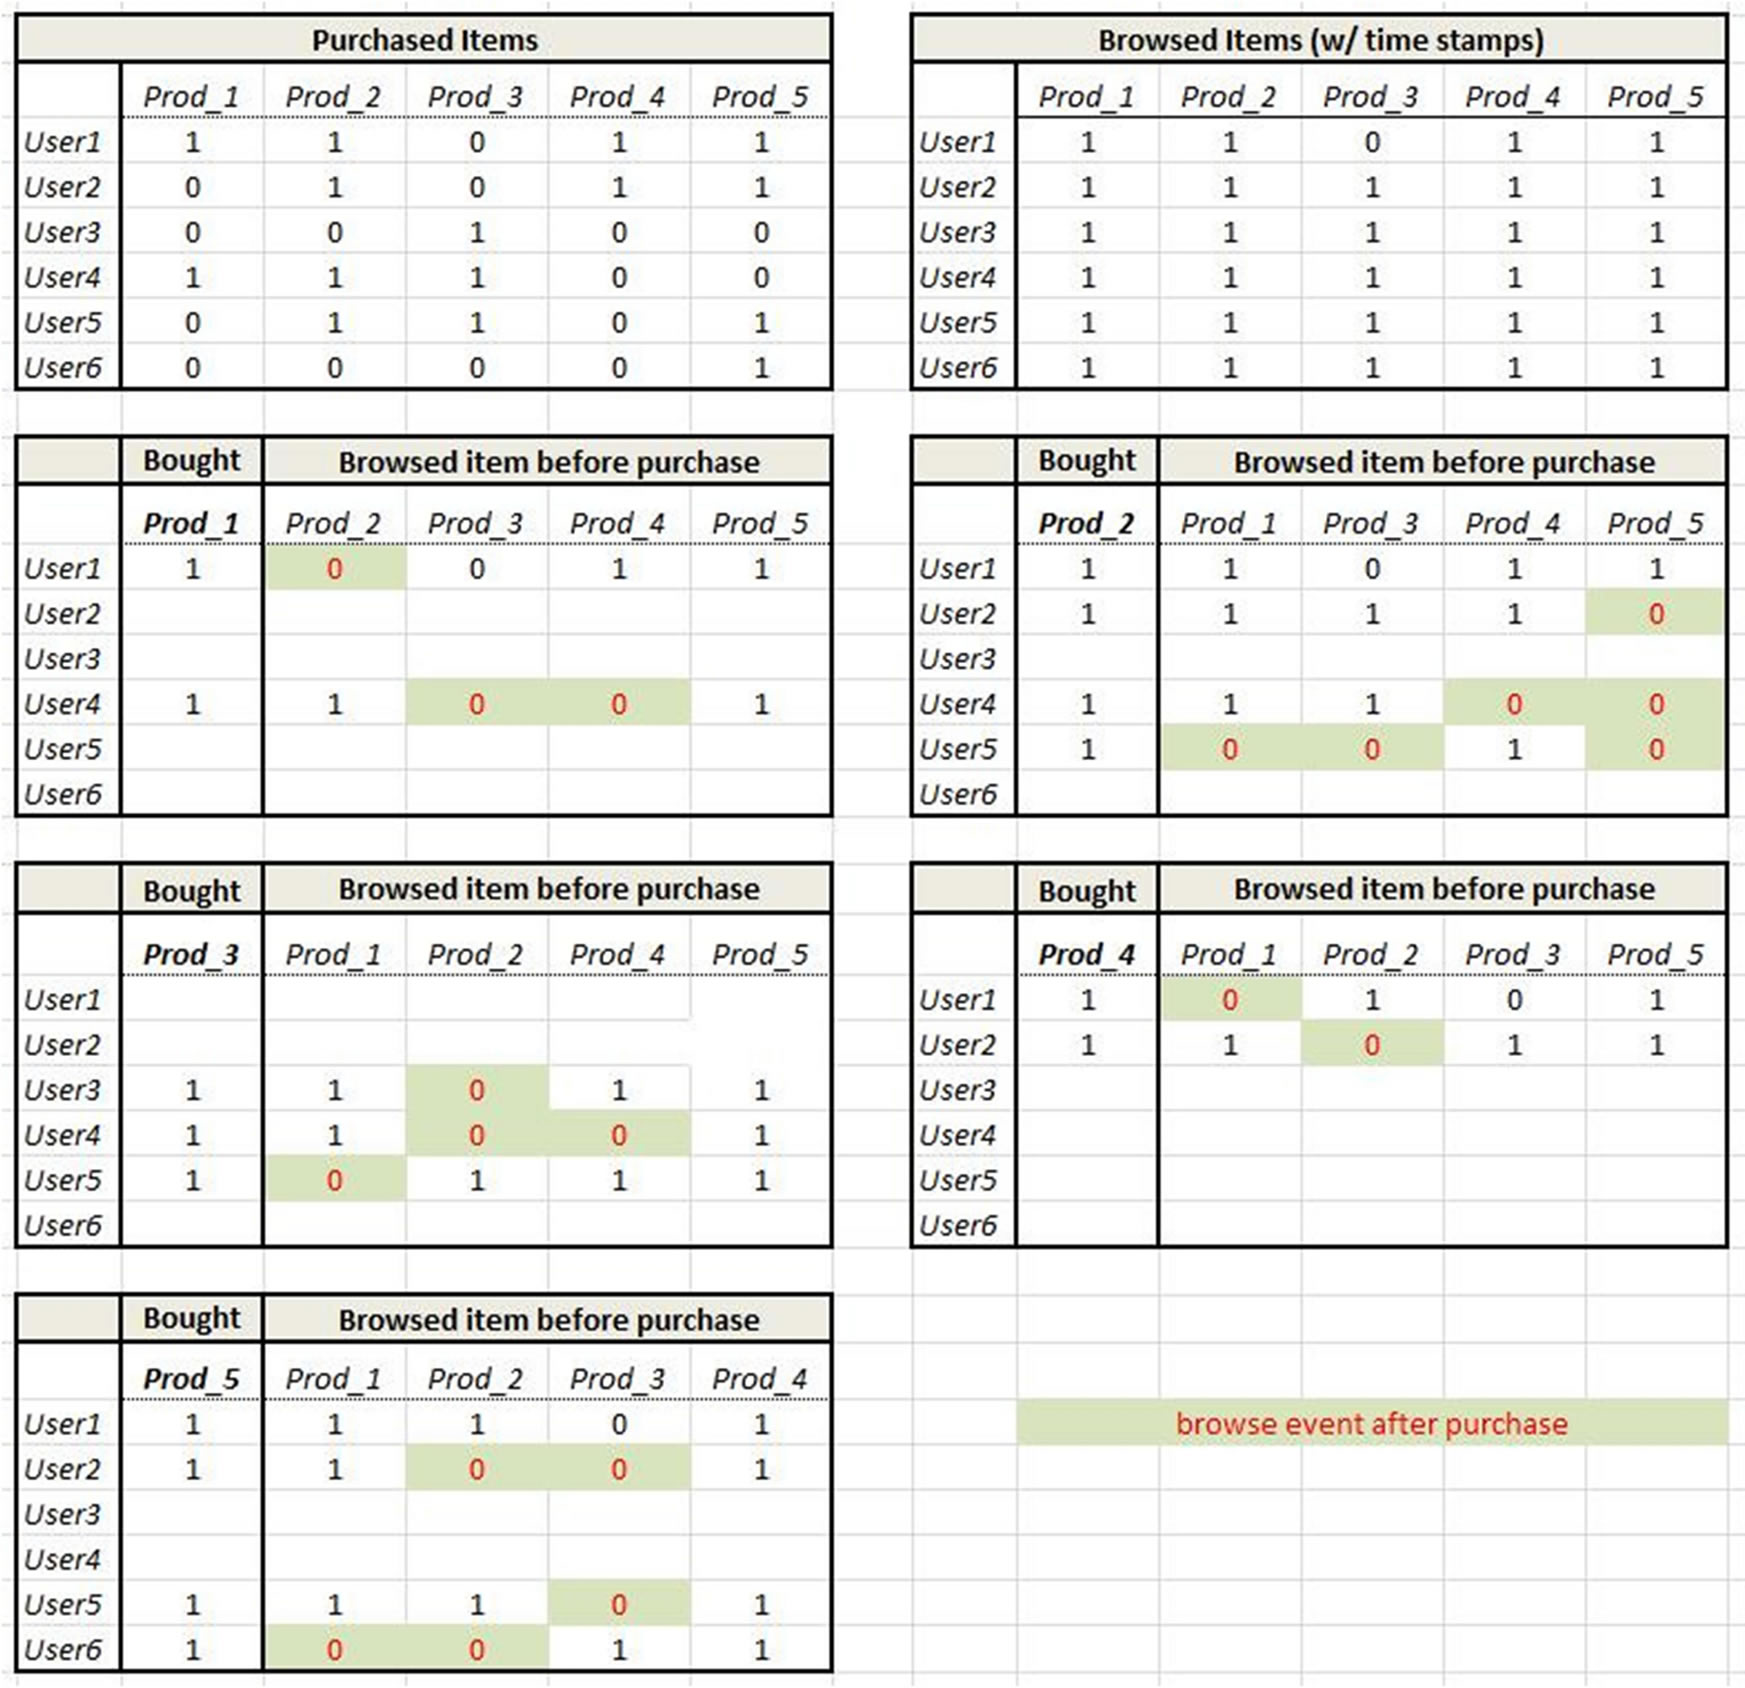
Figure 5. Simple example to illustrate browsing behavior situation.
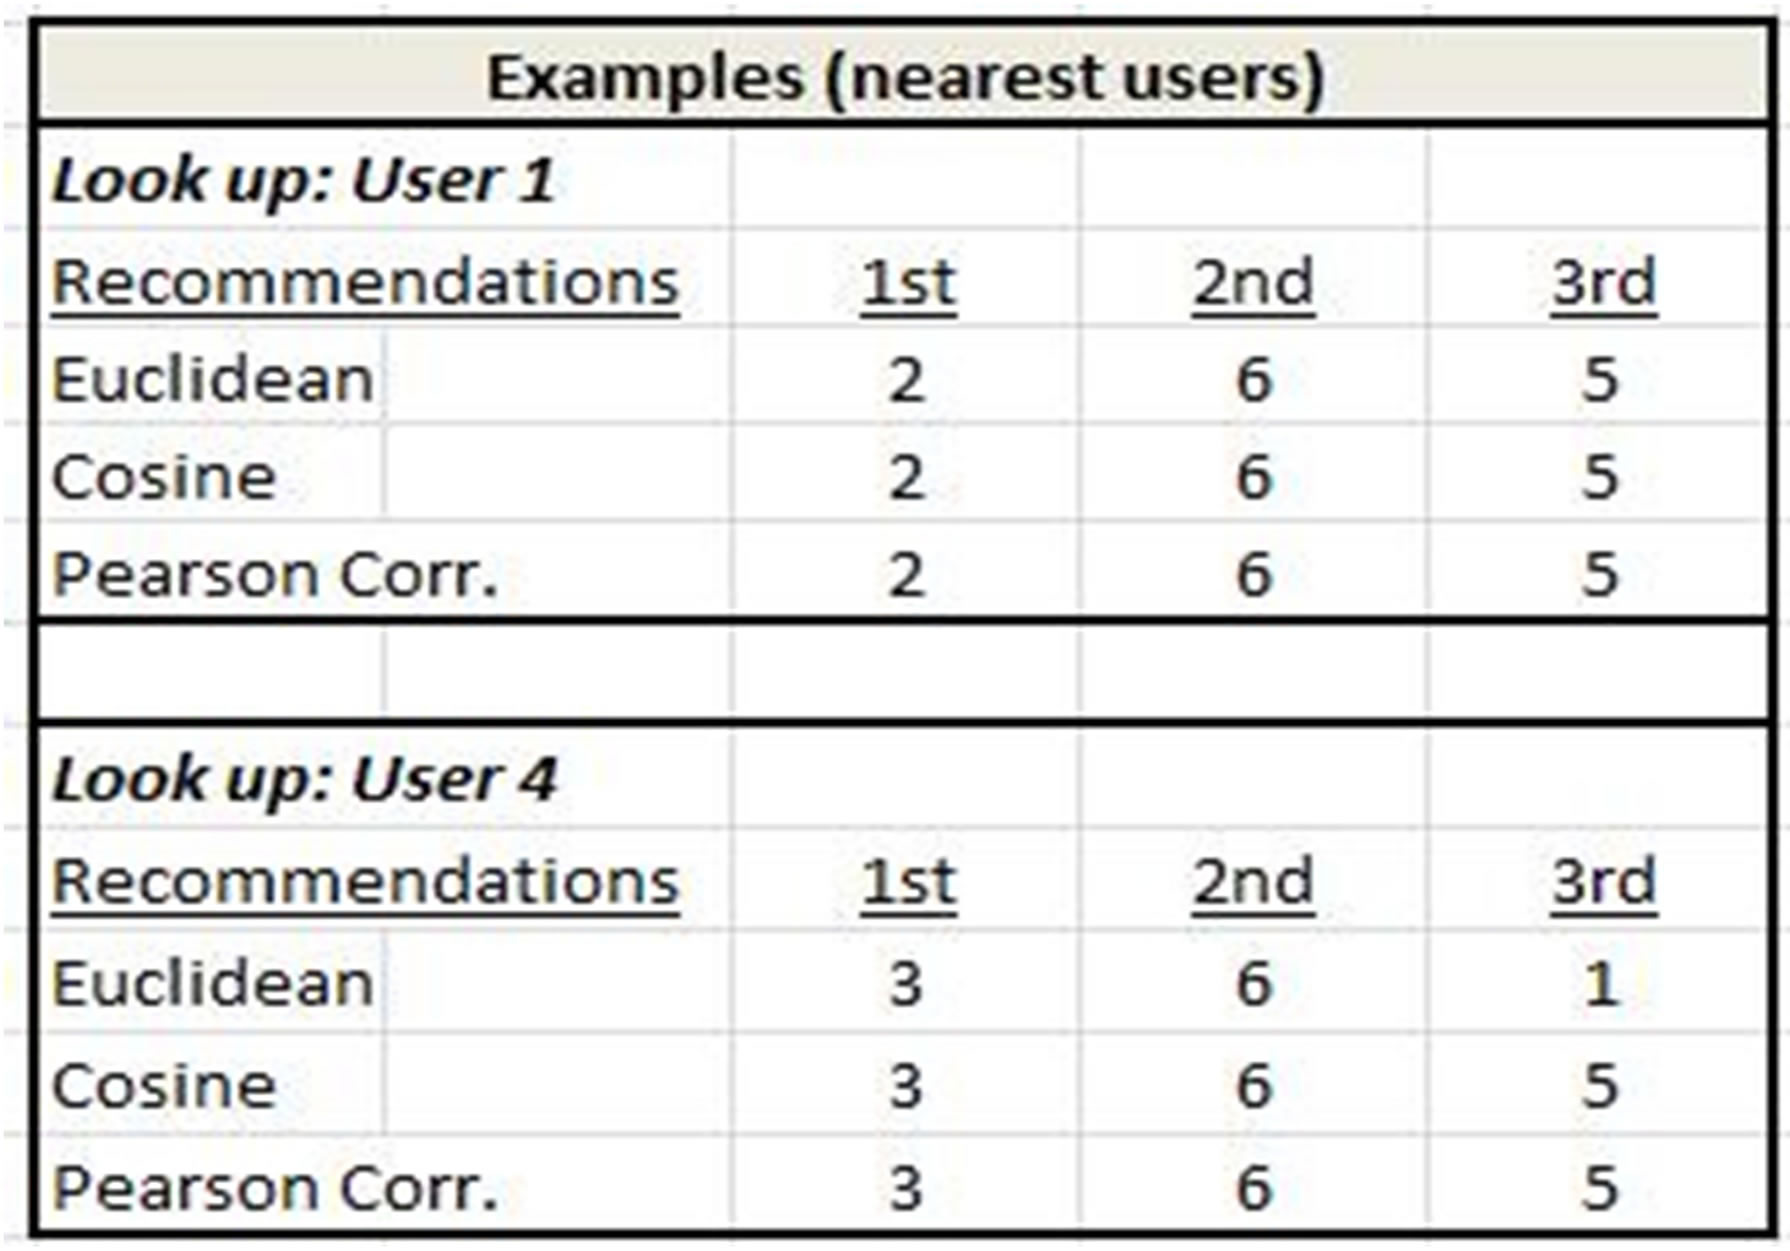
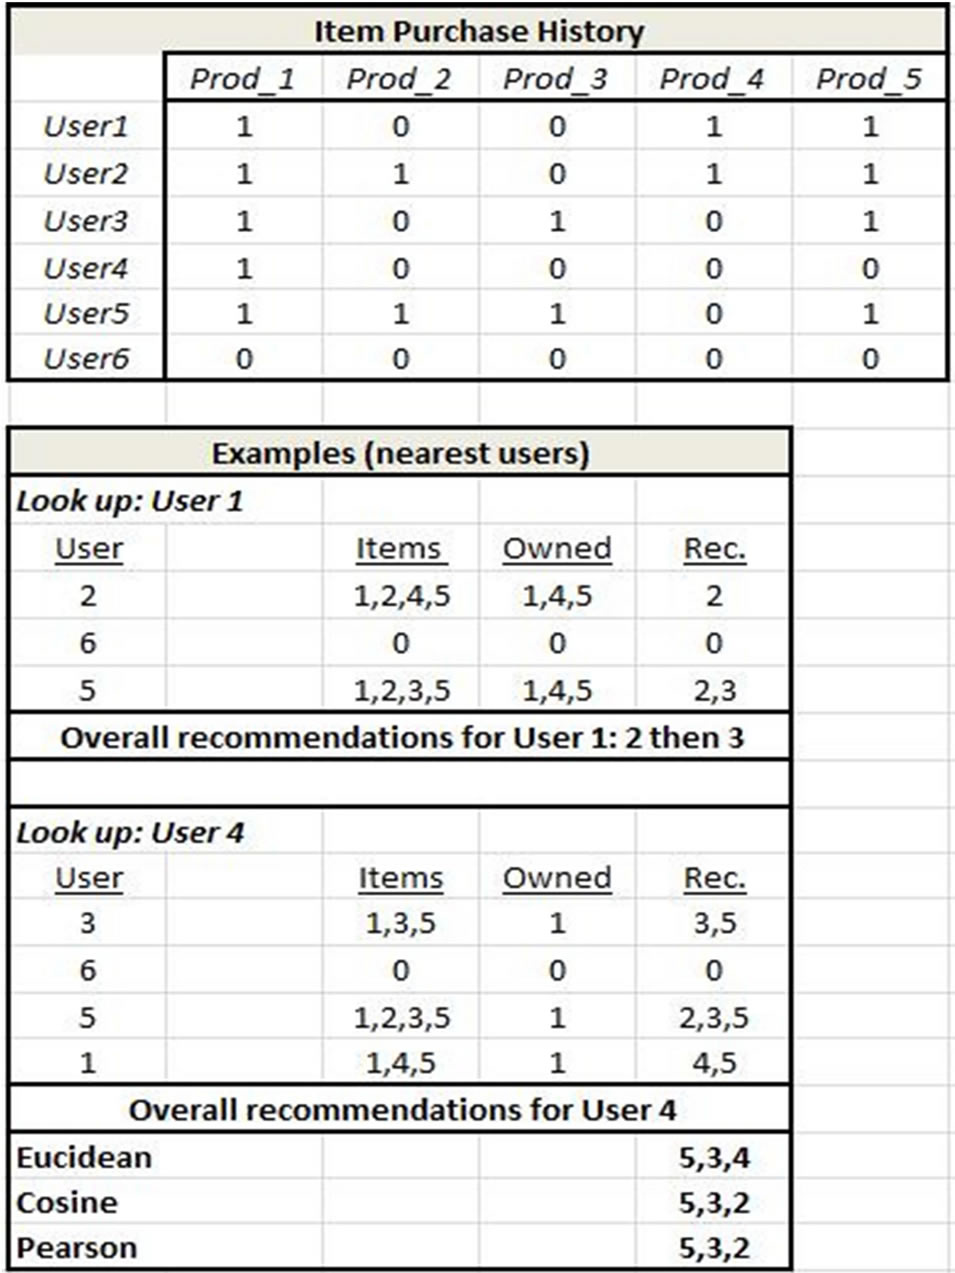
essary to map users to items which they have purchased. This user-item mapping is shown in Figures 8 and 10 along with the subsequent recommendations for User 1. Recommendations for User 1 are arrived at by taking each nearest user for User 1 derived from Step 1, (Users 2, 6, 5 in this example since all three similarity measures yielded the same set of users), examining the product(s) which each bought and discarding those products which User 1 has already purchased. This yields a primary recommendation of Product 2 which appears for two of the Users, and a secondary recommendation of Product 3 which appears for one of the Users. The same process applies to User 4.
We have shown above simple examples of three different CF-based ReCo’s for Purchase, Browsing, and User Segmentation respectively. In the next section, we
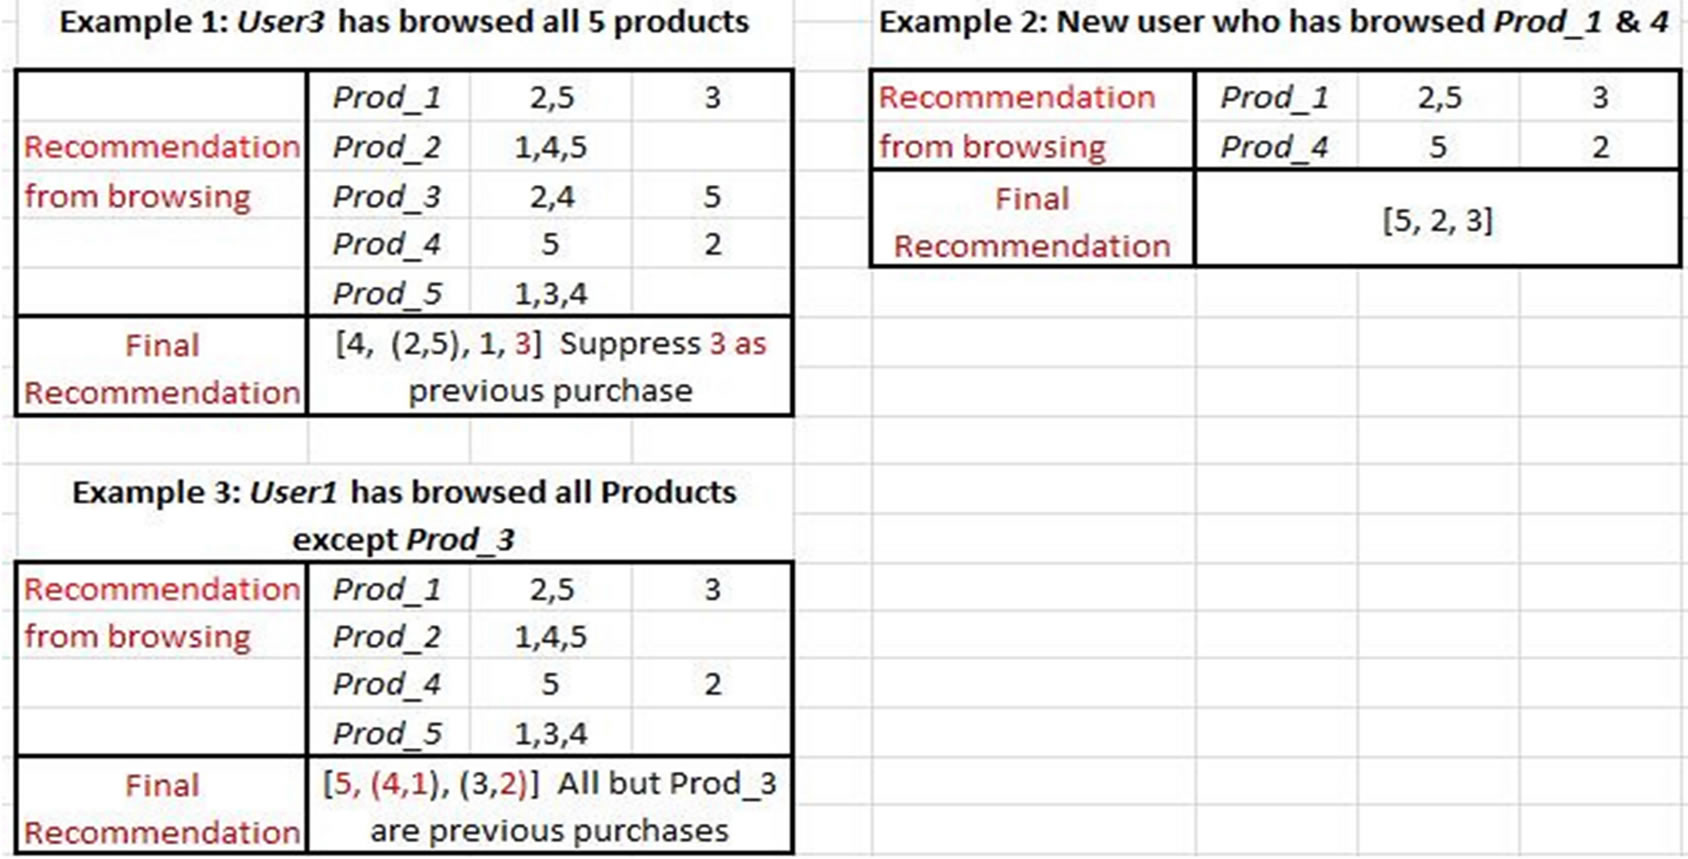
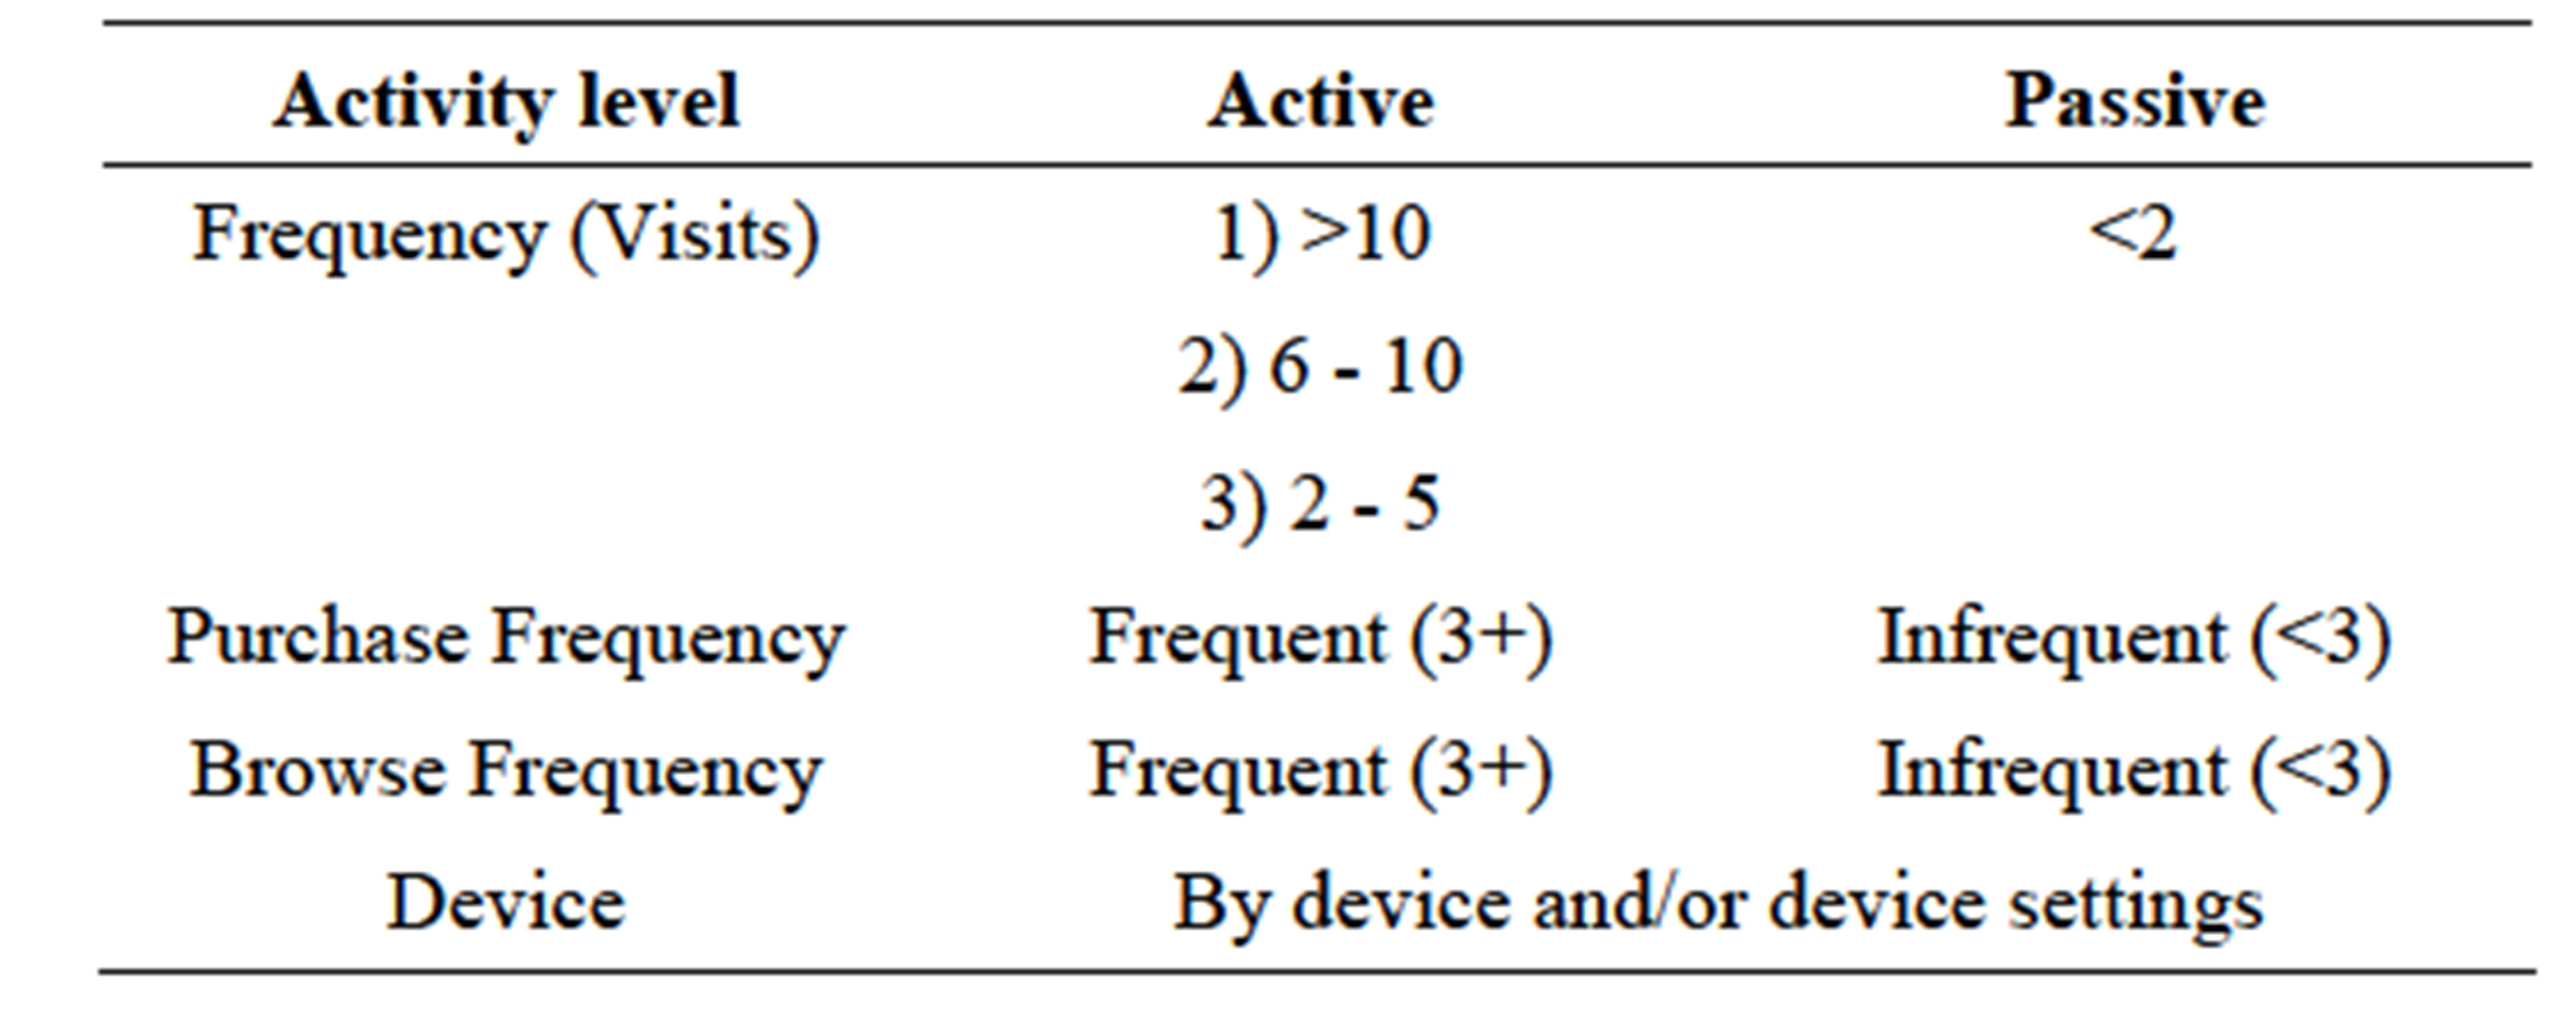
Table 3. User segmentation in carrier ReCo.
evaluate the efficacy of the different approaches.
4. Evaluation of Carrier ReCo
4.1. Purchase-Based ReCo
4.1.1. Lift Metrics
A very common measure of efficacy in marketing and advertising campaigns is lift, defined as the improvement in response resulting from the application of statistical
modeling or segmentationin generating a mailing list, prospect database, or in our case, purchasing recommendations. For the telecommunications carrier in our application we compare ReCo results with the incumbent process the client was using previously. This process was initially based upon random rotation of products, for
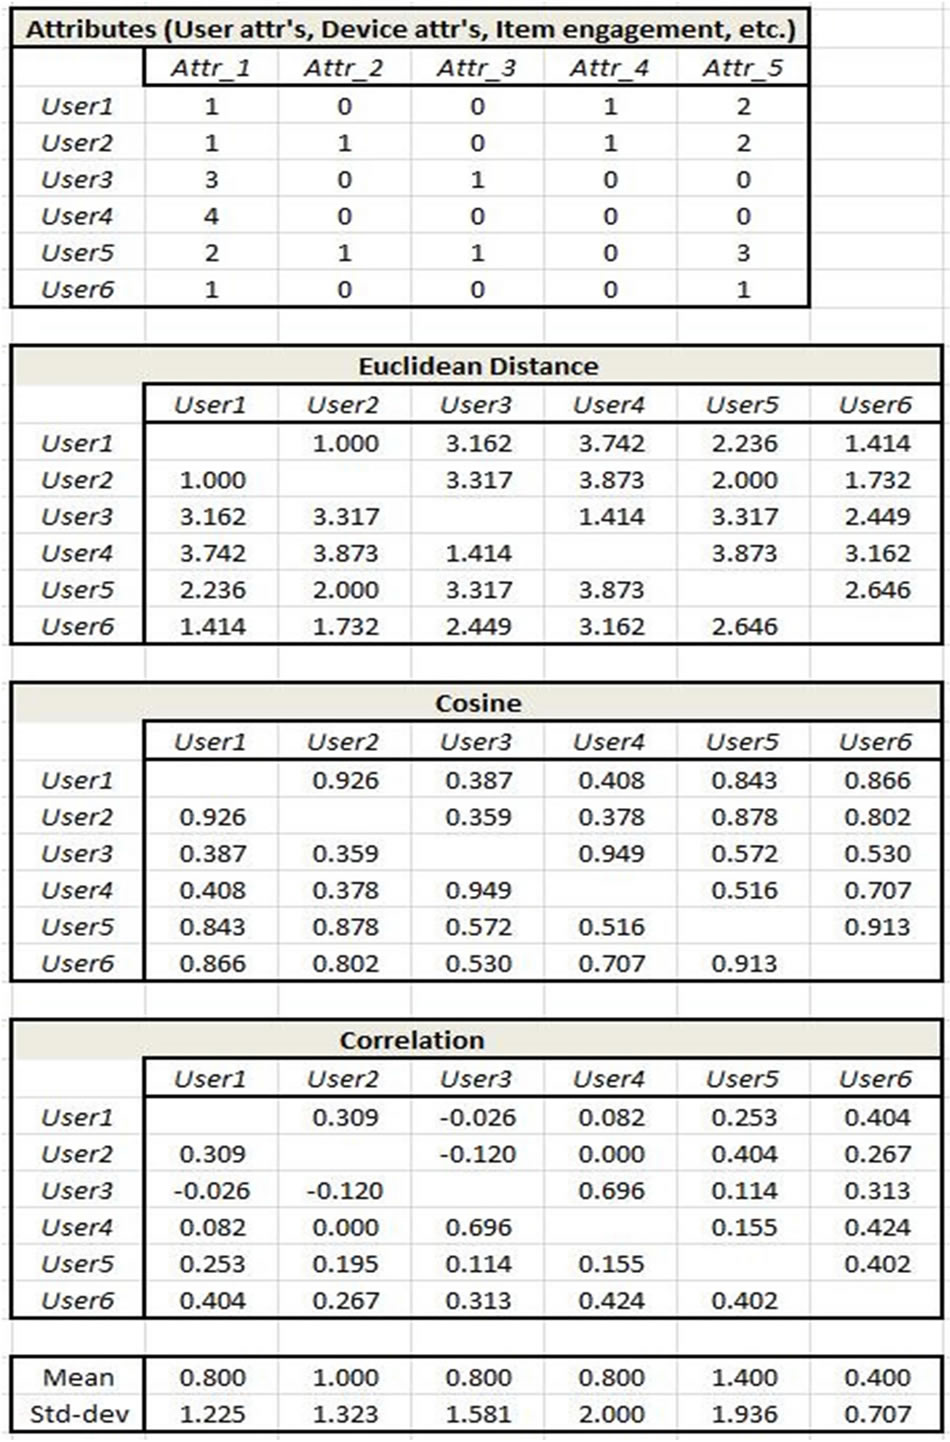
Figure 10. Simple example of user attribute table and associated user similarity measures.
example if the client (carrier) had 400 products, they presented each one randomly 1/400th of the time. The overall lift for ReCo over this incumbent random rotation was (4.6%/0.22%) = 20.9.
Random rotation was then replaced by Top Seller rotation where the top n selling products (n ~ 100) were displayed to the user 1/nth of the time. Thus each user got to see up to 50 items over time from most popular to 50th most popular. The overall lift for ReCo over this Top Seller rotation was 1.51 (4.7%/3.1%) = 1.51 which equates to a 51% increase in sales Figure 11.
Figure 12 shows lift performance results by Placement of the ReCo and by Product. Placement refers to where the recommendations were shown on the mobile landing page. Options range from the user’s personalized space to various positions on the mobile page depending in part upon the screen real estate available on the user’s mobile device. The most effective placement for CTRs and purchases was clearly in the personalized space whereas confirmation had the lowest efficacy. Likewise, performance by product-line can be compared; videos received the highest click-through and purchase, while “other” products produced the lowest click-through and purchase.
It is worth noting that 30% of the ReCo-based responders were frequent purchasers (had already purchased more than three items). Additionally, another 7% of ReCo-purchasers became frequent purchasers by purchasing their third item. These results confirm success in the sense of confirming the goals described in rows 1, 2, and 5 in Table 1.
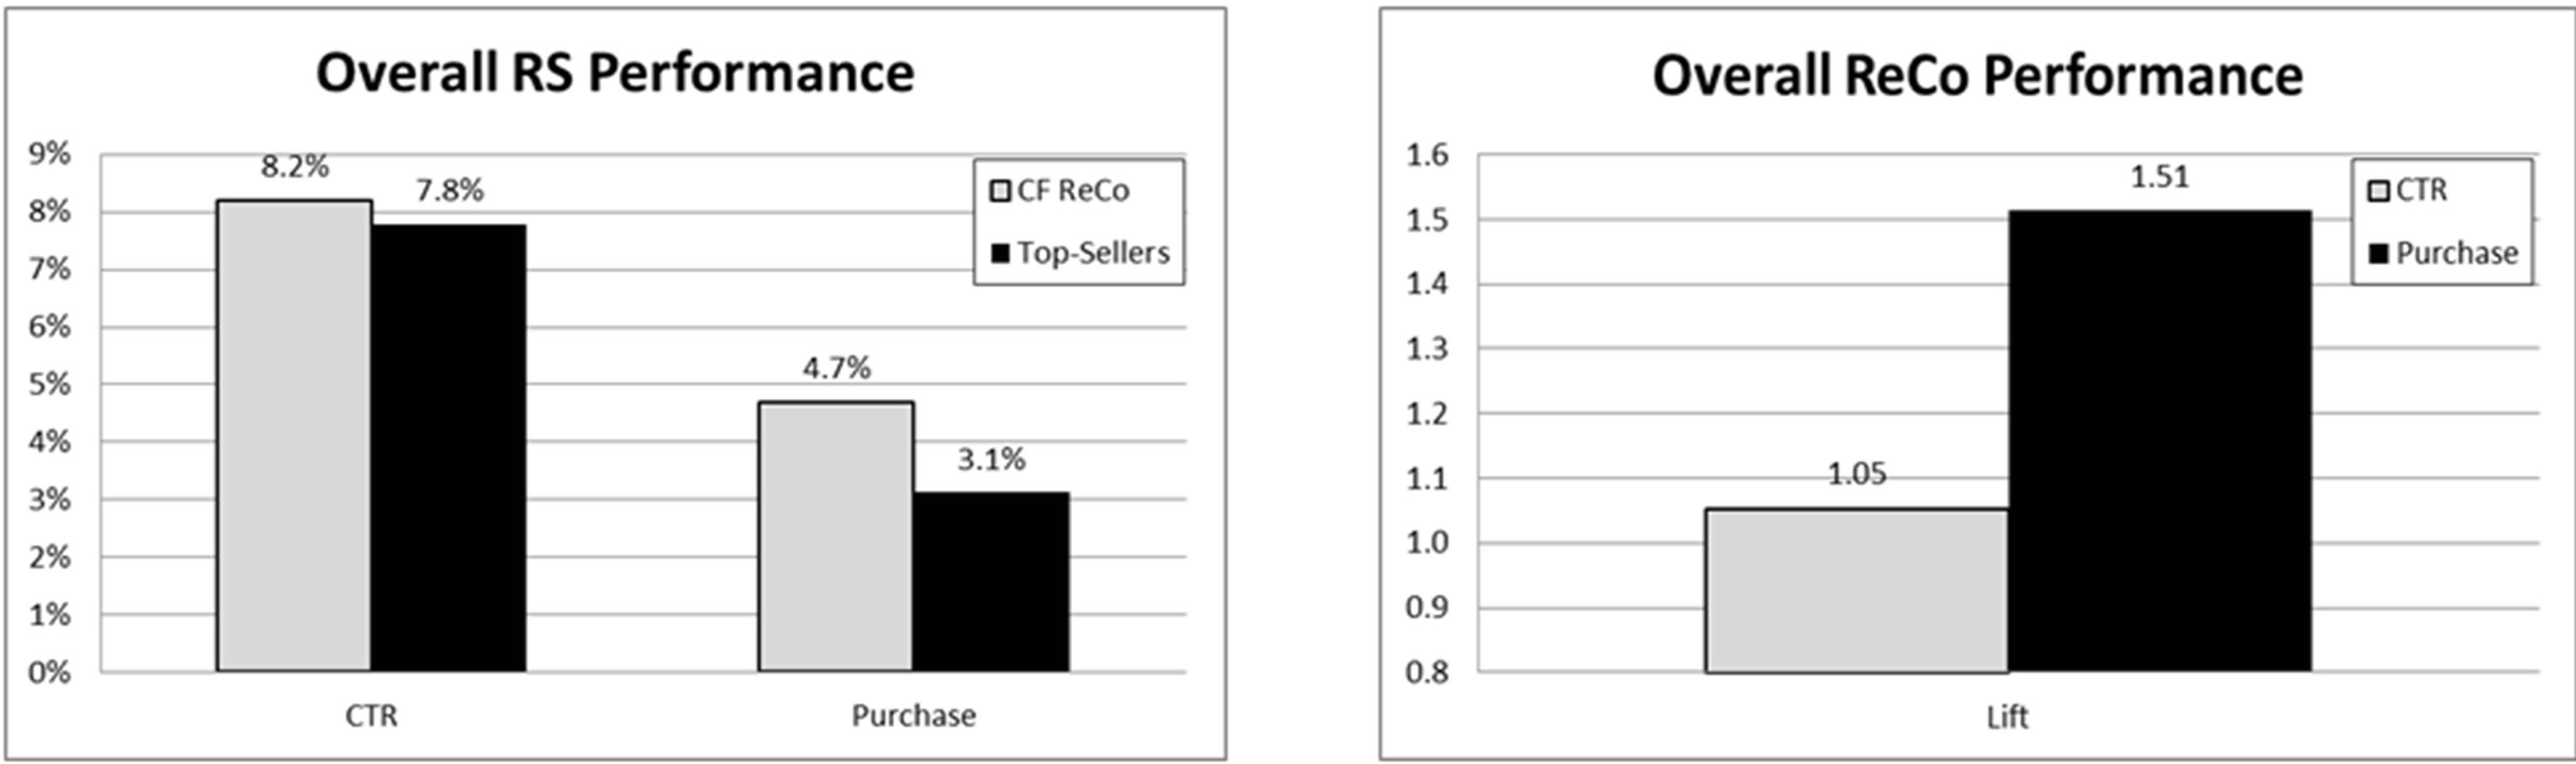
Figure 11. Lift for purchase-based ReCo vs. incumbent top seller rotation (“CTR” = click through rate).
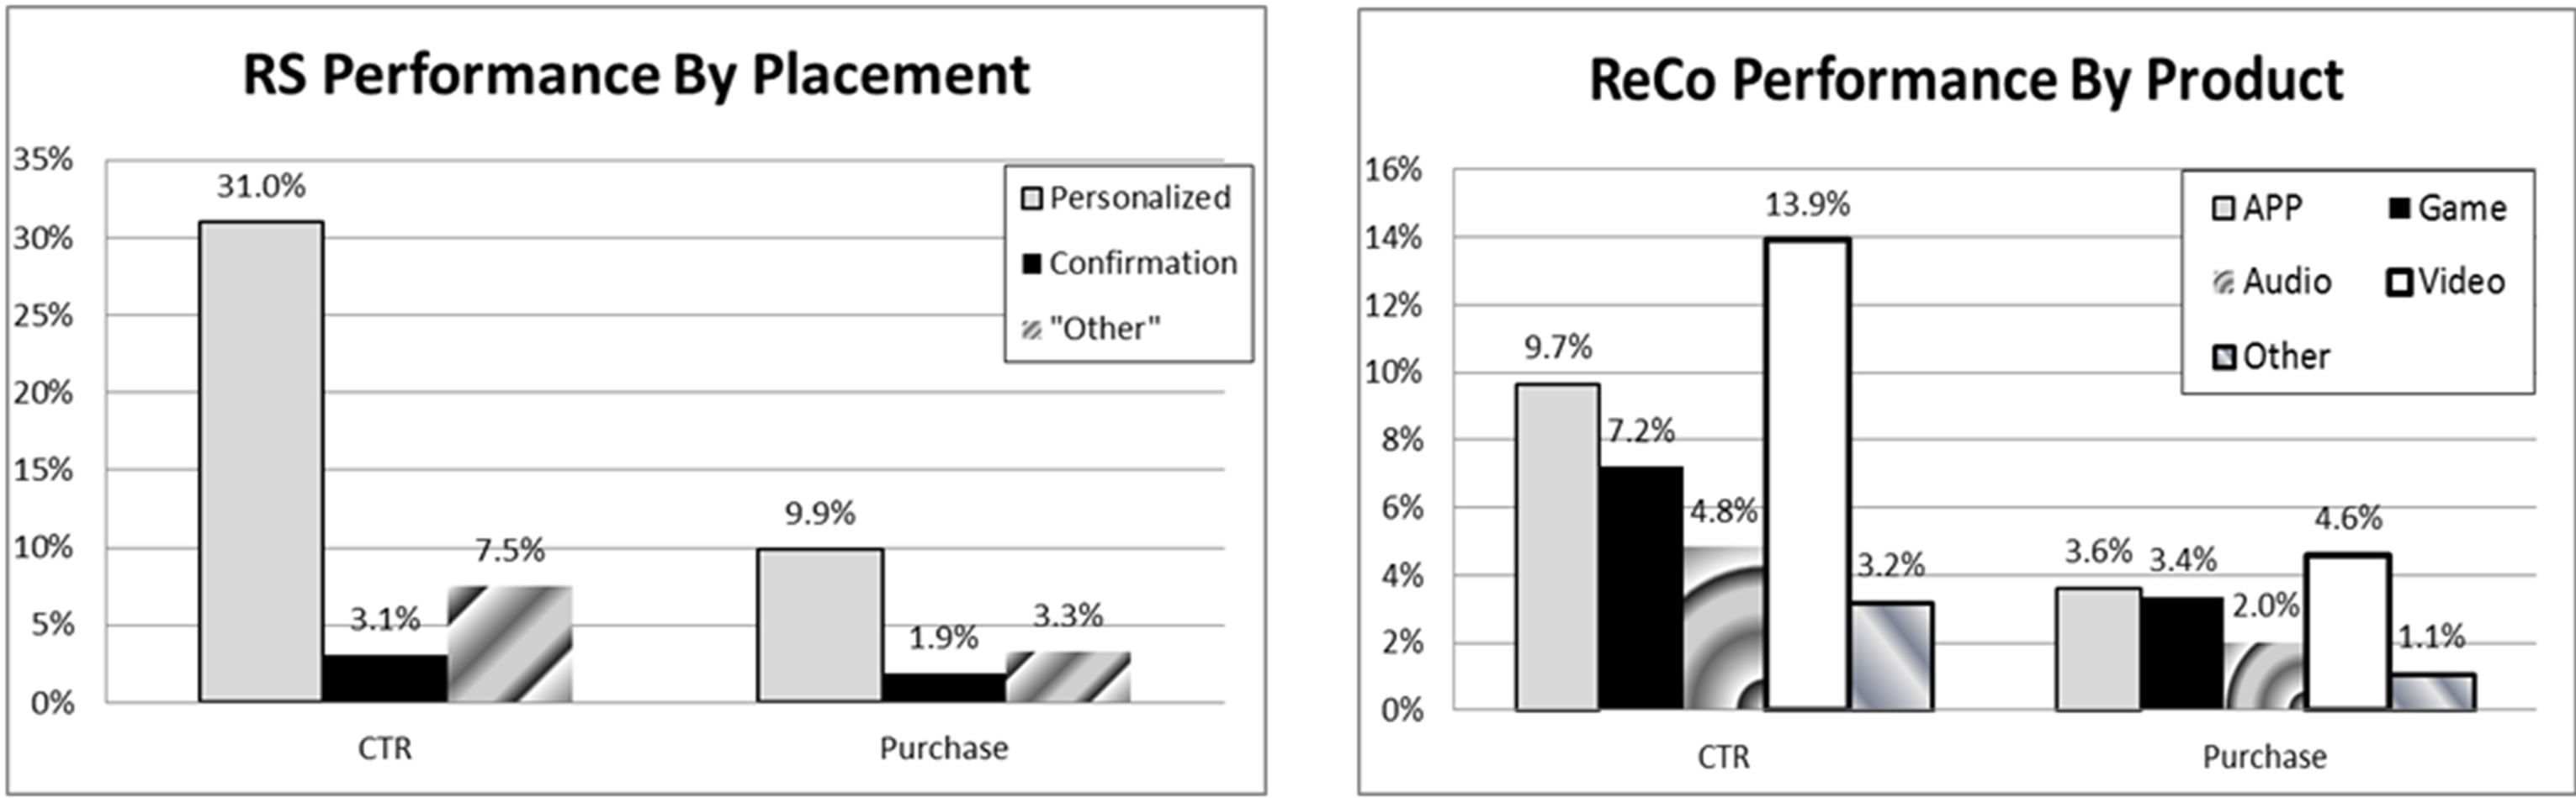
Figure 12. ReCo lift by placement and product.
4.1.2. Lift for Enhanced Version of Hybrid ReCo
We now look at some results of the newer version of ReCo which was developed after delivery of the client version. The enhanced version of the ReCo will have separate recommendations generated by purchase (as in previous section), browse (which browsed events prior ro purchase suggest a subsequent purchase) and user (user segments). This enhanced version has not yet been deployed; as a result, the performance analysis described will be statistical in nature (rather than lift analysis as in the previous section).
For this enhanced version, we employed a bootstrapping technique as follows: we selected a sample of 1,000,000 users from which we used 800,000 randomly selected users as a testing sample. We then built Purchase, Browsing, and User ReCo’s from this sample to predict the remaining 200,000 hold-out users. This process was repeated five times and correct predictions plotted for three cases: All Purchasers, Multiple Purchasers (Purchases > 1), and Single Purchasers (Purchases = 1). Figure 13 shows the percentage of correct predictions in each case for each sample. Note that for single purchasers, there can be no purchased-based predictions; so a purchased-based CF correctly predicts no purchases for these customers. As demonstrated in the Figure 5, Browse and User CFs can in principle improve predictions in the “cold-start” case.
4.2. Integrating the ReCo’s
Another area of ReCo evaluation is to analyze which of the three ReCo’s: purchase, browse, and user are better recommenders, and examine various weighting schemes to combine them. Figure 6 shows a few cases for one of the five trials presented above. Correct predictions increased by between 3% - 5%. Of the increase in correct predictions, single-purchasers were predicted correctly less than 1% of the time; this accounted for only about 5% - 10% (depending on simulation) of the increase in correct predictions. (Recall that purchase-based ReCo cannot predict correctly for single purchase users.) The improvements in performance were rather modest; especially for the User ReCo. We believe this primarily related to the size of the user segments utilized. (Recall that user CF could not be generated within given time and hardware restrictions; user segments were created instead.)
In addition to weights, frequency adjustments were tested, e.g., if same item was recommended by more than one ReCo, then its index was increased to reflect the “independent” collaboration. In the previous weighting methodology, appearance in more than one ReCo was not relevant to the weighting calculation and hence final ranking. In frequency adjustment, weighting was increased arbitrary percentage; as a result, final ranking was affected by frequency of the item across the 3 ReCos. Several factors were tested (similar to weighting alternatives in Figure 14), depending on specific adjustments and the particular simulation, this led to a further increase in the percentage of correct hits in the 4% - 6% range.
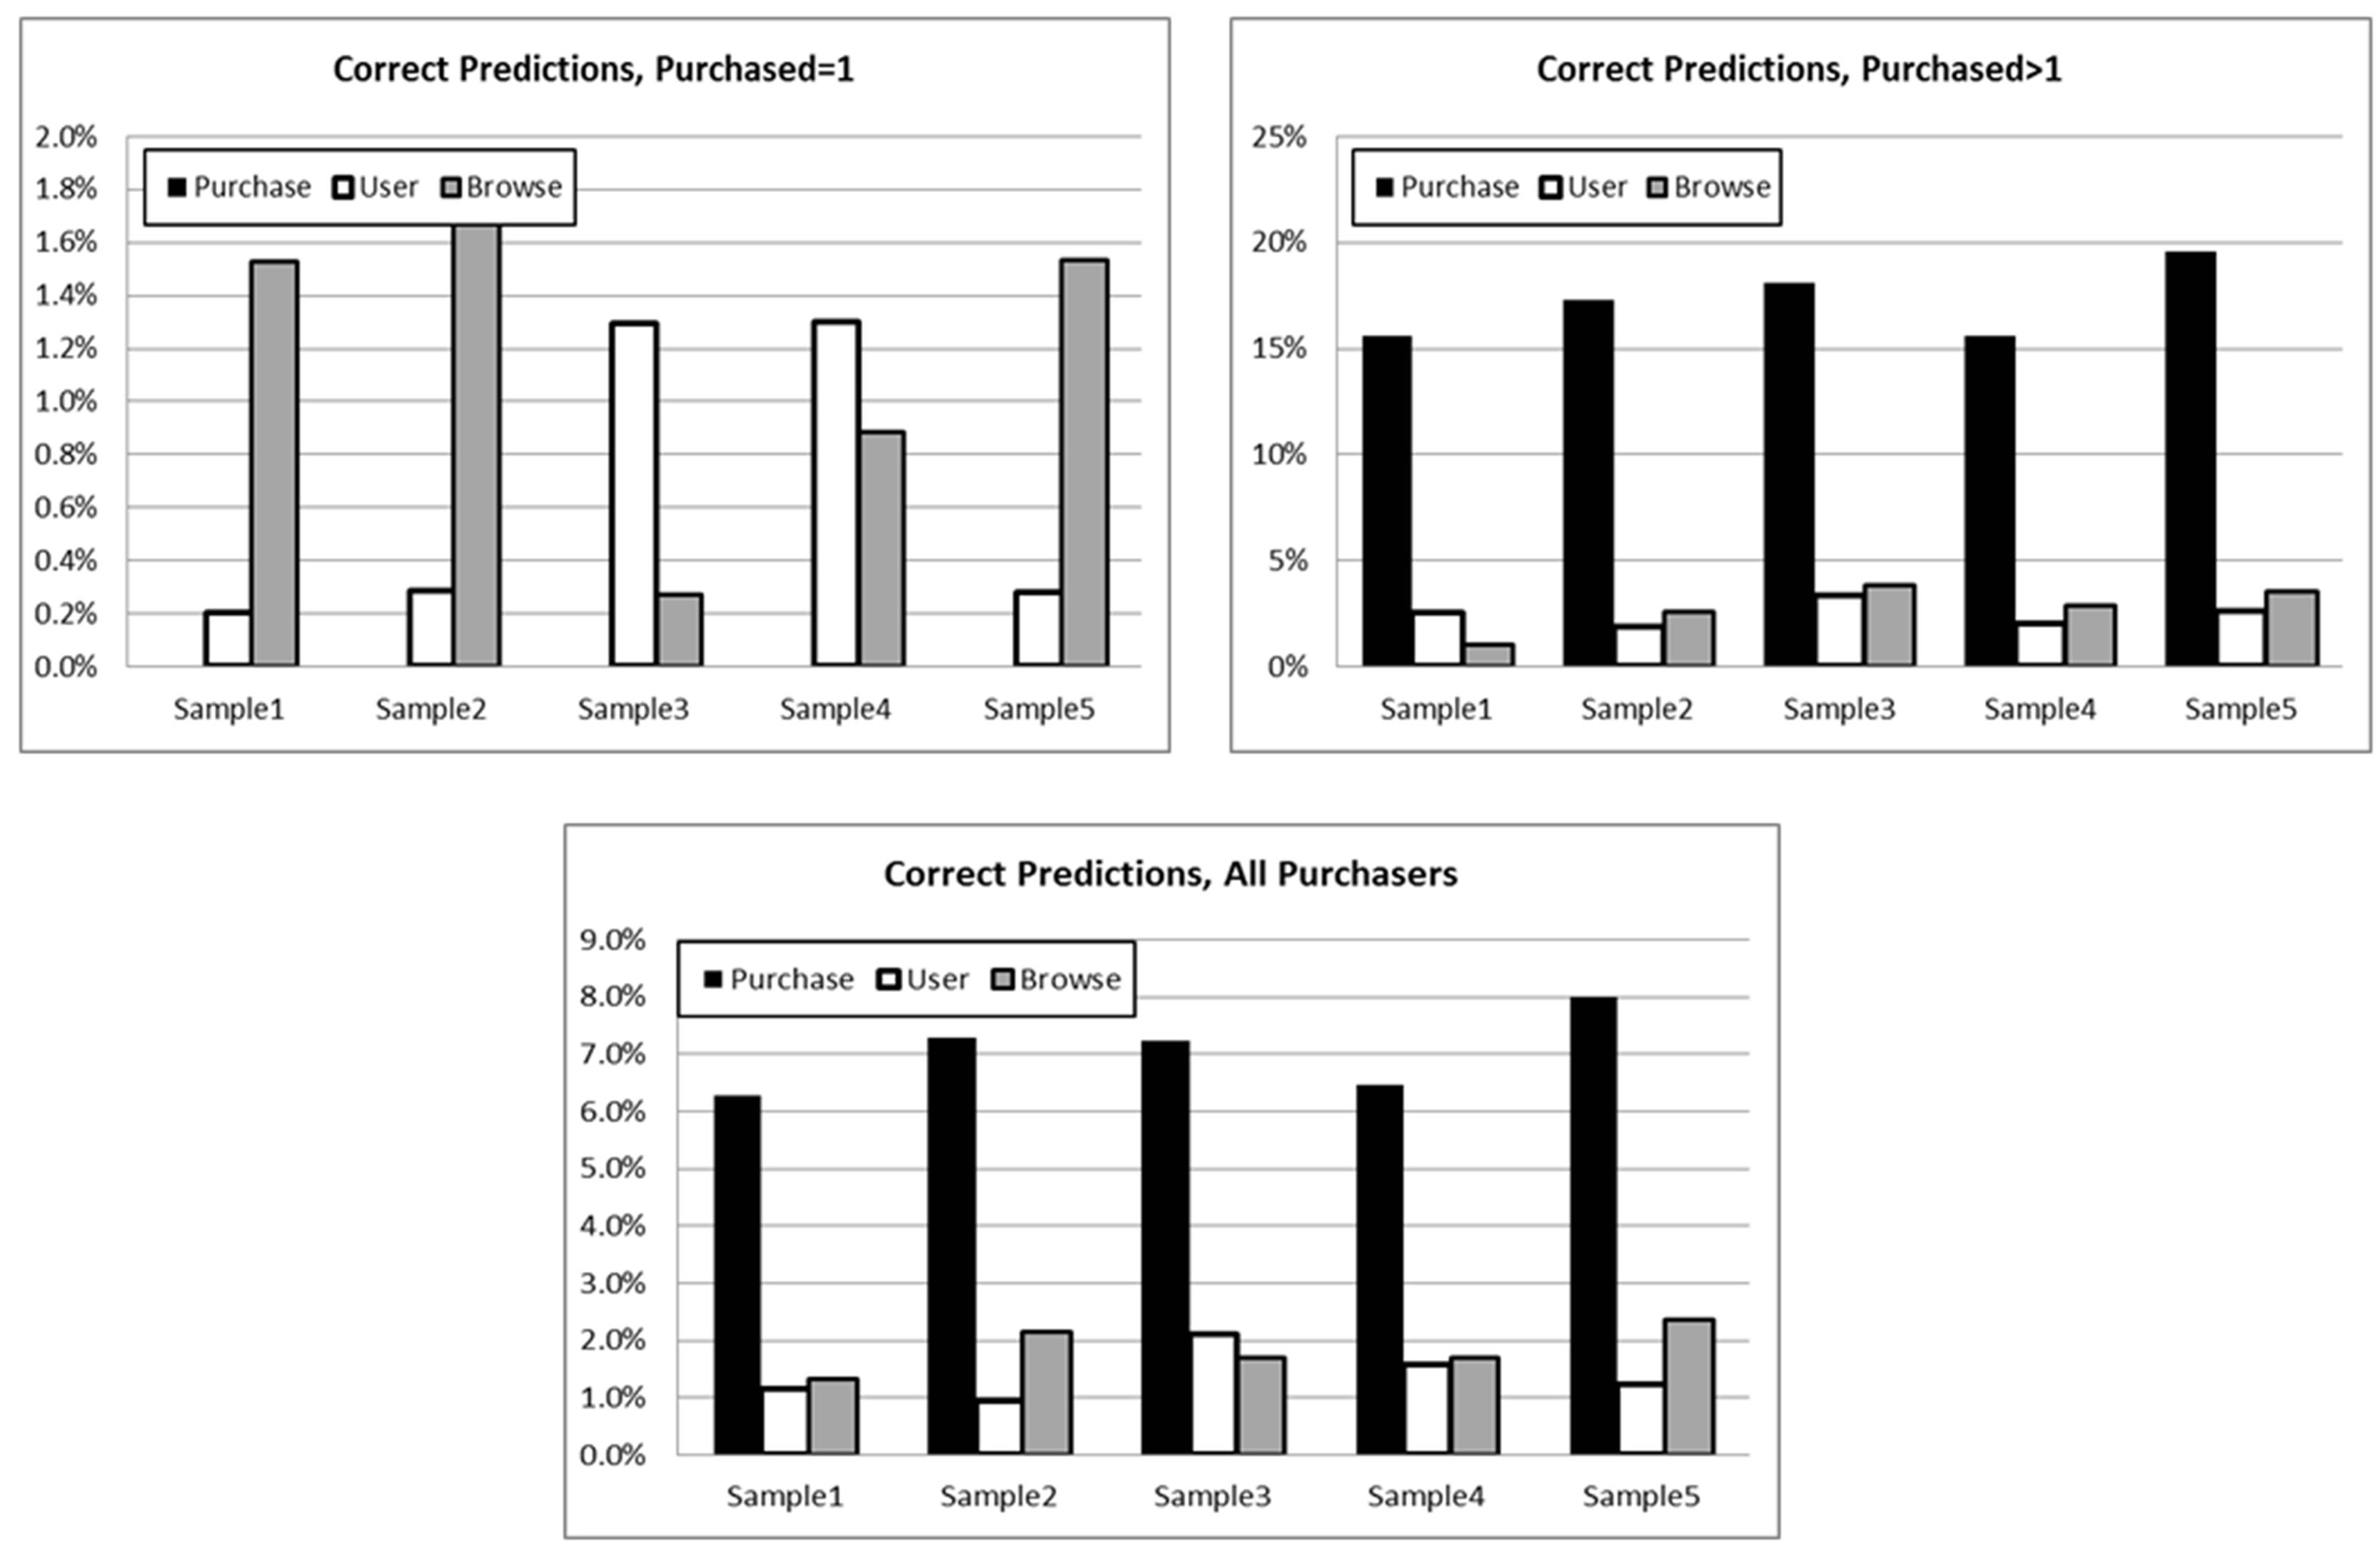
Figure 13. Bootstrapping samples for enhanced ReCo.
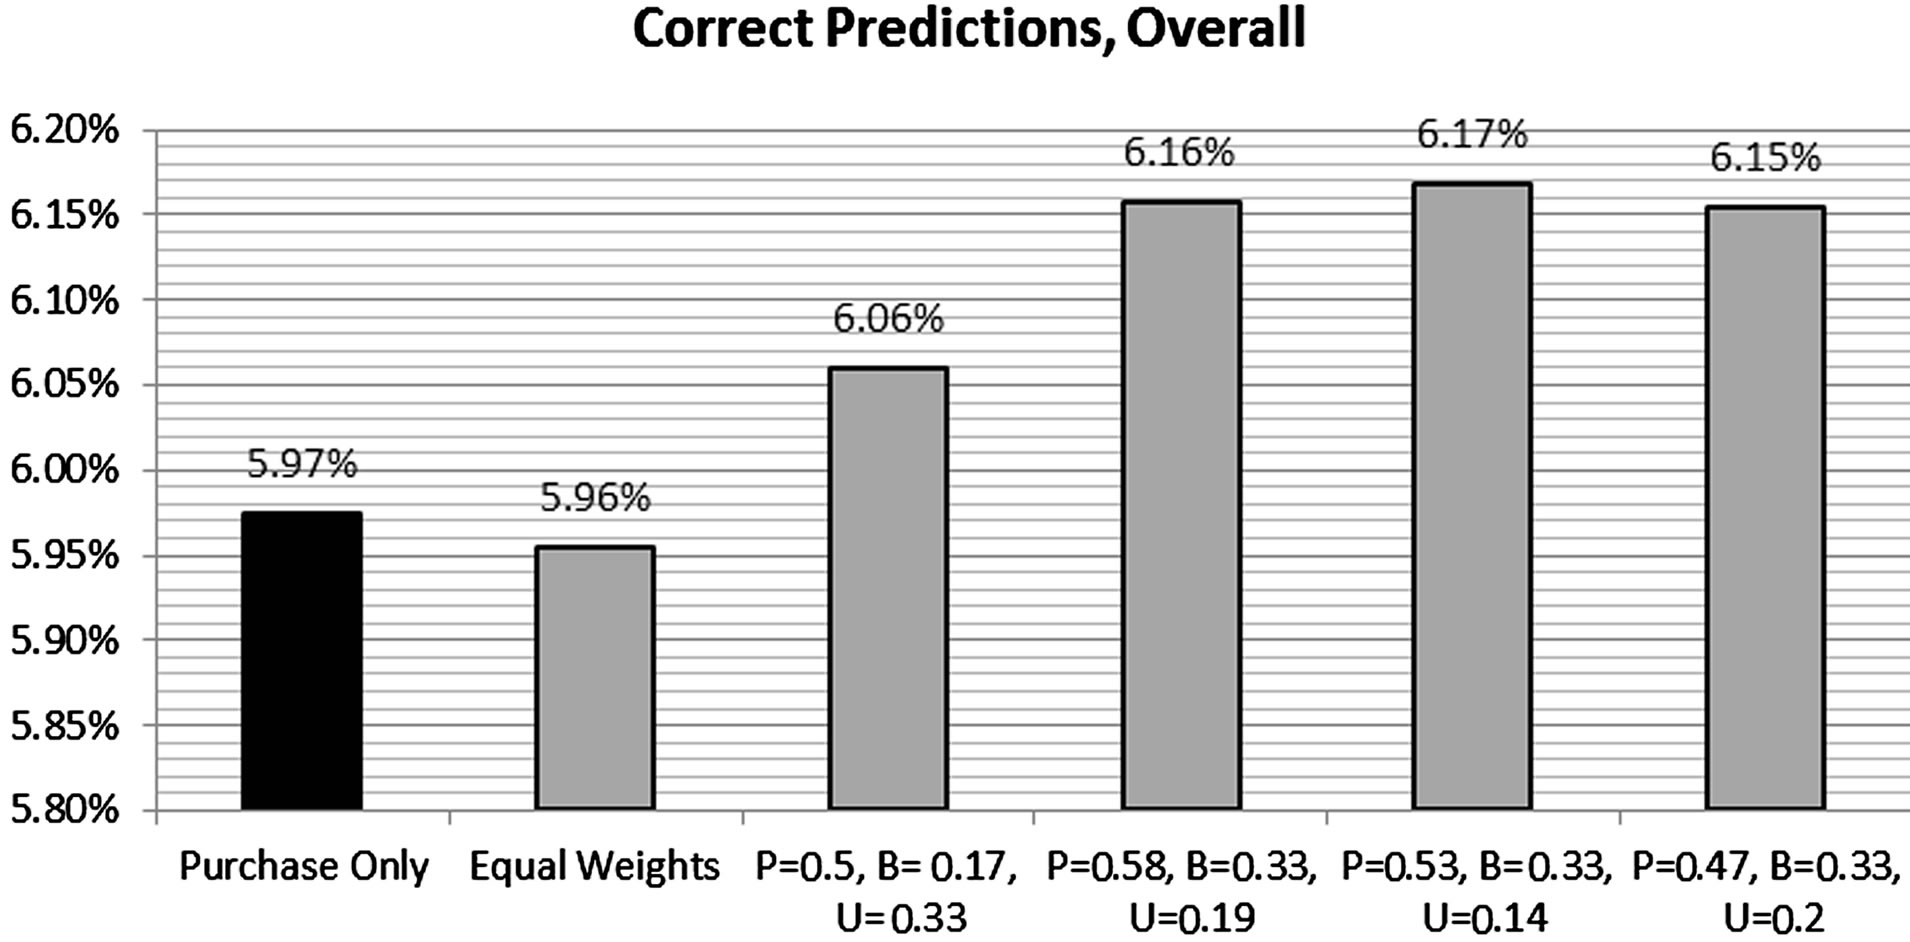
Figure 14. Various weighting schemes for Purchase (P), Browse (B) and User (U) ReCo’s.
We can also track how well sort-order of recommendations track correct predictions. Figure 15 shows how the top recommendations compare with lower recommendations in terms of correct predictions. We see the highest-ranked recommendation accounts for over 20% of the total correct predictions, while the tenth (lowest-ranked) accounts for less than 5% of correct predictions. This is likely very important in actual ReCo performance. Due to the small size of mobile screens, only a limited number of recommendations can be displayed without some user input. For example, a specific request may only have enough real-estate to display three recommendations. The user would have to “page down” to see the next 3 recommendations (and so on). As a result, users may frequently only see a subset of recommendations made for them.
In summary, we can say that results strongly suggest that ReCo satisfies two of the stated objectives of increasing overall revenues and customer satisfaction. For one client (for which data was available), ReCo increased revenues by over $1M monthly by the sixth month of operation. In this case, ReCo services were utilized in just about 20% of the cases where ReCo could have been utilized; assuming the same performance if ReCo were utilized throughout the system, this suggests an increase in revenues of over $5M per month. Although we don’t have available an unambiguous measure for customer loyalty, the increase in number of frequent purchasers (over 30% of ReCo-purchases were from frequent buyers) and the increase of frequent purchasers (7% of ReCo purchases pushed user into the frequent buyers segment) indicates improved customer loyalty.
5. Extensions to ReCo
ReCo is a first implementation of a more generalized mobile service system we envision and are implementing for mobile media marketplaces. This section describes the enhancements we are making by extending RS to mobile customer targeting applications, and a high level view of the requisite “big data” architecture required to develop RS generators as marketing services.
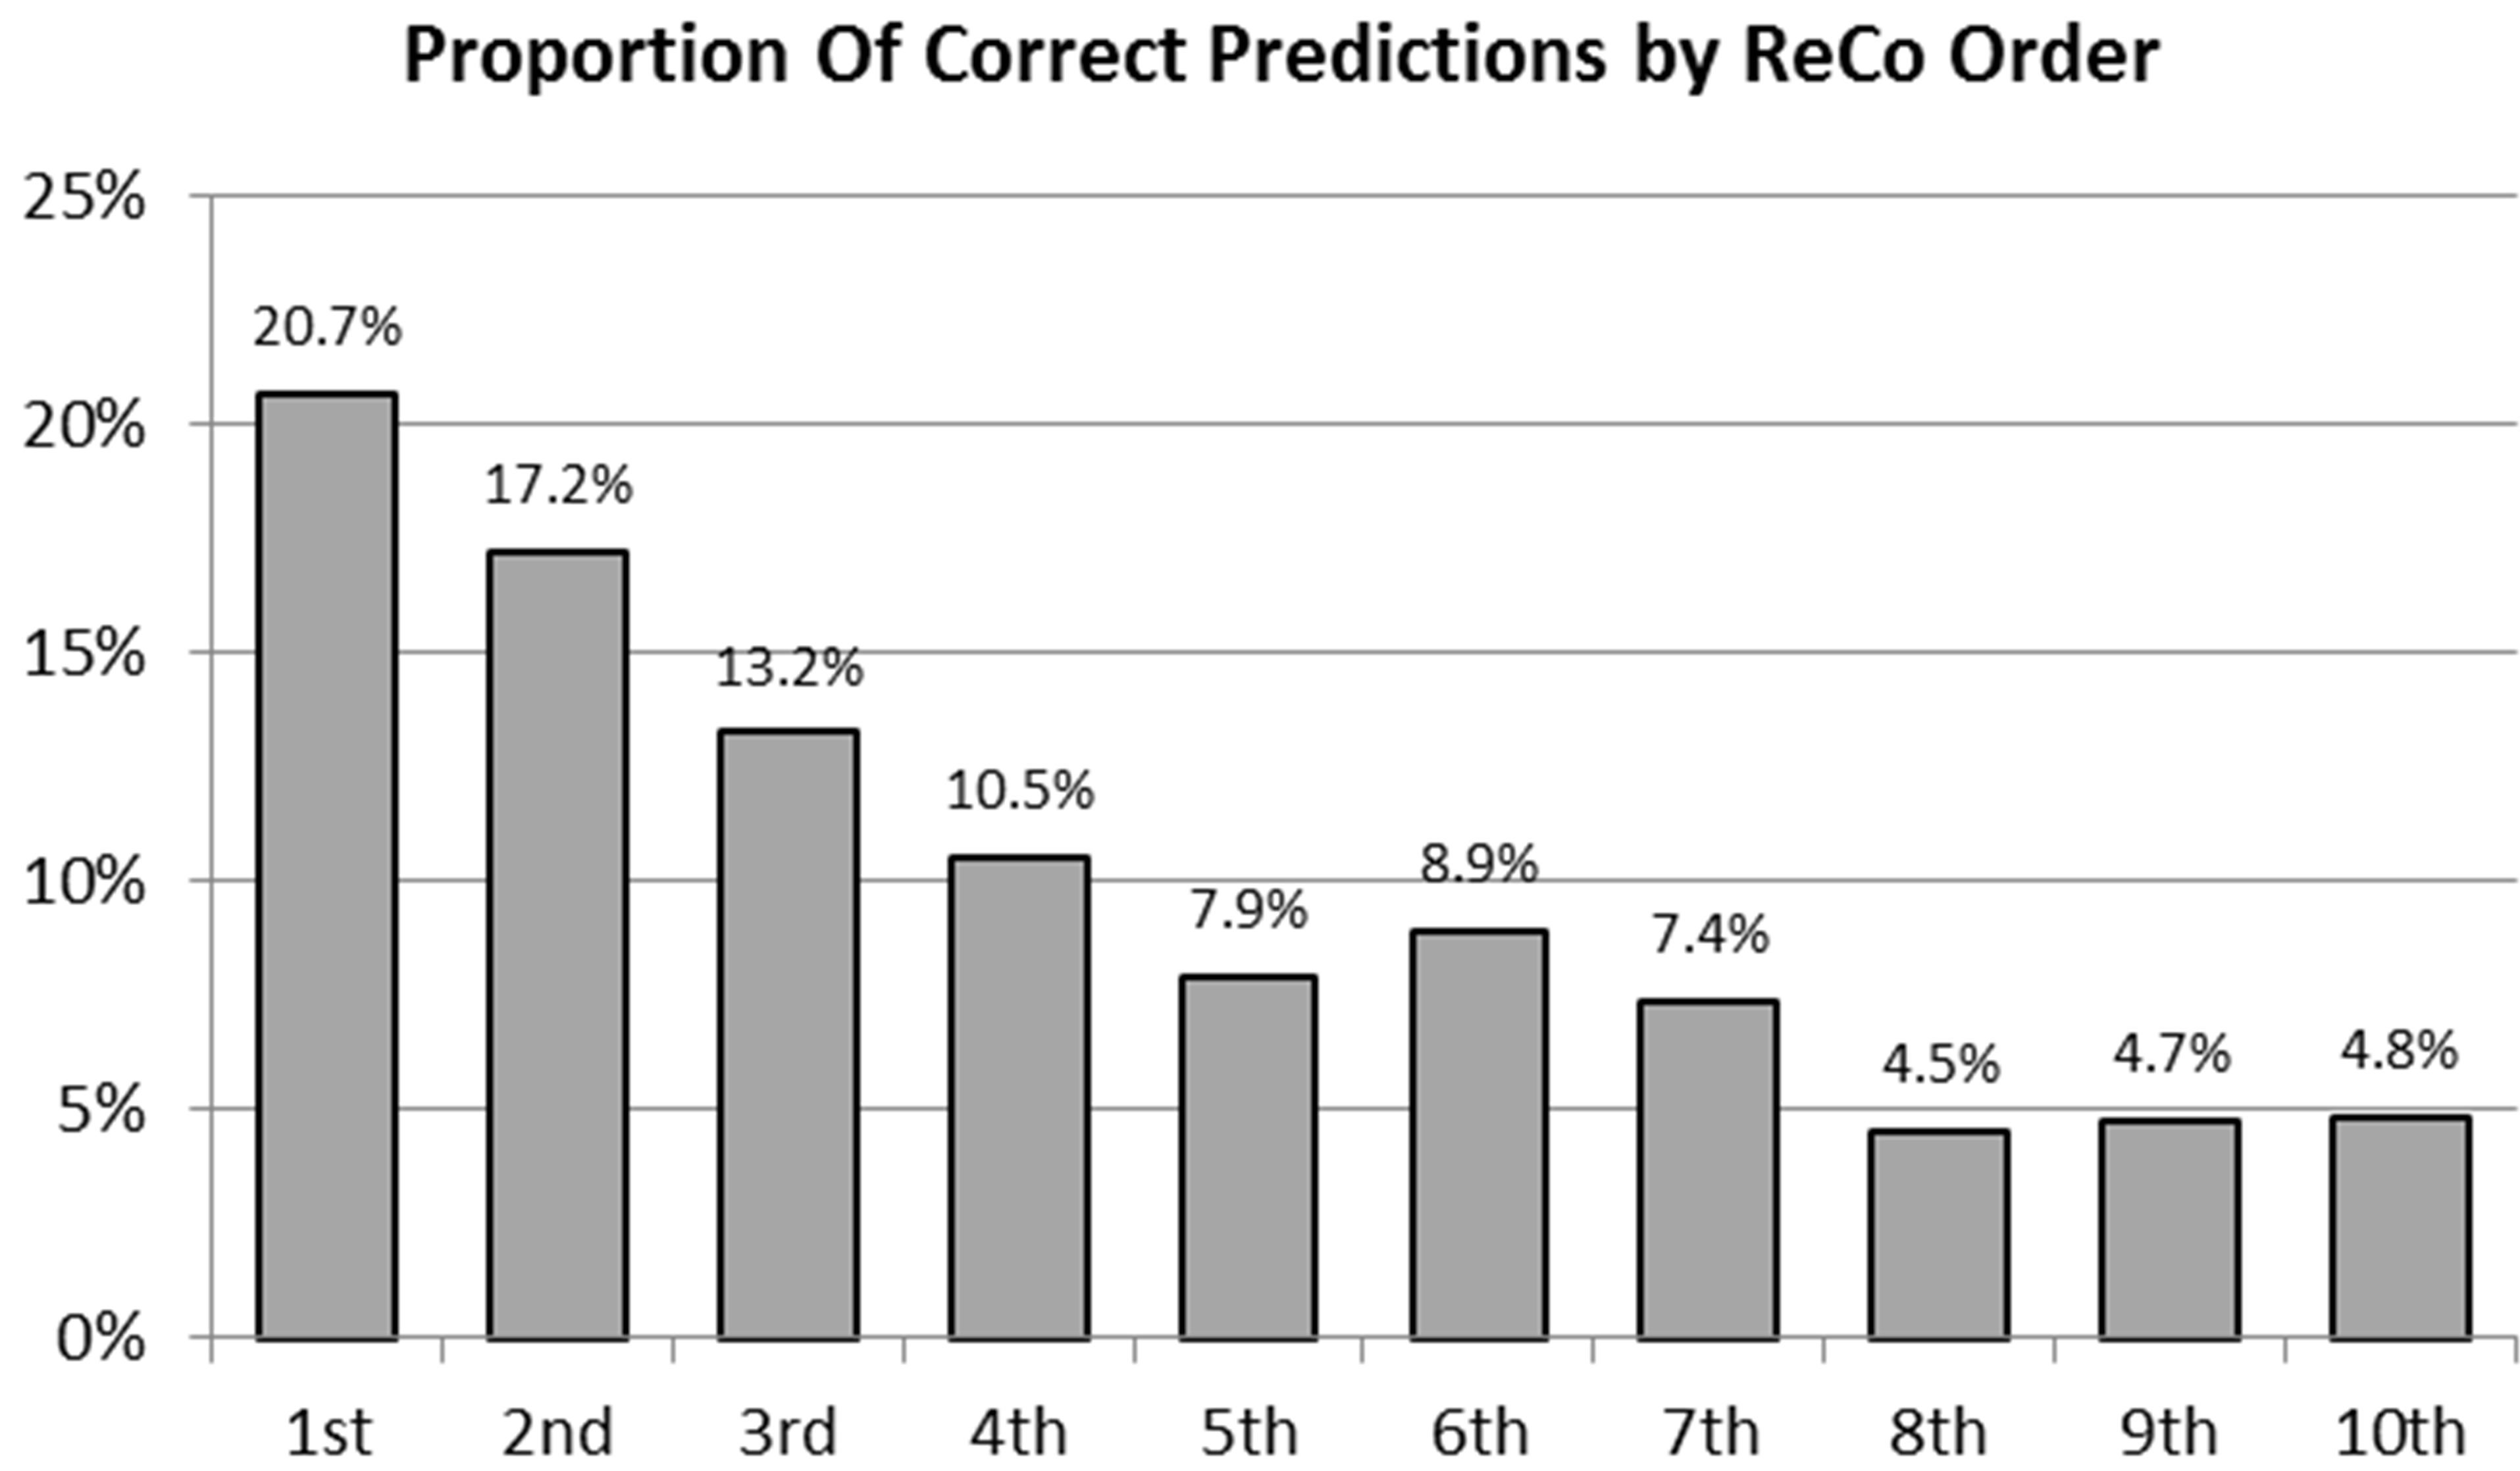
Figure 15. Correct predictions by recommendation ranking.
5.1. RS as Customer Targeting Service: Automated Modeling
In addition to product recommendations, RS can also provide robust customer targeting services to clients. Customer targeting (hereafter referred to as simply “targeting”) has been shown to be effective in increasing response rates for various marketing campaigns [16-19]. Whereas in this paper we have focused on automated recommendation for users, identifying products and services we predict they may want to buy, targeting considers the inverse of the ReCo RS situation and asks, “for specific products or services, which customers are most likely to purchase them?” The problem we address in this context is to provide a market service recommending who to target for mobile media advertisements. This is a considerably more difficult challenge since we are looking beyond just individual purchasing behavior to include additional consumer attributes that try to capture proxies for individual utility functions.
Our approach to mobile media targeting is decidedly more dynamic than the Carrier ReCo we have described herein. To provide a basis for comparison, Figure 16 shows a high level schematic for the CF-based recommendation engine used in Carrier ReCo. There are two major temporal components, periodic and real-time, which correspond to the automated modeling and ReCo user interaction functions respectively, and which comprise the basic model feedback loop of the overall system. Since user data is highly volatile as the result of users browsing and/or purchasing relevant items, it is necessary to rerun the CF models periodically to synchronize with these data updates. Failure to do so may result in pushing recommendations for items which users have already purchased. Two major services are shown in the diagram. The Ingest or service essentially monitors the data volatility in the source flat files, periodically updates the model database discussed above (Staging phase), and reruns the collaborative filtering algorithms (Automated Modeling phase) resulting in a new set of filters. The Suggest or service uses these filters in concert with any
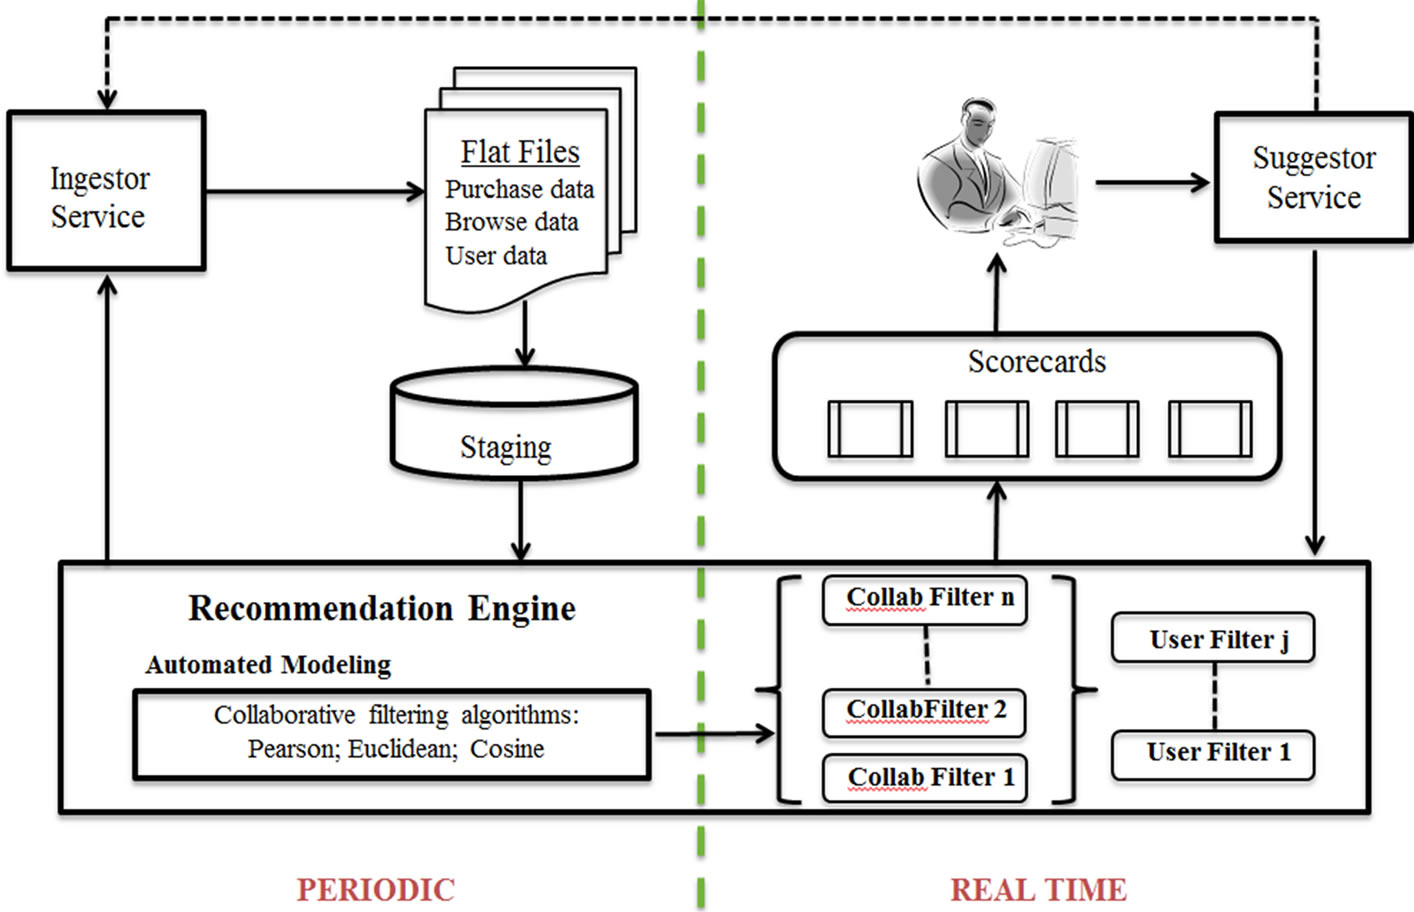
Figure 16. Automated recommendation architecture for CF-based ReCo.
user-specified constraint filters (e.g., “don’t consider any products from Vendor X”) to present current Scorecard recommendations to users. Any subsequent purchases or browsing done by the user is relayed in real time to the Ingestor service.
Customer targeting on the other hand requires that we adjust the targeting set dynamically as an advertising campaign unfolds allowing us to monitor who is responding to the ads in real time and making changes to the targeting model “on the fly” if and when required. Although we employ the same basic ReCo architecture as shown in Figure 16, this application requires a more sophisticated recommendation engine including a transition from traditional dimensional data management to advanced “big data” techniques (Figure 17). Specifically, we implement discrete choice econometric models using both logistic and multinomial logistic regressions as the automated modeling component for initially identifying customers, coupled with a near real time, data-driven model feedback loop which monitors the ongoing progress of a campaign and periodically updates the initial model to reflect actual “in-line” consumption.
This application differs from the Carrier ReCo in several important ways. First, the analytical models are more sophisticated. Discrete choice models are employed to predict whether a particular individual is likely to click through a mobile ad appearing on his/her mobile device. To make these predictions, models generally require considerably more detailed user demographic attributes which significantly increases the data collection effort. Once the relevant data are collected, it is then necessary to determine from the population of user attributes which ones are statistically meaningful independent variables. Further complicating the process, the set of significant independent variables may change as the advertising campaign progresses and we can examine who is actually clicking through the ad and who is not. One of the consequences of this is that the feedback loop is much more dynamic and therefore much tighter in this application than with the CF-based ReCo. Typically the targeting model is recalibrated every 4 - 5 hours as opposed to the 24 hour refresh interval used in ReCo.
The details of this mobile media model management environment blending automated modeling, real-time model feedback loops and RS technology are the subject of ongoing research. The ReCo project we have described has laid important groundwork as we investigate how to leverage automated modeling technology and big data to enable more effective service system management and engineering.
5.2. RS Generators: Mobile Media and “Big Data”
In order to provide RS as a software marketing service to clients, it is desirable to make this architecture as reusable and open as possible [20]. As mentioned earlier, RS tend to be application-specific and proprietary in nature, and there is little attention in the literature to the generalization of these systems to enhance reusability. In this section, we sketch some ideas for developing a RS generator (RSG) environment which can be quickly adapted to specific application domains and requirements, and therefore be more readily employed as a mobile marketing service.
Perhaps the defining characteristic of the RS we are describing is the immense size of the underlying databases coupled with the very high degree of volatility these databases undergo. RS client databases will of course vary widely from company to company but they can be transformed into a relatively simple and general schema, or meta-model, based upon the many-to-many relationship between users and items (Figure 18). However, due to the potentially billions of signals per day generated within the mobile advertising ecosystem, traditional dimensional data management models are illequipped to store and manage the large volume of data directed to the predictive models described above. Rather it is necessary to resort to highly parallel and distributed computing techniques.
Our approach adopts a big data solution that uses the following dynamic distributed database technology:
• Apache HadoopTM is an open-source software framework that supports data-intensive distributed applications. Hadoop implements a high degree of parallel computation via Map Reduce framework which divides an application into many small fragments of work, and may be run simultaneously on any computer nodes in the network. Another feature of Hadoop is the Hadoop Distributed File System (HDFS) enabling the distribution of data across the data nodes of the network complementing the distribution of the application. Hadoop enables applications to work in parallel with effectively unlimited numbers of computation-independent computers and extremely large volumes of data.
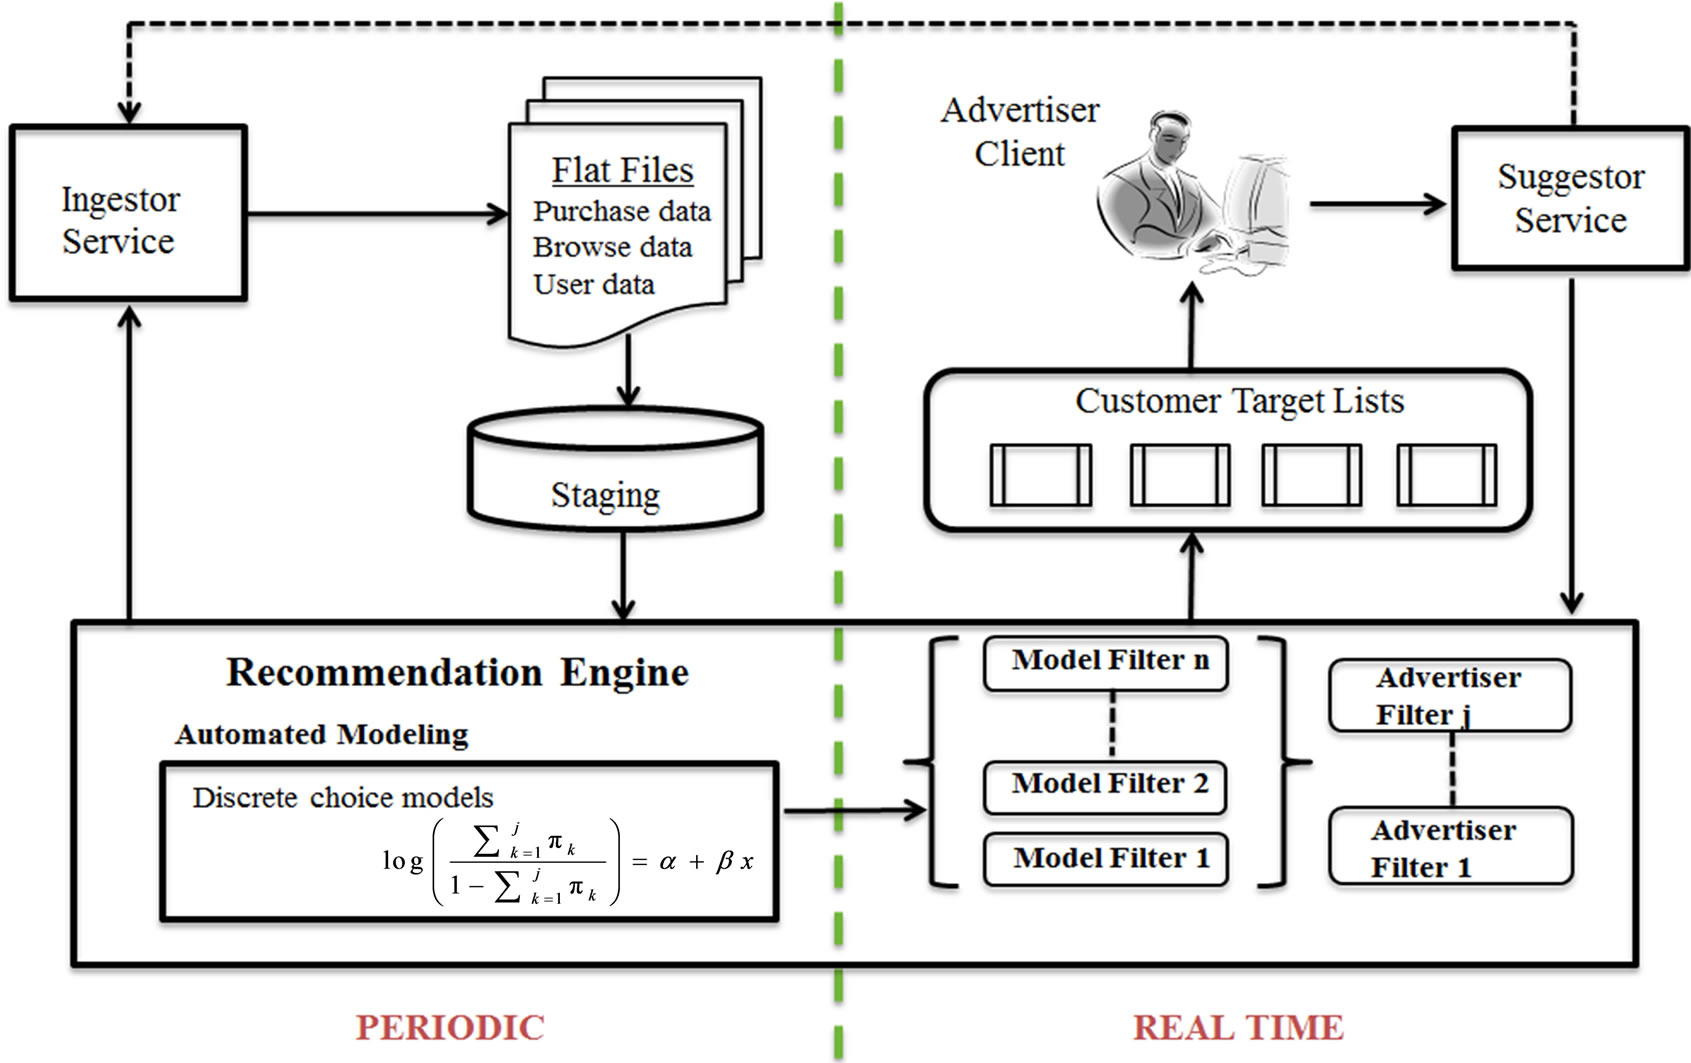
Figure 17. Automating customer targeting using econometric models.
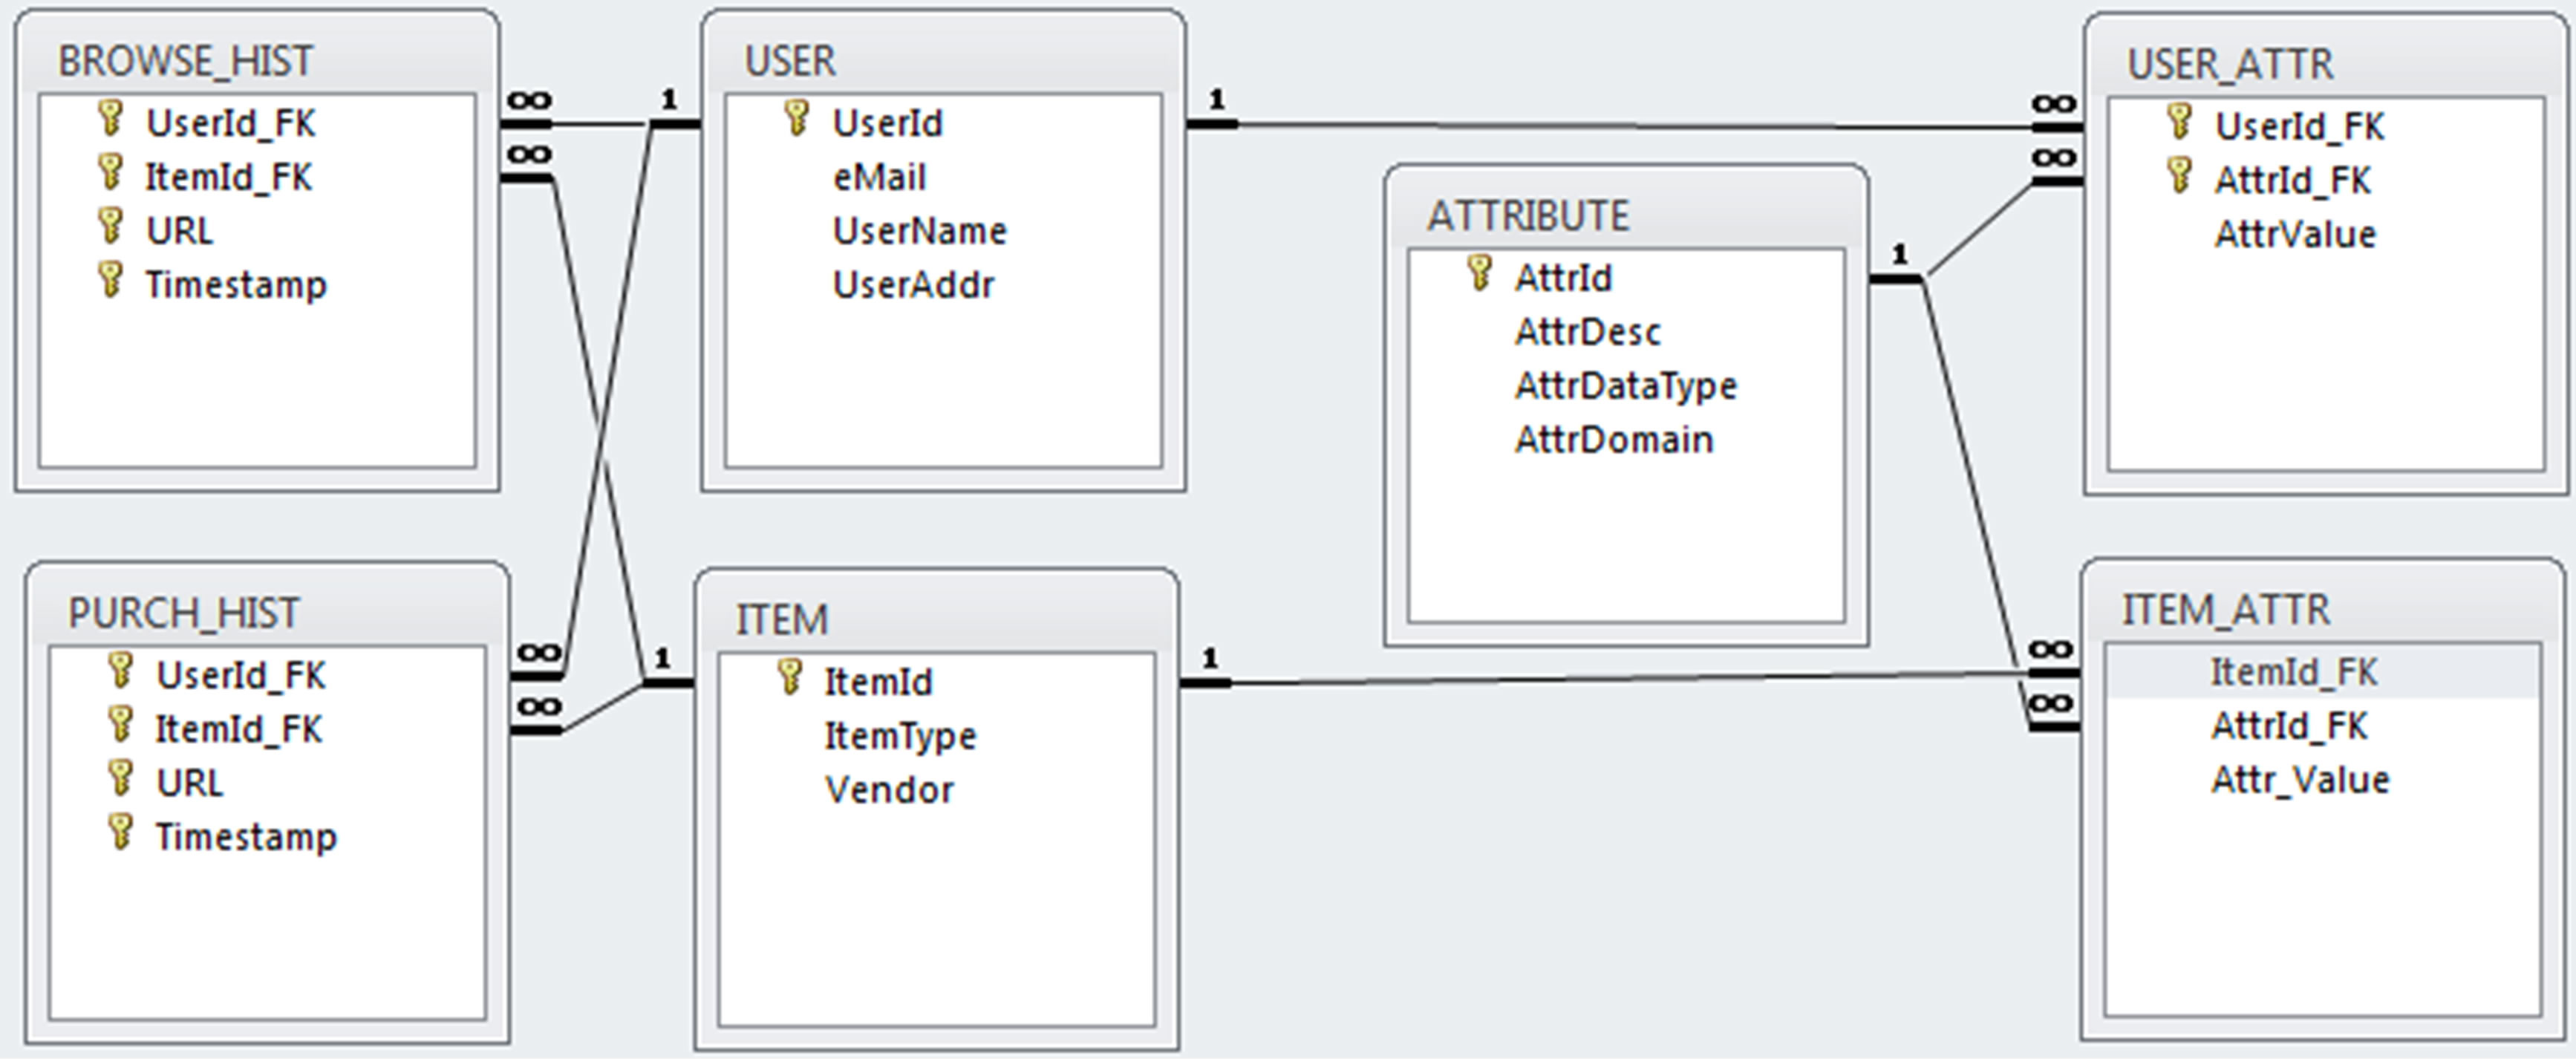
Figure 18. Simplified user-item and user-attribute database schema for CF-based ReCo.
• Map Reduce is a framework for processing very large data sets using parallel, distributed algorithms across a large number of computer nodes known as a cluster. The overall Map Reduce infrastructure coordinates the distributed servers, managing parallel tasks, communications and data transfers. The key benefits of this framework are scalability and fault-tolerance across a variety of applications achieved by optimizing the execution engine once.
• Pig is a high-level platform for creating Map Reduce programs used with Hadoop. The language for this platform is called Pig Latin which is essentially the Map Reduce equivalent of SQL in the RDBMS world. Pig allows programmers more latitude in designing queries than SQL and is especially useful in the ETL (Extract, Transform and Load) operation which converts data from source databases into the Hive data warehouse infrastructure described below.
• Apache Hive is a data warehouse infrastructure built on top of Hadoop that facilitates the familiar warehouse functions of data drill down and aggregation, standard database queries (via HiveQL), and analysis such as cross-tabulations. The schema shown in Figure 18 would be implemented in Hive in this environment.
Without delving further into the architectural details of the implementation, we can summarize our architecture as consisting of the Hive data warehouse infrastructure, the Map Reduce programming model, and the Pig platform for creating Map Reduce programs to perform ETL operations, data synthesis and feature selection on the very large numbers of data signals stored in log files on a Hadoop Distributed File System (HDFS). This approach allows us to preserve the integrity of the dimensional data model while minimizing the amount of rework necessary in other software components and services.
In addition to the data dimension of an RSG, we must also consider the model management requirements for manipulating the data. Typically analytical models tend to be much less volatile than data. However the systems we are discussing are dynamic data-driven feedback systems requiring that RSGs not only periodically update their underlying databases to align with the associated data sources, but determine an optimal or near-optimal refresh time as well. Secondly, the associated analytical models must adapt quickly to the changes in the environment. Adaptive modeling in this context may require the model to change in near real-time with the data which in turn reflects customer activity in the mobile marketplace. Currently our ReCo recommendation refresh time is 24 hours, but situations demanding more stringent refresh intervals for RS are becoming more prevalent. As we indicate in our discussion of future extensions, this leads to a stronger requirement for automated modeling.
The analytical models in ReCo are straightforward applications of similarity measures and, as such, are fairly simple. However they must be applied every time the databases are refreshed, and in so doing, it may be that a different similarity measure outperforms the others in contrast to previous computations. A simple weighting scheme of the measures applied can be calculated which in turn may have a subtle effect on the resultant recommendation set. Because there was little difference between the three measures used in ReCo, we would expect a negligible effect in our case.
As we indicated in the Introduction, there is a wide array of techniques that can be applied to RS including collaborative filtering, econometric models, and a portfolio of statistical clustering models (see Table 4). These are familiar methods frequently used in data mining so an integral component of an RSG is a model library of these predictive analytics, perhaps in the form of a library of reusable methods.
Display management is a more customized artifact
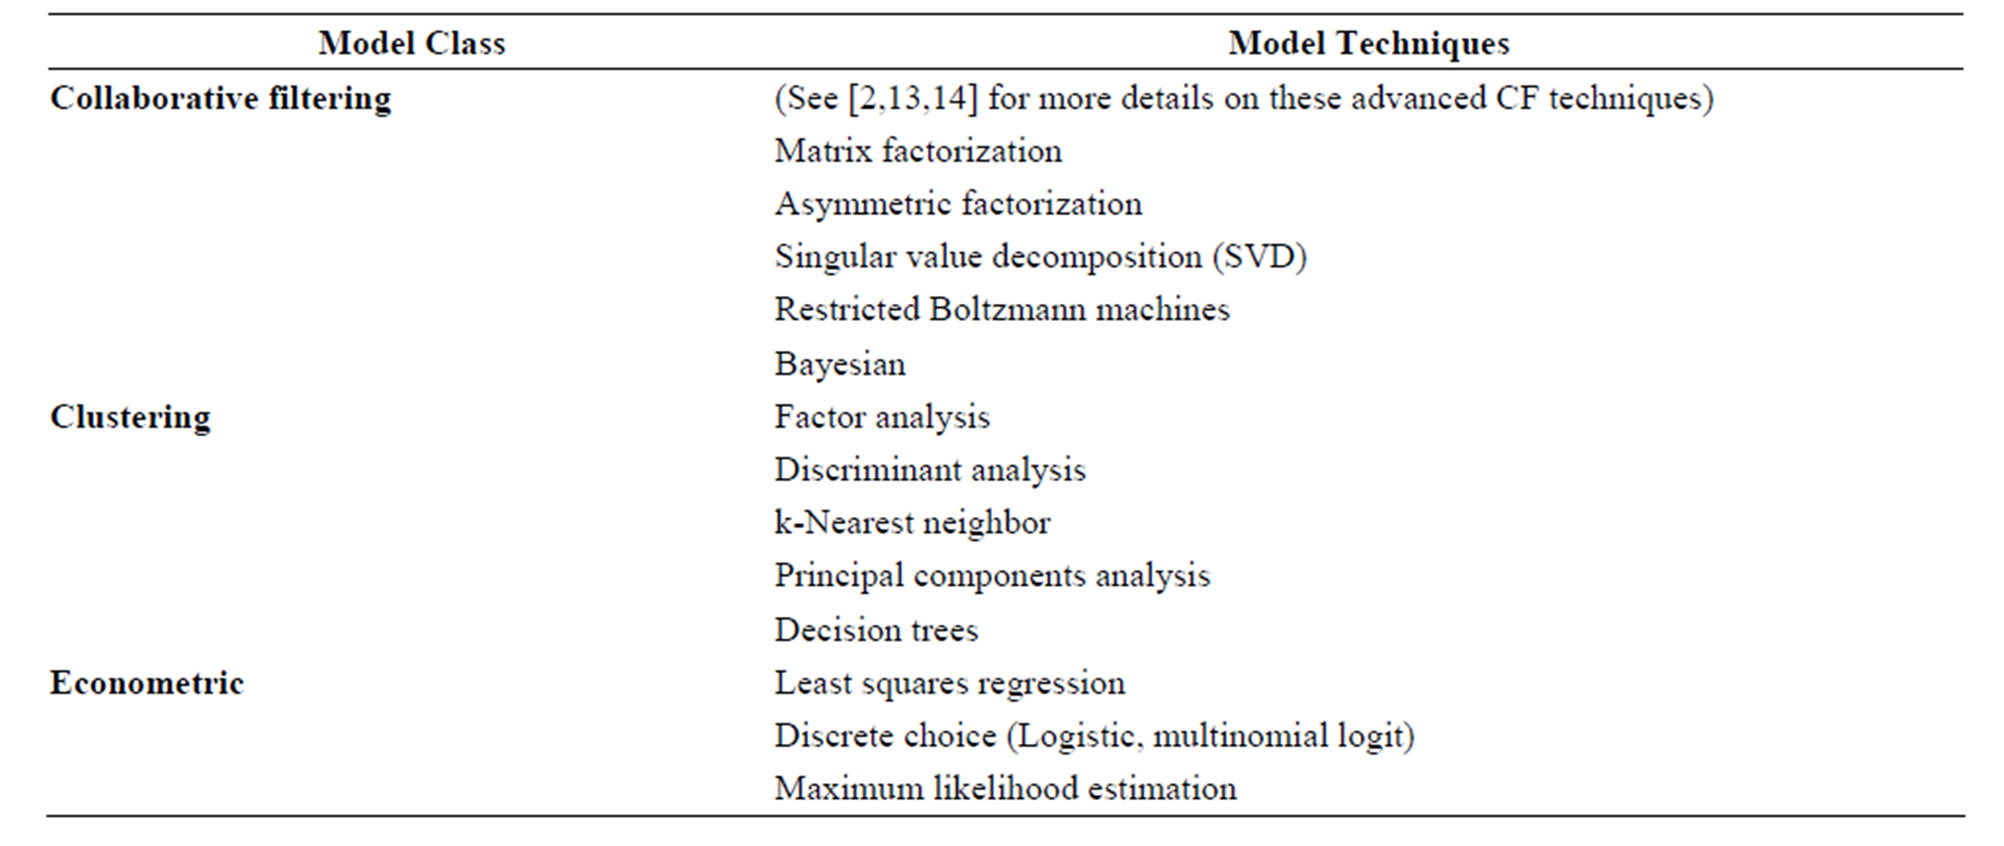
Table 4. Sample of predictive analytic models for RS model library.
conforming to client requirements and desires. Most RS provide simple ranked displays of recommendations ordered from top to bottom with hot links to the products themselves for user browsing. ReCo is similarly designed with its recommendations shown in scorecards ranked from top to bottom.
We have outlined at a high level some steps we have taken to generalize RS architecture so that specific systems can be developed and deployed rapidly as a mobile marketing service for clients. This entails facilitating a high degree of parallel computation and distributed data management to deal with the very large size and high volatility of the related databases, as well as flexible decision analytics to address the tightly constrained feedback-driven nature of mobile applications.
6. Summary and Contribution
We have set out in this paper to introduce the concept of RS as a valuable marketing service. We have presented a case study of a collaboration filtering-based recommender system, ReCo, for increasing revenues, customer satisfaction and customer loyalty for a large telecommunications carrier. Although a relatively simple system, the lift in purchases and revenues resulting from ReCo in our analysis justifies its value as a marketing service.
We have presented a recommender system architecture used in developing ReCo which we believe that it can be generalized to increase reusability from a software engineering perspective. Unique characteristics of this RS Generator approach are the centrality of automated modeling in combination with dynamic “near real-time” modeling feedback loops. We have indicated how components can be generalized into RSG for quick development of specific applications which can be provided as a market service, especially to companies with large product lines and/or customer base.
To bolster our case, we have additionally suggested how our approach can be tailored within the same framework using advanced adaptive modeling and feedback loops to provide powerful customer targeting services for mobile media advertising.
Then, our major contribution is having shown how data-intensive but analytically simple CF-based ReCos can be engineered into the valuable marketing service instruments, both for RS and for customer targeting purposes in the mobile media world.
REFERENCES
- Y. Koren, R. Bell and C. Volinsky, “Matrix Factorization Techniques for Recommender Systems,” IEEE Computer, Vol. 42, No. 6, 2009, pp. 42-49.
- F. Ricci, L. Rokach, B. Shapira and P. B. Kantor, “Introduction to Recommender Systems Handbook,” In: F. Ricci, L. Rokach, B. Shapira and P. B. Kantor, Recommender Systems Handbook, Springer, Berlin, 2011, pp. 1-35. http://dx.doi.org/10.1007/978-0-387-85820-3_1
- G. Adomavicius and A. Tuzhilin, “Toward the Next Generation of Recommender Systems: A Survey of the Stateof-the-Art and Possible Extensions,” IEEE Transactions on Knowledge and Data Engineering, Vol. 17, No. 6, 2005, pp. 734-749. http://dx.doi.org/10.1109/TKDE.2005.99
- D. Jannach, M. Zanker, A. Felfernig and G. Friedrich. “Recommender Systems: An Introduction,” Cambridge University Press, Cambridge, 2010. http://dx.doi.org/10.1017/CBO9780511763113
- P. Melville and V. Sindhwani, “Recommender Systems,” In: C. Sammut and G. Webb, Eds., Encyclopedia of Machine Learning, Springer, Berlin, 2010, pp. 829-838.
- P. Resnick and H. Varian, “Recommender Systems,” Communications of the ACM, Vol. 40, No. 3, 1997, pp. 56-58. http://dx.doi.org/10.1145/245108.245121
- D. Kridel and D. Dolk, “Automated Self-Service Modeling: Predictive Analytics as a Service,” Information Systems for e_Business Management, Vol. 11, No. 1, 2013, pp. 119-140.
- J. L. Herlocker, J. A. Konstan, L. G. Terveen and J. T. Riedl, “Evaluating Collaborative Filtering Recommender Systems,” ACM Transactions on Information Systems, Vol. 22, No. 1, 2004, pp. 5-53. http://dx.doi.org/10.1145/963770.963772
- T. L. Saaty, “Decision Making with the Analytic Hierarchy Process,” International Journal of Services Science, Vol. 1, No. 1, 2008, pp. 83-98. http://dx.doi.org/10.1504/IJSSCI.2008.017590
- H. Kantz, B. Selman and M. Shah, “Referral Web: Combining Social Networks and Collaborative Filtering,” Communications of the ACM, Vol. 40, No. 3, 1997.
- K. Li and T. C. Du, “Building a Targeted Mobile Advertising System for Location-Based Services,” Decision Support Systems, Vol. 54, No. 1, 2012, pp. 1-8. http://dx.doi.org/10.1016/j.dss.2012.02.002
- L. Candillier, F. Meyer and M. Boullé, “Comparing State-of-the-Art Collaborative Filtering Systems,” Proceedings of the 5th International Conference on Machine Learning and Data Mining in Pattern Recognition, Leipzig, 18-20 July 2007, pp. 548-562.
- X. Su and T. Khoshgoftaar, “A Survey of Collaborative Filtering Techniques,” Advances in Artificial Intelligence, Vol. 2009, Article ID: 4214225, 19 Pages.
- B. Sarwar, G. Karypis, J. Konstan and J. Riedl, “ItemBased Collaborative Filtering Recommendation Algorithms,” WWW ’01: Proceedings of the 10th International Conference on World Wide Web, New York, 1-5 May 2001, pp. 285-295.
- K. Tso and L. Schmidt-Thieme, “Empirical Analysis of Attribute-Aware Recommender System Algorithms Using Synthetic Data,” Journal of Computers, Vol. 1, No. 4, 2006, pp. 18-29.
- P. Rossi, R. McCulloch and G. Allenby, “The Value of Purchase History Data in Target Marketing,” Marketing Science, Vol. 15, No. 4, 1996, pp. 321-340. http://dx.doi.org/10.1287/mksc.15.4.321
- E. Edmiston and D. Kridel, “Automated Modeling and Sales Targeting: Case Study for AT&T Advertising and Publishing,” Proceedings of DMA07 (Direct Marketing Association Conference and Exhibit), Chicago, 17 October 2007.
- S. T. Yuan and Y. W. Tsao, “A Recommendation Mechanism for Contextualized Mobile Advertising,” Expert Systems with Applications, Vol. 24, No. 4, 2003, pp. 399-414. http://dx.doi.org/10.1016/S0957-4174(02)00189-6
- G. Shaffer and Z. Zhang, “Competitive Coupon Targeting,” Marketing Science, Vol. 14, No. 4, 1995, 395-416. http://dx.doi.org/10.1287/mksc.14.4.395
- M. D. Ekstrand, M. Ludwig, J. A. Konstan and J. T. Riedl, “Rethinking the Recommender Research Ecosystem: Reproducibility, Openness, and LensKit,” Proceedings of the 5th ACM Conference on Recommender Systems, Chicago, 23-27 October 2011, pp. 133-140.
Appendix: Similarity Measures Commonly Used in CF RS
Xi and Yi represent the vectors of either users or items being compared.
1) 
Euclidean Distance Similarity measures have a lower bound of 0 which would indicate a perfect match with no commensurate upper bound.
2) 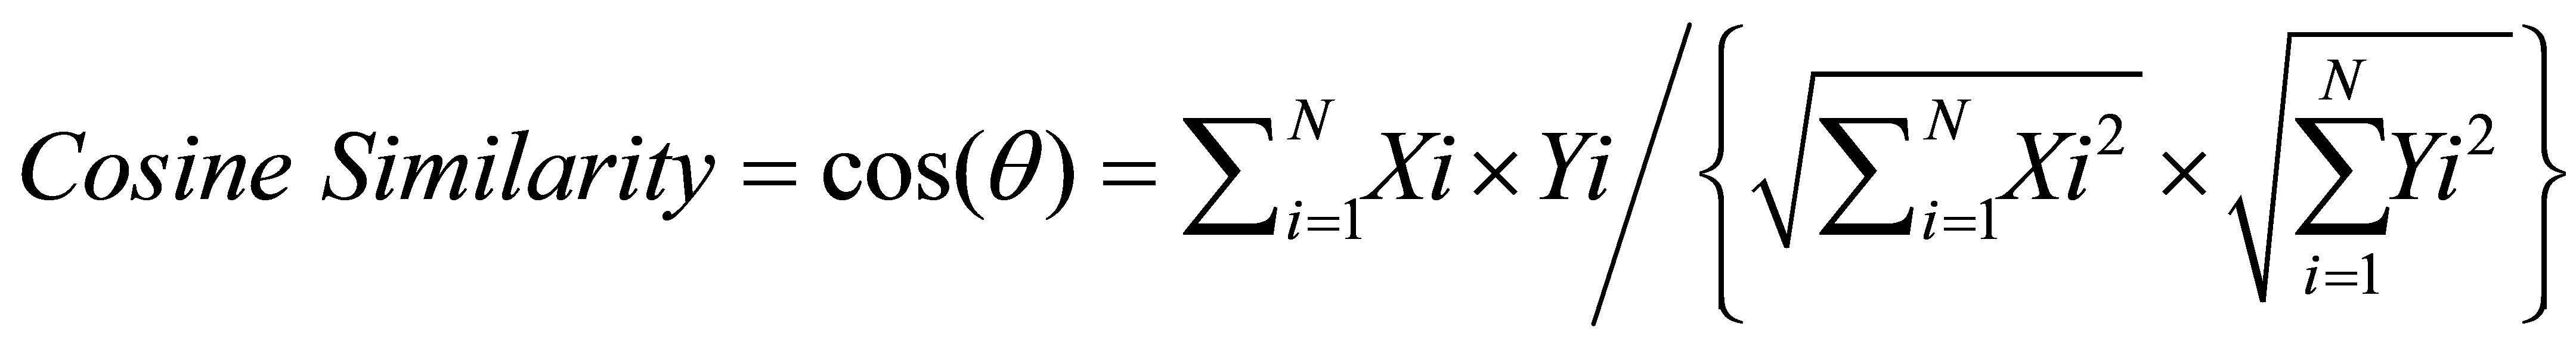
The cosine similarity values range between 0 and 1, indicating weak to strong similarity respectively.
3) 
NOTES
*Corresponding author.