Journal of Service Science and Management
Vol.5 No.3(2012), Article ID:22448,13 pages DOI:10.4236/jssm.2012.53030
Integrated Logistics Network for the Supply Chain of Locally Produced Food, Part II: Assessment of E-Trade, Economic Benefit and Environmental Impact
![]()
Department of Energy and Technology, Swedish University of Agricultural Sciences, Uppsala, Sweden.
Email: Ingrid.Nordmark@slu.se
Received May 29th, 2012; revised July 2nd, 2012; accepted July 12th, 2012
Keywords: Local food; Producers; Integration; Large-scale food distribution channel; E-trade; Environmental impact
ABSTRACT
In order to improve the logistics for locally produced food, and its integration with large-scale distribution systems, the conceptual idea of optimised and integrated logistics networks was analysed and demonstrated in a pilot project of local food producers in southern Sweden. The main objective of this paper was to assess the e-trade integrated logistics systems, economic benefits and environmental impact of integrated logistics systems, based on route optimisation analyses and producer data collected using questionnaires. The study revealed that the introduction of IT-systems for electronic trade had positive and negative economic effects. Internet-based cloud services designed for electronic business-tobusiness trading and coordinated transport with a common collection centre (CC) were important steps in the process of integration. The pilot project also showed the importance of a flexible organisation and a strong driving partner to continue and develop collaboration. Route optimisation could reduce the route distances, decrease the environmental impact and provide economic benefits due to reduced working hours. The lowest estimated global warming potential from vehicle emissions was found when coordination was considered for collection to the CC and to and from the distribution centre (DC). The lowest estimated potentials for acidification, eutrophication and human toxicity were found when integrated collections and deliveries took place during each route. To identify how the local food supply chains should be organised, more case studies of local food producers in different settings and under different conditions need to be carried out. With further case studies and surveys, more general patterns of variation and relations between variables may also be identified.
1. Introduction
There is growing interest in local food products and consumer confidence in local food is high. Local products are commonly seen as more environmentally friendly, more genuine and natural, of better quality and better in terms of working situation and rural development [1]. Local food products can be produced in more sustainable ways than currently, and can have a significant impact on the local environment and economy, as well the local community [2]. However, Wretling Clarin [1] argues that it is uncertain to what extent the products meet the customer expectations on sustainability and quality, due to the lack of established uniform labelling or criteria for local/regional/small-scale produced food. Ilbery and Maye [3] even warn against irresponsible combinations of terms such as “local”, “alternative” and “sustainable”. Whereas the lack of a standardized definition of local food [4] makes it difficult to compare local and non-local food, discussions about definitions are taking place, e.g. in Sweden [5]. Although the potential gains from improving conventional agriculture and international supply chains can be great [2], it is also concluded by Wallgren [6] that “There is a potential to organize local food transport in new ways to reach interested consumers, which could improve energy efficiency in local food transport” (p. 248). This statement addresses the logistics system as a whole, and considering that local and regional food has seen a strong increase on the market during recent years, an important task is to develop effective and sustainable logistics systems for these products. It is therefore of great importance to analyse and look for improvements in the system for local food products.
The transport sector consumes fossil energy and has a considerable impact on the environment and health. When the products (i.e. locally produced food) are expected to be more environmentally friendly and reduce transport intensity, it is important that the transport system is also organised as effectively as possible to meet these expectations. Wallgren and Höjer [7] propose a number of ways for reducing the energy use, such as energyefficient vehicles and logistics and increased e-commerce for reduced dependence on private cars and further strengthening of local food production.
In order to develop more effective and sustainable food distribution systems it is necessary to identify and evaluate existing logistics models for local and regional food [8]. Mapping studies of the distribution of local food have been carried out in e.g. Great Britain [9], Finland [10] and also in developing countries such as Honduras [11]. In Sweden, small-scale producers have been investigated in several surveys [1,5,12]. It is equally important to identify successful practices in effective logistics systems, not necessarily limited to food supply chains. Collaboration between companies is one of these practices; in a supply chain, it is more important to cooperate in order to create the most competitive chain than to compete for individual company profits [13]. This collaboration depends on communication and information sharing and may be referred to as integration, especially when real-time electronic communication systems are employed. In integrated systems, coordination of physiccal, economic and information flows between companies is necessary.
According to Swedish logistics managers at larger manufacturing companies [14], there is a clear relationship between the intensity of collaboration and the positive effects experienced from collaboration. However, it has also been argued that there is an optimal level of supply chain integration, where over-investment is avoided [15]. In many cases, sharing information is the most appropriate way to collaborate [16]. Matching the required level and amount of information with the supply chain flexibility is also important [17], while it should be taken into consideration that small-scale producers may not achieve the same effects of collaboration as large-scale producers.
By tradition, it has been difficult for small-scale producers to become suppliers to large-scale retailers, due to small volumes of production, seasonal production variations [18] and high logistics costs [5]. Many producers transport their products by themselves, often due to lack of better and inexpensive alternatives [5]. However, recent developments of customised and integrated local networks could facilitate the integration of local food into large-scale food distribution channels [19]. Network integration in this manner has many potential advantages for the improvement of logistics services in local food systems:
• Coordinated food transport can reduce mileage and transport time through optimised routes [10,14,20- 23];
• Expanded market for producers [24];
• Reduced costs and increased competitiveness [14,25- 27];
• Strengthened relationships between producers, distributors, retailers and consumers [18,28,29];
• Better exchange of knowledge, experience and information [18,30-32].
New logistics concepts for local food products are currently being developed and there is a growing market where consumers have high expectations on product quality and environmental benefits. Thus, there is a strong need for case studies that show how companies can actually reduce costs and increase their competitiveness and at the same time reduce the environmental impact. Furthermore, there is a need for further development of the methods to evaluate the environmental performance and potential economic benefits for the producers in the local food systems.
In a pilot project in the region of Halland, southern Sweden, a new logistics solution for the integration of small-scale producers and a large-scale food distribution channel (LSFDC) was implemented and demonstrated. This included start-up of a common collection centre (CC) and coordinated transport to the retailer’s distribution centre (DC). The results from the first part of the evaluation of the project, based on localisation and route optimisation analyses, are reported by Bosona et al. [33]. As a result of the localisation study, one company was recommended as the most suitable location for a CC [33] and this company carried out the daily collection of products from the other producers during the test phase of the pilot project. The current paper presents the second part of the study, where the integrated logistics solution, with an e-trade system and coordinated distribution, is evaluated with respect to economic competitiveness and environmental impact.
The main objective of the current paper was thus to assess the impact of integrated logistics and route optimisation analyses as implemented in the pilot project for small-scale local food producers in the region of Halland, Sweden. Specific objectives were to assess the:
• E-trade system;
• Economic benefits of the new distribution and e-trade system;
• Environmental impact of previously developed optimised distribution scenarios [33].
2. Materials and Methods
In order to assess the integrated distribution system and the producers involved in the pilot project, a questionnaire-based survey with complementary interviews was carried out. The results, describing the initial situation for ten producers, were compared with a limited national survey of small-scale producers [5].
Assessment was made of the e-trade system and the impact and benefits of new information flows and changes and benefits in the economic situation were analysed. Emissions and environmental impacts were estimated for the four scenarios, from the route optimisation presented in part I [33], based on emission factors [34] and characterisation factors [35,36]. Finally, post demonstration interviews with key representatives were held.
2.1. Survey
A group of local food producers in the county of Halland, southern Sweden, were considered in this project. The county covers 5462 km2 [37] and has nearly 300,000 inhabitants [38] and significant agriculture and forestry production. Through questionnaires and interviews, data were gathered on producer location and delivery points, delivery frequency, quantity and type of products and additional product distribution information. The survey contained nine questions, Appendix A, and was conducted during December 2008-April 2009.
Of an original sixteen candidates, ten (n = 10) actually joined the practical demonstration phase of the pilot project. Descriptive statistics were used to describe the group: frequencies, percentages, means, medians, and standard deviations. Apart from correlation analysis, the survey is mainly qualitative since the small number of observation in the case study did not motivate a more comprehensive statistical analysis. The results from the survey were compared with those of a limited national survey of small-scale food producers in Sweden (n = 78), with similar questions, previously reported in 2008 [5].
2.2. Assessment of E-Trade System and Economic Effects in the Pilot Project
The new e-trade system was described and analysed based on physical, economic and information flows. The pilot project sought to start up and demonstrate how this producer group could be integrated in distribution chain. Data collection for the economic analysis concerned changes in key logistics cost drivers: costs for packaging, warehousing, transport and IT. In addition, effects on working time for transport and marketing costs were considered, based on qualitative assessments. In the analysis, the initial cost levels (according to producer responses in the survey) were compared with theoretical costs for the pilot project, assuming that initial sales volumes were maintained. Thus, the possibility of increasing sales was not included, the reason being that the potential sales growth would have different effects on the participants due to size and would involve very uncertain projections.
In the end of the pilot project, key informant interviews were held with representatives of the producers and the large-scale distributor to investigate how the delivery system functioned and what the main problems were.
2.3. Emission Estimation
The environmental impact of the transport from producer to retailer was estimated for the four scenarios (Figure 1) developed in the optimisation analyses presented in part I [33]. In Scenario 1, reference of initial situation, all producers transported their own products to their respective customers. In Scenario 2 every producer transported to a common CC and then there was common transport to retailer DC. The distribution from DC to the retailer’s shops was assumed to (option I) go via separate distribution routes or (option II) be integrated in the retailer’s existing routes. It was assumed that the retailer’s vehicles already passed the shops for other deliveries on a regular basis, and that products from the local producers would not constitute more than 30% of the load. Scenario 3 differed from Scenario 2 only in the first step, by coordinated collection of all products to the CC. Scenario 4 involved integrated collection and delivery of products during each route, controlled by a communication centre, and without CC and DC.

Figure 1. Vehicle type assumptions for the four scenarios defined in part I [33]. In Scenarios 2 and 3, the last distribution link used light trucks in option I, and was integrated in LSFDC in option II.
The estimation of vehicle emissions was based on distance covered (kilometres), vehicle type (passenger cars, light trucks and rigid trucks) and emission factors (g/km) for carbon monoxide (CO), carbon dioxide (CO2), hydrocarbon (HC), nitrogen oxides (NOX), particulate matter (PM) and sulphur dioxide (SO2). These emission factors were taken from a Swedish handbook on air emissions from road traffic [34], based on the common EU model ARTEMIS. The emission factors selected concerned weighted values for mixed traffic (city/countryside) in 2009. Factors for passenger cars concerned weighted values for diesel and petrol cars, while the light and rigid trucks were all assumed to be diesel-powered.
Regarding the vehicle type (Figure 1), two reference cases were formulated in Scenario 1. In case A, the distances were covered by light trucks, and in the more detailed reference case B they were split between light trucks (67%) and passenger cars (33%), imitating the real situation better. Producers with smaller quantities per delivery (less than 400 kg), were assumed to use passenger cars and those with larger quantities per delivery (1000 - 2000 kg) were assumed to use light trucks. The reference cases A and B were then compared with three alternative scenarios. In Scenario 2, similar vehicle assumptions as for case B were used for the distance from the producers to the CC (346 km light truck + 173 km passenger car). The distances between CC and DC (208 km) and from DC to shops (3047 km) in Scenario 2 and all routes in Scenarios 3 and 4 were assumed to be covered by light trucks. In option II in Scenarios 2 and 3, the last distribution link from DC to retailers/customers was part of the LSFDC, covered by the retail chain’s vehicles (rigid trucks according to ARTEMIS nomenclature [34]). Emissions in Scenarios 2 and 3 option II were estimated excluding and including this last link of integrated distribution.
Based on the emission amounts in each scenario, the environmental impact was estimated by characterisation factors from the Ecoinvent V2.2 (2010) database. Factors from “CML1 2001” [35] were used for Acidification Potential (AP) as SO2-equivalents of NOX and SO2, Eutrophication Potential (EP) as  of NOX, and Human Toxicity Potential (HTP) as 1,4-dichlorobenzene equivalents of NOX, PM and SO2. Factors from “IPCC2 2007” [36] were used for Global Warming Potential (GWP100) as CO2-equivalents of CO2 and CO. HC was not included in any impact potential category, since no specific values for the general HC group were included in factors.
3. Results
3.1. Survey of the Initial Situation
The ten producers were located within the Halland County, a maximum of 70 km from each other (Figure 2). The nearest cities were Falkenberg, Halmstad and Varberg. The variety of products was relatively large. The most common commercial products were ‘Fruits, vegetables, root vegetables and potatoes’, see Table 1. In the national study [5] meat was the most common product group, while the distribution for the other product classes was relatively similar between the studies.
The average annual production quantities were similar in the studies but the range was larger in the national survey [5]. A summary of turnover, transport costs and time and load rate is provided in Table 2. The Halland producers had a higher average turnover than producers in the national survey [5]. The transport costs, expressed as percentage of total costs, were however similar in both surveys. The extent to which the producers considered working time for transport as a cost was not specified. Turnover, annual quantities, transport time and transport costs are presented in Figure 3.
Among the transport related factors there was a correlation found between transport time and turnover: r = 0.87 with a 95% confidence interval. This was based on n = 8 because of one missing observation for transport time and one 0 value. However, there was a clear departure from normality in the dataset and because of violations of the assumptions of normality and homoscedasticity, the data were log-transformed, resulting in a nonsignificant correlation between the two variables (r =

Figure 2. Map of southern Sweden showing the location of the producers and the CC in the county of Halland, and the DC and the customers.
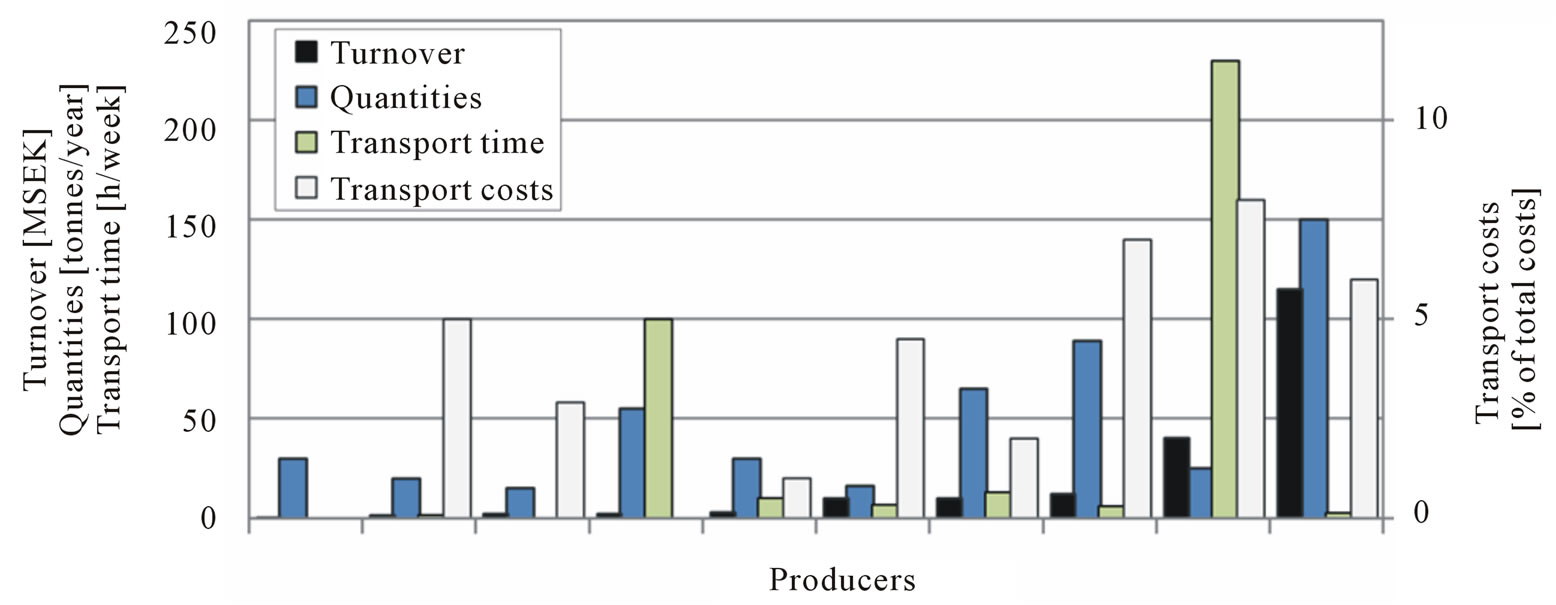
Figure 3. Annual quantities, turnover transport time and transport costs for each producer in the Halland study. Producers are sorted by turnover.
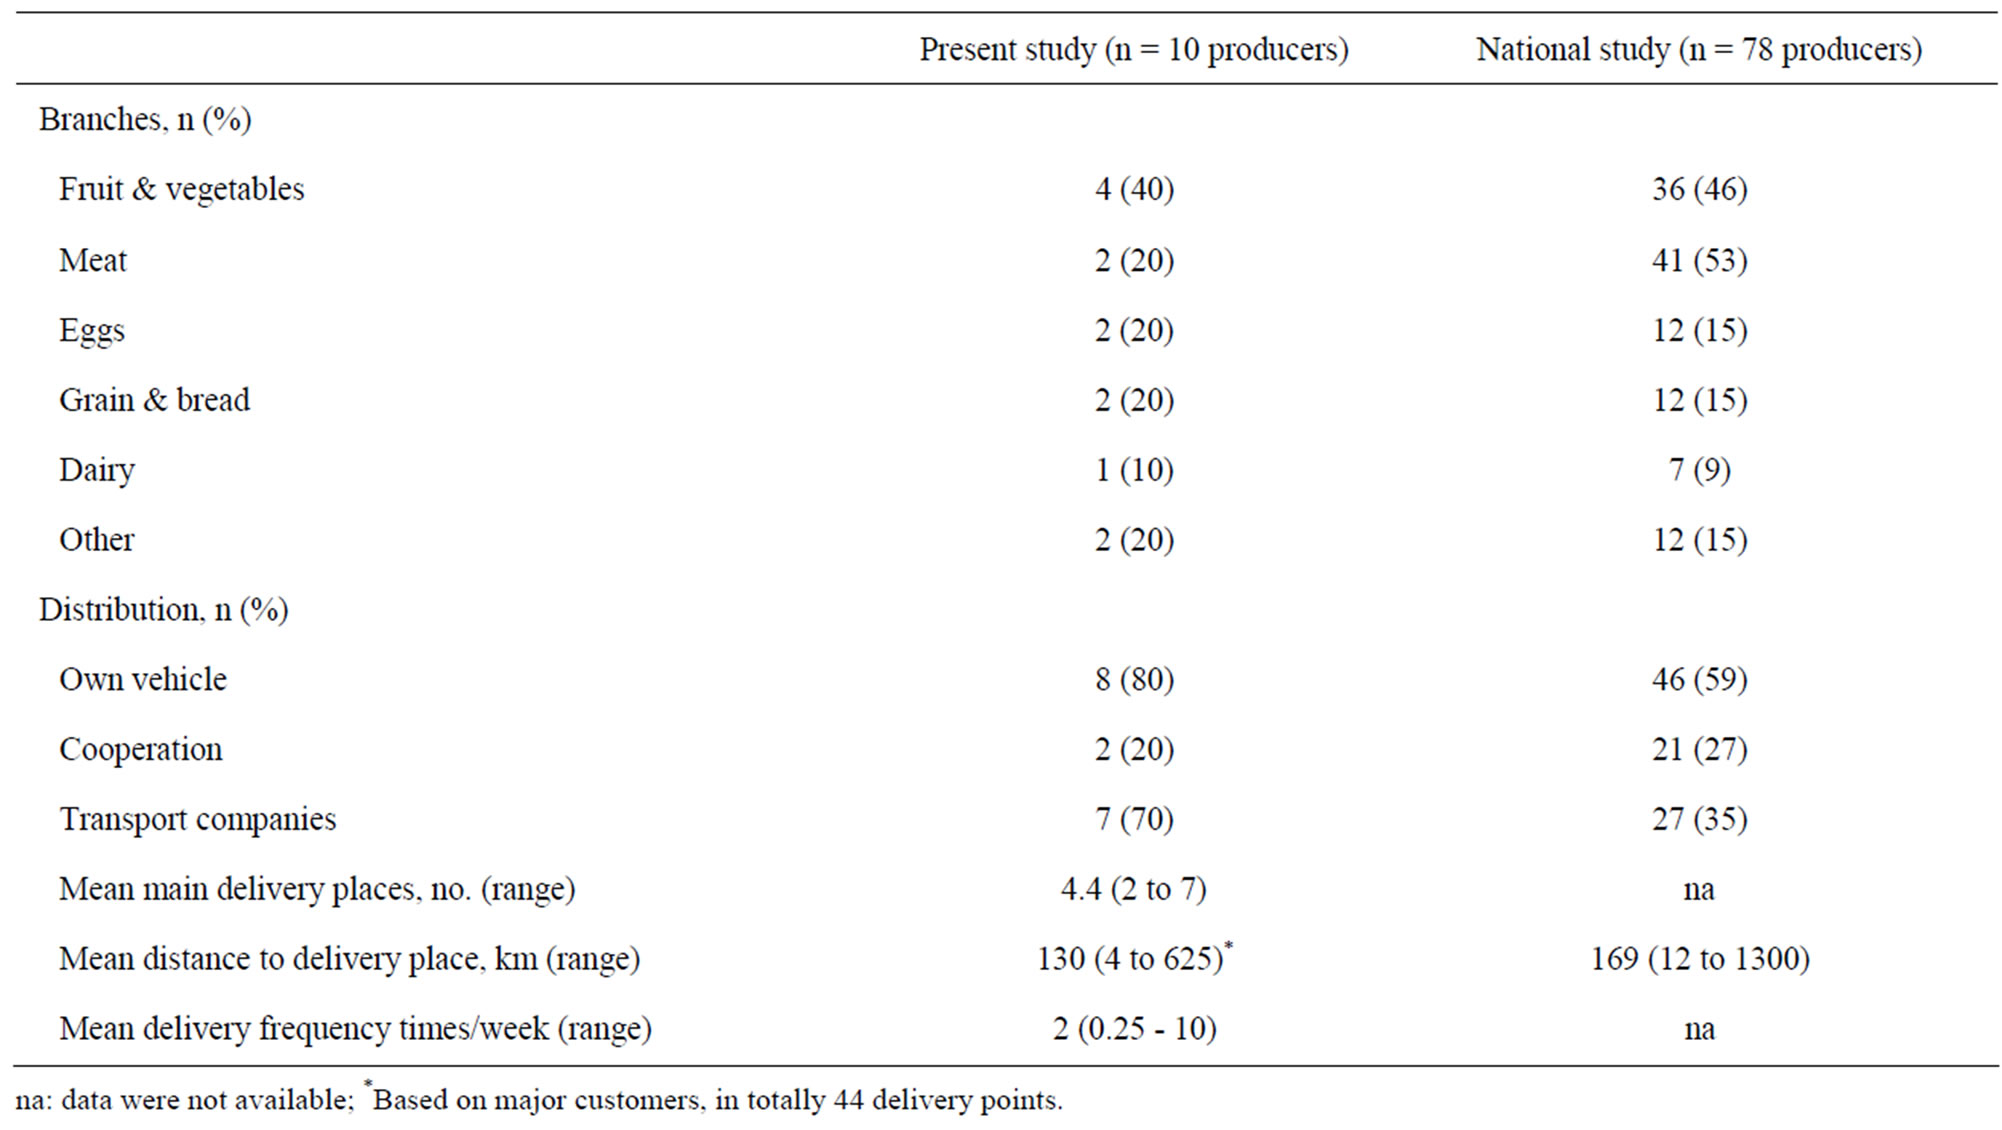
Table 1. Summary of the main branches of production, distribution methods, market regions and distances to delivery places among producers in the present study and in a national survey [5].

Table 2. Summary of turnover, transport costs and time and load rate in the present study and in a national survey [5].
0.54 and t = 1.57 at df = 6, p-value = 0.1685) and a linear regression showed no significant dependence. For transport time and quantities a correlation was found: r = 0.94. The log-transformed data were also correlated: r = 0.80 (t = 3.43 at df = 6, p-value = 0.0179).
1) Market regions and distribution
The average transport time was rather high, Table 2, but one producer carried out transport commissions for other companies, one reported zero hours and one reported a far larger value than the others. Exclusion of these producers resulted in an average 6.6 transport hours per week.
Most of the producers (60% - 90%) sold their products to several markets, from sales on farm to sales within the whole country, see Figure 4. Only a small proportion (20%) exported their products. The option “within the own county” was most common in both surveys. The Halland producers had more sales outside of their county than the producers in the national survey, but their average delivery distance, and their range were shorter, Table 1. Since Halland is one of the smallest counties in Sweden this is not surprising.
When asking the producers how many per cent of the production that was sold in different market regions, “within the own county” had highest average.
Taking into account each producer’s production volume the largest volumes were sold in own and adjacent counties, 36% and 28% of the total yearly production of nearly 500 tonnes. The mean values and range of the production sold in different regions are shown in Figure 5.
The producers named 44 main delivery points. Most points were located in Halland County (50%), and in the adjacent counties of Västra Götaland (25%), Skåne (11%),
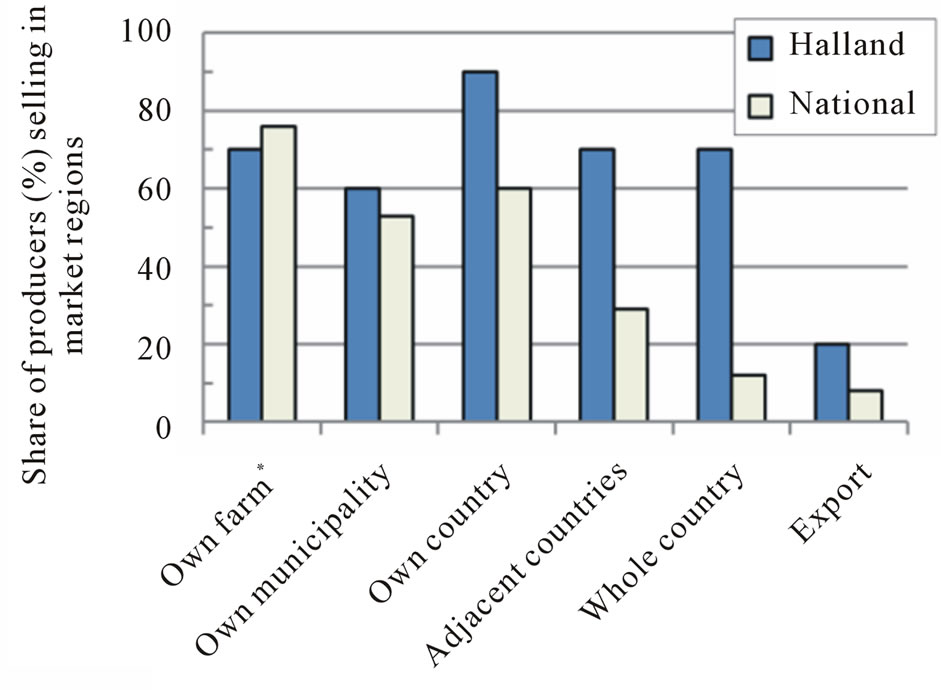
Figure 4. Sales in marketing regions (% of producers) compared with the national survey [5]. *There are probably overlap between “own farm” and “own municipality” in the national survey.
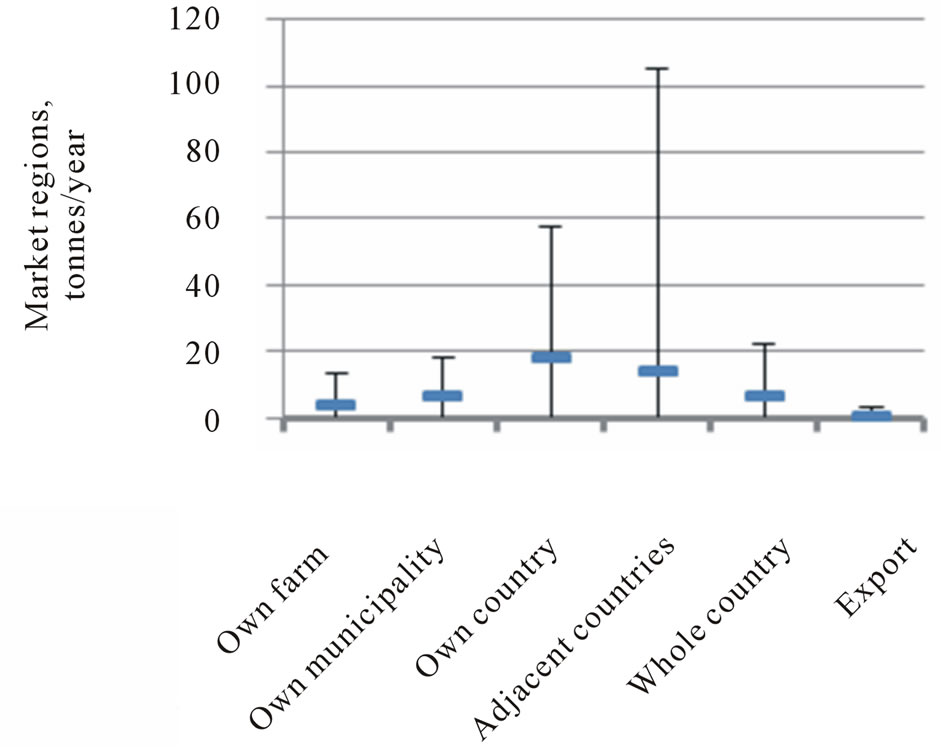
Figure 5. Yearly production (in tonnes) sold in different market regions, mean values with range.
Kronoberg (5%) and Jönköping (5%), see Figure 2. Two delivery points were located in non-adjoining counties, Södermanland and Stockholm. The average distance to main delivery points was about 130 km, Table 1, or 98 km on excluding the two furthest points. Producers in Sweden as a whole had on average 169 km to their delivery points [5]. The frequency of delivery to the major customers were in average two times/week, but had a wide range as some producers delivered ten times a week, while others delivered every other week and/or only during a limited period of the year.
Most participants in the pilot project combined two solutions for the transport while collaboration in the supply chain was relatively uncommon. Almost all producers, Table 1, used their own vehicles, and engaged transport companies for certain routes or during certain periods. Only 20% indicated that they interacted with other producers. Answers from the national study [5] shown less usage of own vehicle, less engagement of transport companies but more cooperation.
The load rates were in average 71%, Table 2, when the shipments left the farm. The proportions were >50%, “50%”, “75%” and “100%” were 10, 30, 20 and 30% of the producers respectively.
2) Producer ambitions with the pilot project
Nine producers answered an open question about producer ambitions and most of them wanted to reach out to customers in other parts of Sweden. The respondents had two main objectives: 1) to increase sales (e.g. by increasing geographical market area and exposure to retailers); and 2) to improve the logistics solution. Eight of the respondents expressed ambitions to grow through the pilot project. Three respondents indicated that the pilot project offered an improved and simplified logistics solution.
3.2. E-Trade System in the Pilot Project
For integration of the small-scale producers into the LSFDC, new services were included in the retailer’s IT-system. These services were implemented as internetbased “cloud services”, see Figure 6, and customised to the smaller and often seasonally-based production of the small-scale producers.
The IT-system used for ordering and controlling logistics services introduced in the project was an internetbased e-trade system, Exder, with two “cloud services”; one for the producers (Exder Market) and one for the retailers (Exder Marketplace) [39]. In this system, the producers could visually display their products to retailers in an internet interface. They could also price the products and control availability of products for different retailers individually. The flow of information (see Figure 7) involved producers, CC, shops, the retail chain DC, and the retail chain’s central IT-system. Unlike with other suppliers to the retail chain, there was no central purchasing for these producers. They could add different price levels for different retailers, e.g. depending on transport distance. The retailer’s shops used their ordinary ordering system for viewing these products. Orders from the shops could be added directly in the e-trade system by themselves, or by contacting the producers who could enter the order in the system. The first year’s licence cost was paid for by the LSFDC.
3.3. Economic Effects in the Pilot Project
1) Packaging and warehousing
According to the respondents, at this stage it was not decided how much the producers would have to pay for the usage of special (return) boxes, designed for, and used without charge, during the project. It was also not decided whether the CC would only act as a cross-docking station,

Figure 6. Distribution system and IT-system based on two cloud services.
or if warehousing costs would be incurred by the producers.
2) Transport costs
Instead of driving to all the customers, it was only necessary to drive to the CC, which was geographically well located. However, the actual cost changes and depended on the distance to the CC and how the products had been delivered previously. Collection to the CC cost about 80 SEK per pickup occasion. If two producers had a common pickup point they could split the cost. Collection of produce from farms was done every weekday.
Six of the companies supplied the information about both transport costs and time, citing a range of 28.5 kSEK to 6.9 MSEK. Excluding two producers (one doing other transport services and one stating very high transport costs and nearly no transport hours), the average transport cost per hour for the remaining four producers was calculated based on this information to be 268 SEK per hour.
The cost for transport from CC to DC depended on the volume handled. The transport fee for a box was 54 SEK, a pallet 232 SEK and a freezer box 414 SEK. Transport from DC to retail shops was not charged, based on the assumption that the goods considered could use available free cargo space in the retail chain’s distribution vehicles.
3) IT costs
Each order, requiring six electronic messages through Exder, cost in total 17.70 SEK. Using less paper documents such as invoices, savings could be made on postage, printing (toner + wear and tear on the printer), envelopes and paper. Excluding working time savings for the manual handling of invoices, the direct savings were approximately 15 - 20 SEK per invoice, thus balancing the communication cost. In cases where there was no computer, internet connection and/or printer, this had to be purchased. From year 2, there will also be an annual fee of 6 300 SEK. IT-support costs were added right from year 1, but may decline as users gain experience and may eventually be avoided (fixed cost fee was also available).
3.4. Environmental Impact of the Pilot Project
The estimated emission amounts from the four scenarios are reported in Table 3. Scenario 1, Case A (all producers transporting by themselves with light trucks) had the highest value of CO2, NOX, PM and SO2 emissions. Case B (all producers transporting by themselves with 67% light trucks and 33% passenger cars) had as much SO2 emissions as Case A, lower NOX and PM but higher CO and HC emissions due to differences in emission factors for diesel and petrol. While the distance decreased by 39% - 93% in Scenarios 2 - 4, the emissions decreased by between 5% - 86% compared with Case A, and 16% -

Figure 7. Information and physical flows using the e-trade system (from [40], modified).

Table 3. Vehicle emissions in the four scenarios.
92% (except for NOX) compared with Case B.
The largest reduction (for all substances except NOX where it was second largest) was achieved in Scenario 3, option II (coordinated collection and integrated distribution, excluding the distances in LSFDC), with a 66% - 86% reduction in Case A levels and 79% - 92% in Case B levels. The lowest NOX emissions were achieved in Scenario 4 (integrated collection and deliveries during each route), with 62 and 54% of Case A and B levels, respectively. The second largest reduction was found in Scenario 3, option II (including the distances in LSFDC), followed by Scenario 2, option II (excluding the distances in LSFDC), except for HC and NOX. Second largest HC reduction was found in Scenario 4.
The environmental impact of the emissions for all scenarios in terms of AP, EP, HTP and GWP is presented in Figure 8. Due to low NOX levels, Scenario 4 had the lowest AP, EP and HTP, while Scenario 3, option II, had the lowest GWP. The emission values presented in Table 3 and the environmental impact values presented in Figure 8 were estimated considering single delivery trip on all routes.
3.5. Post Demonstration
Key informant interviews with the company which was used as CC (hereafter called the CC-company) and the large-scale distributor were made after the delivery demonstration. The use of internet-based trading by the producers decreased after the first year. The producers found it complicated and time-consuming to learn and use the e-trade system and costs were believed to have discouraged the producers from continuing with the system.
According to the interview with the retail chain representative, more contacts between shops and producers have been established due to the pilot project. The large retail chain wanted to reach more producers for their shops. After the project, the chain has decided not to take any responsibility for the producer collection centres.
The electronic trading system tested seems not to have been continued because of incompatibility with the retail chain’s main ordering system.
The CC-company is now acting as a third party company and supporting other producers. After the demonstration project, the producer network expanded its integration with other large-scale distributors to the postdemonstration system illustrated in Figure 9.
The CC-company telephones the customers in the whole of Sweden, mainly restaurants, in order to sell its own and other producers’ vegetable products. The CCcompany places an order and sends an invoice to the customer’s wholesaler. The CC-company no longer has its own transport vehicles, so all transport activities are integrated with the transport systems of several wholesalers (chosen depending on customer location), in terms of both collection from producers and transport from the CC to their respective DC and further to the customers. The network is expanding into export markets with new customers in Finland and Iceland.
The CC-company performs certain value adding activities at its centre (see Figure 9). It provides equipment such as scales and packing machines for other producers to use at the CC to add value to the products. The products being sold by the CC-company are handled (e.g. washed), sorted (e.g. by colour/size/taste) and specially

Figure 8. Environmental impact profiles for all scenarios: potentials of acidification (AP), eutrophication (EP), human toxicity (HTP) and global warming (GWP).
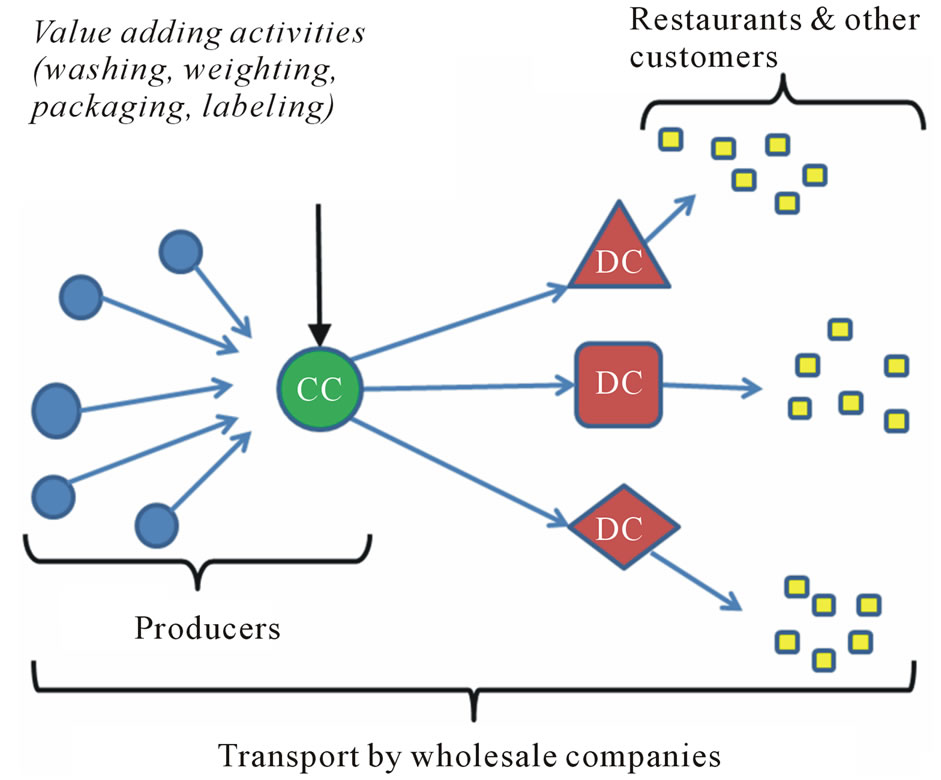
Figure 9. Post-demonstration system from the CC-company’s perspective. The transport system is integrated with different wholesaler distribution systems, depending on where the consumer is located.
labelled (with details about the vegetable, handling process, producer name, etc.) in order to promote the producers and to add value to the products.
4. Discussion
4.1. Initial Situation
The studied group of producers in Halland was more independent than the average small-scale producer in Sweden, as reported in the earlier national survey [5]. They did their own deliveries and cooperated less with other producers than producers nationwide, while at the same time they stated clearly that they wanted to reach new markets in Sweden, increase their sales and improve their logistics. Transport costs were slightly lower than stated in nationwide results, while a larger per cent of the Halland producers sold their product outside of the county. If the county is used as basis for what is local, this would indicate that the Halland producers were not as strictly local as producers in the national study. One possible interpretation is that companies in the pilot project in Halland were more active in reaching out to customers across the country but since the county is small it might also be easier to reach outside the county boundary.
The Halland companies had larger turnover than the national group, which may be related to a higher degree of processing since the product quantities were similar. In this study, a correlation was identified between transport time and delivered quantities but it was not possible to not show any relationship between transport time and turnover. However, these conclusions may not be generalized any further since the sample size is small and the results were obtained on the transformed scale. Although it may not be possible to identify simple key indicators for the design of logistics system in specific cases, this type of analysis may be useful as a reference when performed on other case studies and larger data sets. From a larger sample it may be possible to identify some general patterns of variation and relations between variables describing local food producers in more general terms. Further data collection in order to quantitatively describe local food production in different regions is therefore of great interest.
The frequencies of delivery varied markedly between the producers in the group and this had a great impact on the logistics, because the transport demand varied considerably during the year. The variety of product groups can be strengthened, given that the local products can be featured in various retail services without competing with one another. The physical distribution of products with a large variation must also be tailored to the requirements of different products.
Given that the products concerned are food and often premium products, they need to be transported and packaged so that the perceived values to consumers are not impaired in the logistics chain. Since the producers were more independent and already had lower transport costs than other small-scale food producers, it was important that they could see benefits from participating in the pilot project. Reduced logistics costs could be an attractive bait in this context.
The process of identifying the characteristics of supply chains from small-scale producers and suggesting practical improvements, such as route optimisation, is in agreement with Bloom and Hinrichs [8]. This is one way of moving from simply assuming that local/alternative food is sustainable, [1,3] to actually gaining knowledge of the real situation and moving towards more sustainable food systems. This survey contributes, although it is mainly qualitative, to the descriptions of distribution situations for small-scale producers, adding up with previous studies in Sweden [1,5,12] and internationally [9- 11].
4.2. Pilot Project
The e-trade system introduced in the pilot project gave retailers the possibility to order local food through their usual ordering system. It also opened a broader market for the producers, which was the ambition of several producers. The retailers could order products in an electronic business-to-business trading place within the existing ordering system, which decreased the need for multiple communication channels.
The amount of information given within the e-trade system might have been at a sufficient level which is important according to [17], but as seen in the post demonstration interviews the way of communicating the information, in a computer and web based trading place, did not suit the producers well.
Future changes in costs for the producers will largely depend on the CC. Transport costs should decrease, IT costs increase and storage costs would depend on the CC’s role in the supply chain. Thus, the working time for transport would be reduced for the majority due to coordinated transport. However, deviations may occur depending on the specific situation of producers and how the cost of their own working hours is valued. It is common for the self-employed not to include their own time in the cost, but if this is done, the savings achieved with coordinated transport may be underestimated. The marketing costs were difficult to determine here, but if producers carry out joint marketing activities the cost can be reduced. In addition, the sales can increase due to more effective marketing. IT costs could in this case be seen as marketing costs, since the current IT solution increases the exposure of products to possible customers. Costs of warehousing will not be affected if the CC only acts as a cross-docking station. Otherwise, this must be included in the producer budget.
It is important for the producers to take advantage of the opportunities in collaboration in the supply chain and to try to find more ways to cooperate for common profit. Cooperating instead of competing within the supply chain is, as noted by [13], a key to competitive advantage.
The integrated logistics system had potential positive effects on economics and the environment. However there may be obstacles to its implementation. In this pilot project a strong commitment was needed from all parties involved. The producers needed to adapt to a new ITsystem that turned out to be not sufficiently adapted to their daily work, as they found it complicated and timeconsuming, taking the focus from their main business. The retail chain initiating the project, needed to extend its responsibility and engage in the CC. After the pilot project the CC-company acted as an active agent for other producers, in a slightly modified system.
The system which the CC-company is using since the pilot project was shown in Figure 9. Although the telephone is used rather than e-trade, the e-trade technique works for producers that want to reach the specific retail chain’s shops. The physical flow of goods is integrated with wholesaler distribution systems. Several wholesalers distribute the specially labelled products, coordinated by the CC-company, to restaurants and other customers. The CC-company found its own distribution not profitable since the network and the supply region was too small. Therefore, outsourcing the transport to existing and well-established distribution channels was a good alternative, enabling more effective transport with higher load rates. The collaboration between the producers is a way to create a more competitive supply chain, which according to [13] is more important than to compete for the individual company profits.
The tendency among the Halland producers, specially the CC-company, is to expand outside their local area. Their production and collaboration are mainly locally based in Halland, but some co-producers and many of the customers are located in other parts of the country, and even further, making the system grow beyond local area. The way of organize the transport in this new way gives the producers possibilities to reach interested customers on greater distances and to use a transport that is more energy effective, a potential for local food pointed out by Wallgren and other [6,24].
4.3. Environmental Impact
In the studied pilot project, a couple of energy use reductive ways suggested by [7] were demonstrated and assessed, such as improved logistics and e-commerce. Furthermore, this study has added estimations of emissions and environmental impacts to the analysis. The emission figures presented here should be considered as a coarse indication of the amount of emissions discharged, rather than as precise numbers. When transport is coordinated there are possibilities to increase the load rates and use trucks which can hold more goods, instead of driving smaller vehicles (taking small amount of goods) over long distances. When setting up a coordinated distribution system, investments in newer vehicles may become more feasible due to higher vehicle load rate. Furthermore, when investing in new vehicles, alternative fuels may also be considered. Then the choice of vehicles and engines is also important. The CO2, NOX and PM emissions are lower and CO and HC higher for petrol fuel compared with diesel [34], and newer engine types, e.g. Euro 5 instead of Euro 3, emit less NOX and PM.
Previous studies have noted the advantages of network integration and the potential to reduce mileage and transport time with optimised routes [10,14,21-23]. The present study has demonstrated how these benefits can be implemented in a real-world application. In this estimation of emissions, the coordinated collection and distribution Scenario (3) had the highest reduction in distance and emissions for all compounds except NOX. When measuring environmental impact potentials the importance of considering NOX emissions becomes clear, since the lowest potential values, except for global warming, were instead obtained in Scenario 4 which had the lowest NOX amounts.
It may not be possible to draw general conclusions regarding how to implement a distribution system. Rather, each case has to be analysed individually. However, short distances, high load rates and energy efficient vehicles should always be strived for and to reach it, planning and choice of vehicle are important. Effectiveness in transport can make it (economically) possible to expand production, so the total emissions in the project area may even increase to higher levels than before the project. However, this may not be negative if it implies that products with worse environmental performance are out-competed. In economic terms, it implies that the effectiveness in the supply chain increases, possibly giving positive side-effects in labour supply and development in the area.
5. Concluding Remarks
The results in this study indicated that the sustainability of local food systems can be more ensued if effective and efficient logistics systems are introduced and support concerning new technology and marketing skills is properly provided.
The project in Halland is an example of an emerging yet operational logistics solution, integrating marketing, administration and physical distribution. This logistics solution can reduce costs for producers and expand their market, but the system costs involved (such as licence and support) may deter producers with small volumes. For the retail chain, the cost paid for the integrated ITsystem was motivated by the possibility to include local and small-scale products in the chain’s assortment without sacrificing shop rationalisation.
The pilot project resulted in expanded markets, cost reductions and reduced environmental impact from the local food supply chain, making the local food systems more environmentally sustainable. The amount of emissions depended strongly on driving distance, vehicle type and fuel type, and large reductions in emissions were possible when the transport distances were shortened. Decreased emissions also meant reduced fuel consumption and transport costs.
In situations like this, detailed knowledge of the quantities, frequencies and other requirements for the logistics system is needed in each case. Furthermore, the logistics system needs to be flexible enough to accommodate the wide ranges of turnover, frequency of delivery and product categories among local food producers, and a possible development over time.
This case study of a pilot project for local food logistics showed that:
• Coordination, optimisation and integration can improve logistics for small-scale producers in terms of cost, environment and labour;
• Small-scale producers with different kinds of products can coordinate and integrate their supply chains in the ordering system of a larger retailer;
• E-trade services can improve the contact between producer and retailer;
• IT-systems need to be well adapted, especially for users with their main occupation in another area and with lower IT skills;
• Producers involved need to have a certain turnover and volume in order to finance their part of the common IT-system, to justify their part in the CC and to attract shops;
• A strong, driving partner is important for collaboration to continue and develop.
In order to gain more general knowledge regarding how innovative logistics solutions for local food products can be implemented, more case studies need to be carried out. With further case studies and surveys of local food producers in different settings and under different conditions, more general patterns of variation and relations between variables may also be identified.
6. Acknowledgements
The authors would like to thank the producers and companies involved for participating, VINNOVA (the Swedish innovation agency) for financing this study, Dr. Rauf Ahmad, Dr. Gunnar Larsson and the anonymous reviewers for valuable comments.
REFERENCES
- A. W. Clarin, “Hållbar Konsumtion av Jordbruksvaror— Vad får du som Konsument när du Köper Närproducerat? (Sustainable Consumption of Agriculture Products—What Is It the Consumer Get When Buying Locally Produced Food?)” Report 2010:19, Jordbruksverket, 2010. http://www2.jordbruksverket.se/webdav/files/SJV/trycksaker/Pdf_rapporter/ra10_19.pdf
- B. G. Smith, “Developing Sustainable Food Supply Chains: Philosophical Transactions of the Royal Society B,” Biological Sciences, Vol. 363, No. 1492, 2008, pp. 849-861. doi:10.1098/rstb.2007.2187
- B. Ilbery and D. Maye, “Food Supply Chains and Sustainability: Evidence from Specialist Food Producers in the Scottish/English Borders,” Land Use Policy, Vol. 22, No. 4, 2005, pp. 331-344. doi:10.1016/j.landusepol.2004.06.002
- P. Jones, D. Comfort and D. Hillier, “A Case Study of Local Food and Its Routes to Market in the UK,” British Food Journal, Vol. 106, No. 4, 2004, pp. 328-335. doi:10.1108/00070700410529582
- H. Björklund, M. Cardoso, G. Gebresenbet, C. Gossas, I. Hallberg, D. Ljungberg and F. Strömblad,” De lokala Matproducenterna och Dagligvaruhandeln Kartläggning Hinder och Möjligheter—Förslag,” Livsmedelssverige/SLU, 2008. http://www.regionalmat.se/images/pdf/rapporter/rapport_lokalmat.pdf
- C. Wallgren, “Local or Global Food Markets: A Comparison of Energy Use for Transport,” Local Environment, Vol. 11, No. 2, 2006, pp. 233-251. doi:10.1080/13549830600558598
- C. Wallgren and M. Höjer, ”Eating Energy—Identifying Possibilities for Reduced Energy Use in the Future Food Supply System,” Energy Policy, Vol. 37, No. 12, 2009, pp. 5803-5813. doi:10.1016/j.enpol.2009.08.046
- J. D. Bloom and C. C. Hinrichs, “Moving Local Food through Conventional Food System Infrastructure: Value Chain Framework Comparisons and Insights,” Renewable Agriculture and Food Systems, Vol. 26, No. 1, 2010, pp. 13-23. doi:10.1017/S1742170510000384
- B. Ilbery, D. Watts, S. Simpson, A. Gilg and J. Little, “Mapping Local Foods: Evidence from Two English Regions,” British Food Journal, Vol. 108, No 3, 2006, pp. 213-225. doi:10.1108/00070700610651034
- J. Töyli, L. Häkkinen, L. Ojala and T. Naula, “Logistics and Financial Performance: An Analysis of 424 Finnish Small and Medium-Sized Enterprises,” International Journal of Physical Distribution and Logistics Management, Vol. 38, No. 1, 2008, pp. 57-80. doi:10.1108/09600030810857210
- J. Blandon, S. Henson and J. Cranfield, “Small-Scale Farmer Participation in New Agri-Food Supply Chains: Case of the Supermarket Supply Chain for Fruit and Vegetables in Honduras,” Journal of International Development, Vol. 21, No. 7, 2009, pp. 971-984. doi:10.1002/jid.1490
- Lantbrukarnas Riksförbund (LRF), “Enkät Småskaligt Livsmedel.ppt (Questionnarie, Small Scale Food),” LRF, 2007.
- M. Christopher, “Logistics and Supply Chain Management: Strategies for Reducing Cost and Improving Service,” Financial Times/Prentice Hall, London, 1998.
- E. Sandberg, “Logistics Collaboration in Supply Chains: Practice vs. Theory,” The International Journal of Logistics Management, Vol. 18, No. 2, 2007, pp. 274-293. doi:10.1108/09574090710816977
- A. Das, R. Narasimhan and S. Talluri, “Supplier Integration—Finding an Optimal Configuration,” Journal of Operations Management, Vol. 24, No. 5, 2006, pp. 563-582. doi:10.1016/j.jom.2005.09.003
- M. Holweg, S. Disney, J. Holmström and J. Småros, “Supply Chain Collaboration: Making Sense of the Strategy Continuum,” European Management Journal, Vol. 23, No. 2, 2005, pp. 170-182. doi:10.1016/j.emj.2005.02.008
- R. Kaipia, “Coordinating Material and Information Flows with Supply Chain Planning,” The International Journal of Logistics Management, Vol. 20, No. 1, 2009, pp. 144- 162. doi:10.1108/09574090910954882
- J. H. Trienekens, J. M. Hagen, A. J. M. Beulensc and S. W. F. Omta, “Innovation through (International) Food Supply Chain Development: A Research Agenda,” International Food and Agribusiness Management Review, Vol. 6, No. 1, 2003, pp. 84-98.
- T. G. Bosona and G. Gebresenbet, “Cluster Building and Logistics Network Integration of Local Food Supply Chain,” Biosystems Engineering, Vol. 108, No. 4, 2011, pp. 293- 302. doi:10.1016/j.biosystemseng.2011.01.001
- D. Ljungberg and G. Gebresenbet, ”Mapping out the Potential for Coordinated Goods Distribution in City Centres: The Case of Uppsala,” International Journal of Transport Management, Vol. 2, No. 3-4, 2004, pp. 161- 172. doi:10.1016/j.ijtm.2005.07.001
- D. Ljungberg, G. Gebresenbet and S. Aradom, “Logistics Chain of Animal Transport and Abattoir Operations,” Biosystems Engineering, Vol. 96, No. 2, 2007, pp. 267- 277. doi:10.1016/j.biosystemseng.2006.11.003
- H. Aronsson and M. H. Brodin, “The Environmental Impact of Changing Logistics Structures,” The International Journal of Logistics Management, Vol. 17, No. 3, 2006, pp. 394-415. doi:10.1108/09574090610717545
- M. Beckeman and C. Sköldebrand, “Clusters/Networks Promote Food Innovations,” Journal of Food Engineering, Vol. 79, No. 4, 2007, pp. 1418-1425. doi:10.1016/j.jfoodeng.2006.04.024
- P. Jones, D. Comfort and D. Hillier, “A Case Study of Local Food and Its Routes to Market in the UK,” British Food Journal, Vol. 106, No. 4, 2004, pp. 328-335. doi:10.1108/00070700410529582
- M. A. Bourlakis and C. A. Bourlakis, “Deliberate and Emergent Logistics Strategies in Food Retailing: A Case Study of the Greek Multiple Food Retail Sector,” Supply Chain Management: An International Journal, Vol. 6, No. 4, 2001, pp. 189-200. doi:10.1108/13598540110402728
- S.-M. Aghazadeh, “Improving Logistics Operations across the Food Industry Supply Chain,” International Journal of Contemporary Hospitality Management, Vol. 16, No. 4, 2004, pp. 263-268. doi:10.1108/09596110410537423
- B. Groothedde, C. Ruijgrok and L. Tavasszy, “Towards Collaborative, Intermodal Hub Networks: A Case Study in the Fast Moving Consumer Goods Market,” Transportation Research Part E: Logistics and Transportation Review, Vol. 41, No. 6, 2005, pp. 567-583. doi:10.1016/j.tre.2005.06.005
- C. Gimenez, “Logistics Integration Processes in the Food Industry,” International Journal of Physical Distribution & Logistics Management, Vol. 36, No. 3, 2006, pp. 231- 249. doi:10.1108/09600030610661813
- J. Murdoch, “Networks—A New Paradigm of Rural Development?” Journal of Rural Studies, Vol. 16, No. 4, 2000, pp. 407-419. doi:10.1016/S0743-0167(00)00022-X
- S. Forsman and J. Paananen, “Local Food Systems: Explorative Findings from Finland,” MTT Agri-Food Research Finland, Economic Research, 2010. http://www.gis-syal.agropolis.fr/Syal2002/En/Workshop%204/FORSMAN.pdf
- N. Saltmarsh and T. Wakeman, “Local Links in a Global Chain Mapping Food Supply Chains and Identifying Local Links in the Broads and Rivers Area of Norfolk,” East Anglia Food Link, Project Report, 2004. http://www.eafl.org.uk/downloads/LocalLinksMainWeb.pdf
- P. Engelseth, “Food Product Traceability and Supply Network Integration,” The Journal of Business and Industrial Marketing, Vol. 24, No. 5-6, 2009, pp. 421-430. doi:10.1108/08858620910966291
- T. Bosona, G. Gebresenbet, I. Nordmark and D. Ljungberg, “Integrated Logistics Network for the Supply Chain of Locally Produced Food, Part I: Location and Route Optimization Analyses,” Journal of Service Science and Management, Vol. 4, No. 2, 2011, pp. 174-183. doi:10.4236/jssm.2011.42021
- SMHI and IVL Svenska Miljöinstitutet AB with SubConsultants, “Handbok för Vägtrafikens Luftföroreningar (Handbook for the Air Emission from Road Traffic),” 2010. http://www.trafikverket.se/TrvSeFiler/Privat/Miljo/Halsa/Luft/handbok_for_vagtrafikens_luftfororeningar/kapitel_6_bilagor_emissionsfaktorer_2009_2020_2030.pdf
- Swiss Centre for Life Cycle Inventories, “CML2001/Acidification Potential, Average European/Eutrophication Potential, Average European/Human Toxicity, HTP 100a,” Ecoinvent Database, Dübendorf, 2010. http://www.ecoinvent.org/database
- Swiss Centre for Life Cycle Inventories, “IPCC 2007/ Climate Change, GWP 100a,” Ecoinvent Database, Dübendorf, 2010. http://www.ecoinvent.org/database
- Nationalencyklopedin, “Hallands Län,” 2011. http://www.ne.se/lang/hallands-l%C3%A4n
- Statistics Sweden (SCB), “Folkmängden per Församling 2010-12-31 Enligt Indelningen 2011-01-01,” 2010. http://www.scb.se/Statistik/BE/BE0101/2010A01/be0101tab5forsaml10.xls
- Expert systems, “Electronic Business,” 2010. http://www.expertsystems.se
- C. Rygaard, “Expert Systems,” Unpublished, 2010.
Appendix A
Questionnaire [translated from Swedish and re-formatted]:
1) Where is the production located (address including zip code)?
2) Which are the branches of business (options: Meat, Eggs, Dairy Products, Cereal and Bread, Fruit, Vegetables, Roots, Potatoes, Others)?
3) What is the turnover (SEK per year) of the business and how large are the transport costs (percentage of total cost)?
4) Estimate the transport time (hours per week).
5) Where are the products sold (percentage share for the options: At the own farm, within the own municipality, within the county, within adjacent counties, within the country, Export)?
6) Addresses and delivery frequencies (times per week) to the five largest delivery places?
7) How is the distribution arranged (options: Distribution with own vehicle, Cooperation with other producers, Engaging transport companies)?
8) Estimate cargo space in use when the shipment leaves the farm, (options: 0%, up to 25%, up to 50%, up to 75%, up to 100%, …%).
9) Which are your ambitions in participating in the pilot project?
NOTES
1Institute of Environmental Sciences (CML), Leiden University, Netherlands.
2Intergovernmental Panel on Climate Change.