Journal of Biomedical Science and Engineering
Vol. 5 No. 6 (2012) , Article ID: 19716 , 8 pages DOI:10.4236/jbise.2012.56041
Automatic detection of pulse morphology patterns & cardiac risks
![]()
1Departmemt of Mathematics, Indian Institute of Technology Bombay, Mumbai, India
2Wesley Clover Communication Solutions, Pune, India
3Departmemt of Electrical Engineering, Indian Institute of Technology Bombay, Mumbai, India
Email: *rrj@math.iitb.ac.in
Received February 29th, 2012; revised April 3rd, 2012; accepted April 9th, 2012
Keywords: Pulse Signal; Spectral Analysis—Fisher’s Ratio; Morphology Variation; Geometrical Modeling
ABSTRACT
Analysis of arterial pulse waveforms is important for non-invasive diagnosis of cardiovascular functions. Large samples of IPG signal records of radial arterial pulse show presence of eight different types of shapes (morphological patterns) in the pulse waveforms. In this paper we present an efficient computational method for automatic identification of these morphological patterns. Our algorithm uses likelihood ratio of cumulative periodogram of pulse signals and some geometrical criteria. The algorithm is presented with necessary details on signal processing aspects. Results for a large sample of pulse records of adult Indian subjects show a high accuracy of our algorithm in detecting pulse-morphology patterns. Variation of pulsemorphology with respect to time is also analyzed using this algorithm. We have identified some characteristic features of pulse-morphology variation in patients of certain cardiac problems, hypertension, and diabetes. These are found relevant and significant in terms of physiological interpretation of the associated shapes of pulse waveforms. Importance of these findings is highlighted along with discussion on overall scope of our study in automatic analysis of heart rate variability and in other applications for non-invasive prognosis/ diagnosis.
1. INTRODUCTION
Arterial pulse signal can provide valuable diagnostic information about cardiovascular health. Implications of ancient Chinese and Indian medical sciences suggest that the different morphologies of pulse could be also correlated with some other pathological conditions [1-4]. Recent years have seen revived interest in development of instruments for pulse-signal recording and in detection and analysis of Heart Rate Variability and related noninvasive applications (e.g. [5-11]).
Modern research on pulse signals is mostly focused on analysis of Heart Rate Variability [12-15]. Relatively few studies are reported on pulse morphology or shape of the pulse waveform. Wang and Xiang [16] had analyzed power spectra of four kinds of pulse signals in frequency-domain using Fast Fourier Transform (FFT). Their results had correlated certain harmonics with regularity and smoothness properties of the pulse signal waveform. O’Ruke [7] had presented pulse waveform analysis to study arterial stiffness. De Melis [17] et al. had carried out blood pressure waveform analysis, using wavelet transform. Important parameters for pulse waveform analysis were analyzed in [8,18] vis-à-vis in vivo cardiac functioning.
We have attempted a novel approach, the basic idea of which is derived from the Ayurvedic concepts and computer simulations of pulse waveforms [3,4,19]. According to Ayruveda, morphology of the pulse of a person may vary within a short span of time and is specific to his/her health. We have developed a computational method for automatic detection of specific types of morphological patterns in radial arterial pulse waveform using Fisher’s Ratio [20] and some geometrical parameters. Validation on a large sample shows its high accuracy. We have also analyzed the variation (with respect to time) in pulse-morphology using this method and found characteristic results for certain diseased conditions/ disorders.
Key parameters and major steps used for automatic detection of pulse signal morphology are described in Section 2. Results are presented in Section 3. Physiological interpretations and implications of the results and significance and scope of this study are discussed in the last section.
2. MATERIALS AND METHODS
Dataset: The IPG signals of radial arterial pulse (often referred as “pulse”) of adult Indians were provided by our collaborators at BARC, Mumbai and CDAC, Pune. The pulse signals were recorded using Medical Analyzer System [5,6] and its instrument “VASOMON” (product of Larsen & Toubro, Ltd.) at a constant sampling frequency 100 Hz. The in-built system of the instrument is tuned according to standard requirement of frequencyranges for Fourier analysis and for collecting substantial observations for analysis of morphology variation. The pulse-signals were recorded on each person for 5 minutes. Motion artifacts were nullified with the help of appropriate accessories that maintain steady position of the forearm.
In our study, random noise in the IPG signal thus recorded was removed by using band-pass filter (0 - 20 Hz). Simple Butterworth digital band pass filtering in the range of 0.7 to 35 Hz was applied to eliminate operating frequency, low frequency interferences by other organs and other noises. Hamming windowing was done further on the filtered digital signal. Baseline wandering was removed deploying a modified version of wavelet based cascaded adaptive filter (CAF) algorithm of [21]. Other details on signal processing aspects including filtering and removal of baseline drift are discussed in our other paper [22]. The present study focuses on detection and analysis of the shape (morphology) of the filtered pulse records.
The final sample after filtering of baseline wandering and other noises consisted of pulse-records of 170 Females and 265 Male volunteers. The age of subjects in this sample varied between 20 and 75 years. Those within a comparable age-group, e.g. 20 - 25 or 65 - 75 years, etc, had comparable body-mass-index. Except for the hypertension cases, the blood pressures (BP) of other subjects were within normal range at the time of recording of the pulse. Among the diseased cases in this set, there was none who had been hospitalized within three months span, and none was under any special care treatment.
2.1. Specific Patterns in the Waveform
In their test trials on the instrument, Jindal et al. at BARC had observed eight prominent patterns in morphologies of pulse records. These are schematically illustrated as patterns labeled I to VШ in Figure 1. These patterns are also found in prominent clusters in an independent study of pulse signals [23].
During data collection, Dr. M. Dhurandhar et al. at CDAC, Pune had noticed a pattern somewhat “in-between” Ш and IV in pulse records of some Diabetic Mellitus (DM) cases. We have considered this as a distinct pattern (Ш* in Figure 1). Apart from patterns V, VI, VII we found some other morphological patterns having more than one prominent peak and/or first prominent peak lower than the second. These types of patterns and the patterns V, VI, VII are referred in our study as “abnormal patterns”.
2.2. Significance of Fisher’s Ratio
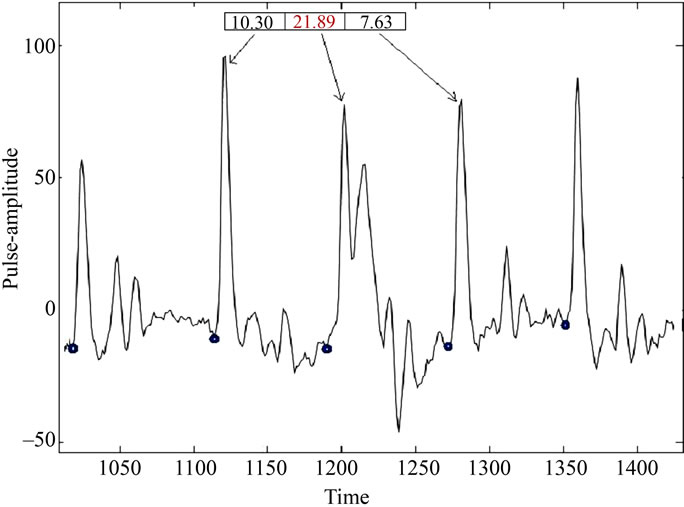
Using time-series modeling and thorough statistical analysis of pulse-signals, we had found that Fisher’s Ratio—the likelihood ratio of cumulative periodogram [20] —has significant relation with morphological patterns. Figures 2(a) and (b) illustrate this for randomly selected portions of two pulse records in our dataset. Overall inference based on this statistic is outlined in Section 2.2.2 below.
2.2.1. Computation of Fisher’s Ratio (FR)
This is a likelihood ratio for statistical inference of spectrum. For a periodogram of the sample portion of a waveform over n consecutive time-points it is computed as
with  and
and  is the periodogram at the Fourier Frequency,
 .
.
2.2.2. Statistical Inference
We have computed Fisher’s Ratio (FR) for successive periods on each pulse-record on a randomly chosen training sample of about 80 Females and 120 Males from the above-described dataset. Statistical inference of
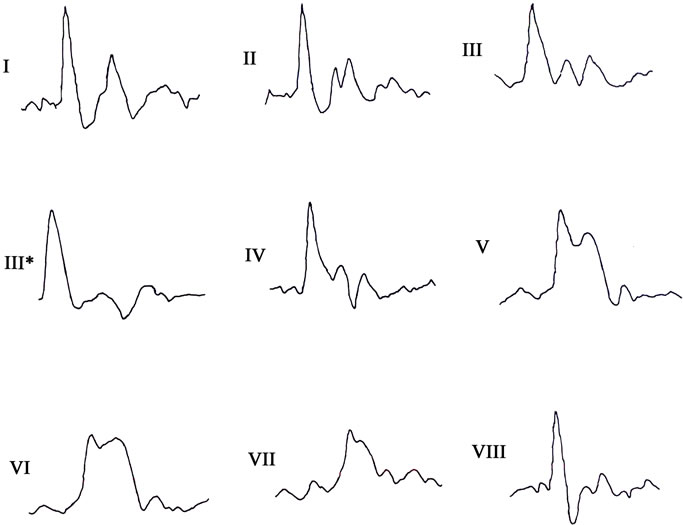
Figure 1. Schematic sketches of the prominent patterns (I to VIII) referred in Section 2.1. In each plot, X-axis corresponds to time and Y-axis to pulse-amplitude.
 (a)
(a)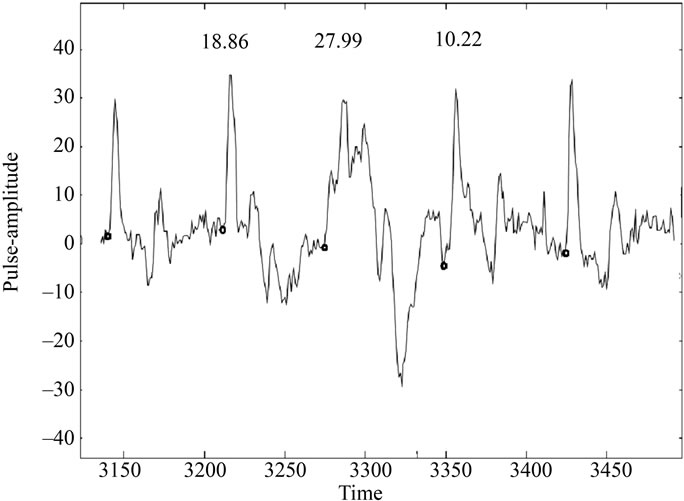 (b)
(b)
Figure 2. (a) Illustration of FR variation in different periods of pulse record (subject code no.: C43). Only the patterns with FR = 21.89 are abnormal here; (b) Drastic variation in FR values in three consecutive periods in a pulse record (patient code: B1). The period for which FR = 27.99 is truly rare case of abnormal patterns. It has multiple prominent peaks but first one is lower in amplitude than the second.
this is summarized in the following rules. Here, p* denotes the confidence level of proportionality test of occurrence of corresponding patterns. These “probabilistic rules” were also found valid for remaining pulse records in our dataset.
If FR Î [6, 8.5] then IV or VШ with p* > 0.87.
If FR Î (8.5, 11] then II, IV or VШ with p* > 0.88; more likely are II or VШ.
If FR Î (11, 12] then II or IV with p* > 0.82; more likely is II.
If FR Î (12, 13] then II with p* > 0.71 else.
If FR Î (13, 14] then II with p* > 0.87.
If FR Î (14, 15] then Ш or IV or VШ with p* > 84.6; more likely is III.
If FR in (15, 16] then II or IV or III* with p* > 0.82; more likely is II.
If FR in (16, 18] then II, IV or III* with p* > 0.95.
If FR > 18 abnormal patterns with p* > 0.9999.
These probabilistic-rules (heuristics) provide necessary screening and guidelines for geometrical modeling. The “more likely” option is used in case of a tie. Final detection is made using geometrical modeling. Major computational steps are outlined below.
2.3. Automated Detection of Pulse Morphology
We have developed and implemented the following algorithm on MatLab for online detection of pulse morphology by identification of the wave-patterns in successive periods. The software is given to the collaborators at CDAC, Pune and BARC, Mumbai for inclusion in the decision support system of pulse-based diagnosis and integration in the Medical Analyzer System respectively.
Major Steps of the Algorithm
1) Remove Baseline Wandering by using an improved wavelet based adaptive method [21,22].
2) Detect Peak and Onset Points of Successive Periods using our algorithm, which is a modified and extended version of Pan-Tompkins algorithm [22,24] (Necessary details are given in the Appendix).
3) Compute Fisher’s Ratio [20] for successive periods (i.e. time-intervals between successive onset points) by using the formula given in Section 2.2.1 above.
4) Normalize of each period in certain height (amplitude at the peak) and width using interpolation. In our computations, normalized width = 70 points and normalized height = 100 units.
5) Discriminate between patterns I, II, III, III*, IV and VIII, and abnormal patterns (defined in Section 2.1 above) using Fisher’s Ratio and width of the normalized waveform at amplitude 40% above the base.
6) Predict possible morphology/(ies) in each period by applying the statistical inference (probabilistic heuristics outlined above) on FR.
7) Geometrical Modeling: Compute distinct features, e.g. distance between two onset points, number of prominent peaks between two onset points, amplitude and distance (from the left onset point) of each prominent peak, etc. Compare these with the corresponding features for template-structure/model of the possible patterns and choose the optimal match. The template-structure of a pattern is found by superposing the corresponding schematic design on a normalized record of the training sample.
8) If more than one morphology pattern are inferred for any period, then select a specific one according to additional features such as vertical and horizontal distance between secondary and small peaks, deflections etc, and apply the “more likely” option, if any, of the relevant FR-based heuristics.
Validation results of our experiments using this algorithm are shown in Table 1 in the next Section.
2.4. Characterizing Morphology-Variation Strings in Healthy & Diseased States
We have characterized morphology variation with respect to time in pulse-records deploying sequence alignment technique. For ready use of available multiple sequence-alignment software of Bioinformatics applications, we had coded the detected patterns as standard single letter codes of some amino acids: namely, pattern I as A, II as C, III as D, III* as E, IV as F, abnormal patterns as G and pattern VIII as H.
The output of our program for automatic detection of pulse-morphology patterns for successive periods was thus transformed into a sequence (string) of letters in the alphabet {A, C, D, G, H}. Such a coded sequence is termed as “morphology-string” in this paper. Depending upon total time for which the pulse is consistently recorded, and the types of patterns occurring in it, the total number of periods and hence the length (say, k) of its morphology-string may vary. In our dataset, k varied between 220 and 300.
Identification of Motifs or Characteristic Patterns
The dataset was subdivided into similarity subsets with respect to gender, age, body-mass-index, blood pressure and healthy status or diagnosed disease/disorder, if any. For identification of prominent morphology patterns or their common sequential segments (motifs) we aligned the morphology-strings within a subset using ClustalW program [25], which is an extensively used software utility for protein/DNA sequence alignment.
Pair-wise, as well as multiple sequence alignment was carried out on morphology-strings of the subjects in each subset. Aligned portions with scores greater than 60 (on 100 point scale of ClustalW) were screened to detect the characteristic features—1) sequential motifs, i.e. common sub-strings of consecutive patterns; and/or 2) most frequently occurring patterns.
3. RESULTS
We have evaluated the automatically detected pulse morphology patterns on samples of randomly selected periods from the pulse records. From these the validation samples were so chosen that at least 30 representative of each pattern were present in each. Jackknife technique [26,27] was applied for cross-validation.
Table 1 below shows the average of percentage accuracies of observed versus predicted patterns in the crossvalidation trials. In this table, “True Pattern” implies manually identified pattern, which is also verified by superposition onto the template structure. The types (labels) of patterns are as described in Section 2.1 above. Some consecutive portions (of the morphology-strings on patient’s pulse record) are shown in Figures 3 and 4. It can be clearly seen in these figures that predicted pattern-types match with the corresponding shapes in the waveform. In each figure, X-axis shows time variation (in units of 0.01 seconds) and Y-axis shows pulse-amplitude.
The average (with respect to all except abnormal* patterns and with respect to all cross-validation samples) sensitivity of our algorithm is about 88.03% and average specificity is approximately 86.41%. (*As the “abnormal” patterns are relatively easy to detect because of two or more prominent peaks and the sample size of these in our data were less, inclusion of these increases both the average specificity and sensitivity by about 2.2% to 2.8%).
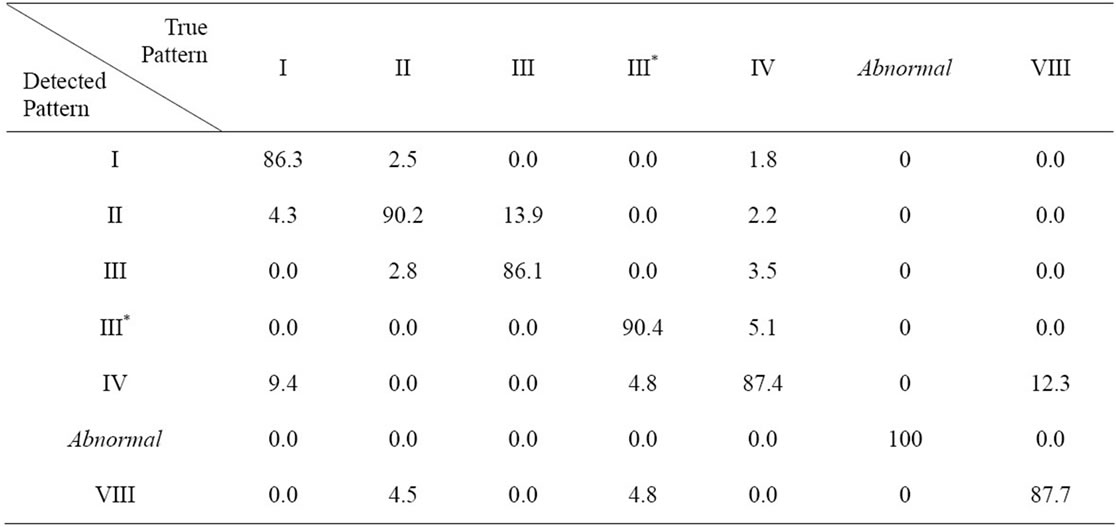
Table 1. Percentage accuracy of predicted versus actual pattern. The values in ith row jth column indicates average percentage of cases when actual pattern type is the label of jth column and the detected (by our automated predictive algorithm) pattern type is the label of ith row.
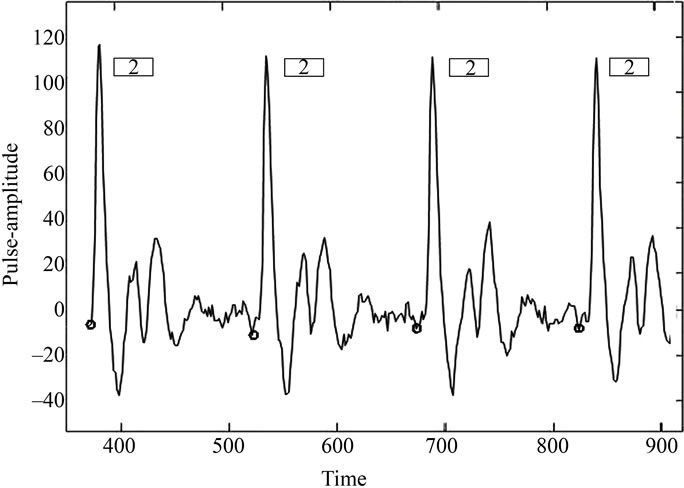
Figure 3. Automatic prediction of pulse-morphology over time for pulse record (from time point 300 to 900 in units of 0.01 seconds) of subject code no. P16. Pattern type in each successive period shown here is predicted as II, which is correct according to the definition of this pattern in Figure 1.
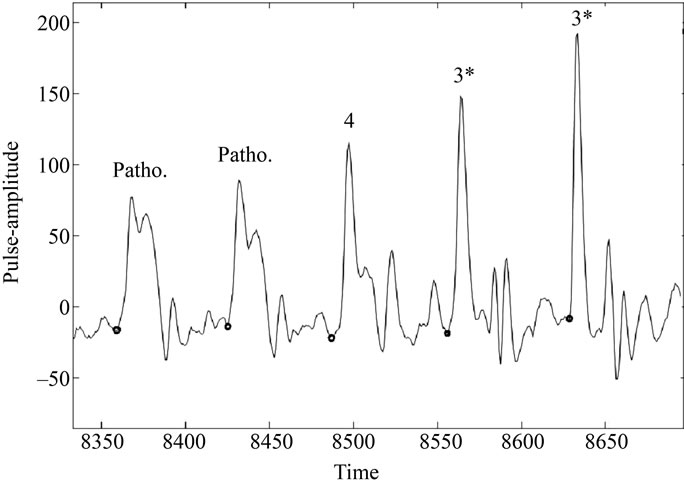
Figure 4. Automatic prediction of pulse-morphology over time for pulse record (from time point 8340 to 8710 in units of 0.01 seconds) of patient P165. (Here, Patho. Indicates an abnormal pattern; 4 indicates pattern IV and 3* denotes pattern III*).
3.1. Characteristics of Morphology Variation
The results show that motifs of morphology patterns or their frequency distribution are distinct for most subsets. Only the results with confidence level >90% are presented here. The size of corresponding groups having “healthy” cases was 45 and sizes of those having “diseased” cases were between 11 and 24.
In the following, by percentages of occurrence of a morphology pattern we mean the percentage of periods (out of k) for which the particular letter is present in the morphology-string. For clarity of illustration only some aligned portions (of the morphology-string) containing the motif, if any, are shown.
Characteristic Features
1) Healthy Cases in Age Group 20 - 40 years: The morphology-strings of subjects in this group who bear no risk of cardiac or any other disease (in terms of lipid profile or family history) show significant prominence (~65% or more) of “H”. This is an important characteristic feature, distinguishing the truly healthy ones from the diseased classes, as the presence of this pattern was found insignificant in the patients’ groups: about 10% of the diseased cases show occurrence of this pattern, that too sporadic (in less than about 15% of the periods).
The other noticeable patterns found in the morphology strings of healthy people in age group 20 - 40, without any risk are—prominent continuous patches of “A” and/or “C”.
The number of healthy cases in higher age-group was very small.
2) Ischaemic Heart Disease (IHD): Morphologystrings of females of age above 60 years and having IHD were found to have significantly high frequency of “F” as compared to other patterns.
Aligned portions of morphology-strings of males of age above 60 years diagnosed for IHD with Hypertension showed prominence of short and medium size continuous patches of “D” and frequent occurrence of “E” and “A”.
3) Minor Coronary Artery Blockage: The set of “Minor Coronary Artery Blockage” labeled separately from IHD corresponds here to those patients who had minor coronary blockages for which no angioplasty was suggested.
Patients of age 35 - 55 Years: Pair-wise alignment of the following segments of morphology-strings with every string in this group showed significant score. The highlighted portions indicate the characteristic motifs that were found in all the morphology-strings in this particular sub-group.
HCHCHCCCCHCCCCCACCCACCHCCCCCCCCCCC
CCHCCCCCACCCCCCCHCCCHCCCDC
DCDACCCCCCCCCCCACCCCCCCCCCCCCCACACCCCA
The number of records in age-group 56 - 60 in this “disease” subset was very small.
Patients of Age > 60 Years: The most (pair-wise) aligning segments of morphology-variation found in this case were distinct from those in the group of the patients in age group 35 - 55 mainly because of high frequency of “D” and typical presence of short segments of its consecutive occurrence. This distinct feature, along with relatively frequent occurrence of “C” accounts for characteristic features of this sub-group. Typical portions of aligned segments are depicted below.
DCCCDDDCDDCEDCCDCACCACDCCCCCDCCADCACCC
DCCCCCACCCCDCDCDCCFCCA
DDCADDCCDDAACCCDADDDCDDCACADDDCCCDCDDCCA
4) Diabetes Mellitus (DM): The morphology-strings of patients in this group showed prominent occurrence of “E” and “F”. Most of these had presence of characteristic segments (motifs) like:
EEEEEEEFEE and FFEFFEFF or FEEFEFEF
4. DISCUSSION
In modern medical practice different instruments and techniques are used for measurement of blood pressure, pulse rate, arterial blood flow rate, volume, cardiac output, electrophysiology of the heart etc. In the ancient times, especially in the Chinese and Indian traditional methods of diagnostics, deeper knowledge of the cardiac as well as other physiological functions were measured by sensing the pulse at different parts of the body including the radial arterial pulse.
Recent research on non-invasive methods of early diagnosis and deeper understanding of cardiac problems has generated new interest in pulse signal analysis. Modern physiologists also regard that noninvasive radial arterial pulse waveforms contain substantial pathophysiological information of cardiovascular system [12,19]. Major Biomedical research in this regard pertains to analysis of Heart Rate Variability and development of portable instruments for recording of pulse waveforms. Our algorithm of peak-detection (ref. paper no. [22]) also offers direct application in this regard. In the present paper we have explored a novel aspect—identification and analysis of variation in overall shape (morphology) of the waveform.
We have developed an algorithm for automatic detection of different morphological patterns in pulse signals of radial artery. Fisher’s Ratio was found useful in classifying distinct morphological patterns of pulse waveform. This together with the geometrical modeling showed excellent results in accurate detection of morphological patterns. In the case of any irregular and arbitrary waveforms (e.g. due to artifacts) this algorithm (and program) would correctly detected these as “no patterns found”. The algorithm is therefore suitable for characterization of pulse morphology variation with respect to time.
Considering the emphasis given to the nature of pulsemovement (nadi-gati) in Ayurveda (ancient Indian medical science) for pulse-based diagnosis, it appears worth investigating the characteristics of pulse morphology variation with respect to time. Our present study shows some characteristic features in terms of distinct morphological patterns and their consecutive occurrences that distinguish healthy cases, specific cardiac problems and diabetes.
Most significant distinction we have found between the healthy groups and diseased cases is that of the prominent presence of “H” i.e., pattern VIII in the former and its near total absence in the latter. Interestingly, the reflection index (= ratio of diastolic wave amplitude, say, AP2 and systolic wave amplitude, say, AP1) for the template structure of pattern VIII is within the normal standards [1,8]. So, in view of the heart physiology and some recently reported pulse waveform studies [18], this pattern does indicate healthy cardiac functions in terms of arterial blood flow and pressure variation.
We have found characteristic feature of the IHD in higher age-groups as—prominent presence of “F” (pattern IV) and/or “E” (pattern III*) or continuous patches of “D” (pattern III). Template structure of pattern IV has highest inter-wave distance index (= ratio of the interwave time measured at two-third of systolic peak and the total pulse time). This indicates slower and lesser arterial blood flow. Hence prominence of this pattern implies arterial blockage or weaker heart output. The value of this index in template structure of pattern III* is comparable with that of IV. This index in pattern III is lower than that of IV but is still higher than that for the remaining patterns. So, significant presence of these patterns in the pulse waveform may also be regarded as indicative of similar cardiac problems, as in the case of pattern IV.
Prominent patches of “E” (pattern III*) and higher (as compared to other patterns) frequency of “F” (pattern IV) is found as common among the morphology-strings of DM cases in our dataset. The augmentation index (= (AP1 – AP2)/AP1) of template structure of pattern III* is highest among all patterns so its prominence indicates arterial stiffness. This together with above-mentioned implication of pattern IV with regard to weak arterial blood flow is significant in view of the fact that all the cases of DM in this dataset had high risk (because of age > 45) of arterial blockage; some of them had had cardiac events associated with this problem.
These findings show promising scope of “morphology variation detection” as a supplementary tool for noninvasive techniques of detecting disorders in blood flow, cardio-vascular system and certain other physiological problems. Extended investigations with respect to type and duration of medication, etc. would provide deeper insight. Further studies on larger samples of different disease and age-groups would also help formulate some Gold standards for further research and validated applications in prognosis/diagnosis.
Integrated studies incorporating pulse signal recordings, with electrocardiogram (ECG) and photoplethysmographic (PPG), etc. would help deeper analysis of morphology variation and cardio-vascular functioning vis-à- vis pulse transit time (PTT), HRV and Blood Pressure Variability.
5. ACKNOWLEDGEMENTS
This work was carried out at IIT Bombay. G. B. Nawsupe had contributed to it as part of his M. Tech. (in Biomed. Engg.) Dissertation under the guidance of the first author. S. P. Wangikar was a research assistant in a project on Pulse Analysis undertaken by the first author. This project was part of a sponsored R. & D. project undertaken in collaboration with Dr. Medha Dhurandhar, Centre for Development of Advanced Computing (CDAC), Pune and Dr. G.D. Jindal, Electronics Div., Bhabha Atomic Research Centre (BARC), Mumbai. The authors thank them for providing the data. The authors also thankfully acknowledge IIT Bombay for the infrastructure and administrative support and the Ministry of Information Technology, Govt. of India for the financial support granted for this project.
![]()
![]()
REFERENCES
- Brown, H., Kozlowski, R. and Davey, P. (1997) Physiology and pharmacology of the heart. Blackwell, Oxford.
- Joshi, A.J., Chandran, S., Jayaraman, V.K. and Kulkarni, B.D. (2007) Arterial pulse system: Modern methods for traditional Indian medicine. Proceedings of the 29th International Conference of IEEE Engineering in Medical & Biolology Society, Vancouver, 22-26 August 2007, 608- 611.
- Joshi, R.R. (2004) A Biostatistical approach to ayurveda: quantifying the tridosha. Journal of Alternate & Complementary Medicine, 10, 879889.
- Joshi, R.R. (2005) Diagnostics using computational Nadi patterns. Mathematical and Computer Modeling, 41, 33- 47. doi:10.1016/j.mcm.2004.05.002
- Jindal, G.D., Ananthakrishnan, T.S., Mandlik, S.A., Sinha, V., Jain, R.K., Kini, A.R., Naik, M.A., Kataria, S.K., Mahajan, U.A. and Deshpande, A.K. (2003) Medical analyzer for the study of physiological variability and disease characterization. Technology Report, Bhaba Atomic Research Centre, Mumbai.
- Jindal, G.D., Ananthakrishnan, T.S., Rai, B.S., Madhyastha, M.N. and Jain, R.K. (2006) Plethysmographic techniques and applications in clinical medicine. Technology Report, Bhaba Atomic Research Centre, Mumbai.
- O’Ruke, M.F. (2004) Pulse waveform analysis and arterial stiffness: realism can replace evangelism and skepticism. Journal of Hypertension, 22, 1633-1634.
- Takazawa, K., Kobayashi, H., Shindo, N., Tanaka, N. and Yamashina, A. (2007) Relationship between radial and central arterial pulse wave and evaluation of central arotic pressure using the radial arterial pulse wave. Hypertension Research, 30, 219-228. doi:10.1291/hypres.30.219
- Joshi, A.J., Chandran, S., Jayaraman, V.K. and Kulkarni, B.D. (2007) Nadi tarangini: A pulse based diagnostic system. Proceedings of the 29th International Conference of IEEE Engineering in Medical & Biolology Society, Lyon, 22-26 August 2007, 2207-2210.
- Abhinav Sareen, M., Kumar, M., Santosh, J., Salhan, A. and Anand, S. (2008) Nadi Yantra: A robust system design to capture signals from the radial artery for noninvasive diagnosis. Proceedings of 2nd International Conference on Bioinformatics & Biomedical Engineering, Shanghai, 16-18 May 2008, 1387-1390.
- Abhinav Sareen, M., Kumar, M., Anand, S., Salhan, A. and Santosh, J. (2009) Nadi Yantra: A robust system design to capture signals from the radial artery for assessment of the autonomic nervous system non-invasively. Journal of Biomedical Science & Engineering, 2, 471- 479.
- Pichot, V., Gaspoz, J.M., Molliex, S., Antoniadis, A., Busso, T., Roche, F., Costes, F., Quintin, L., Lacour, J.R. and Barthelemy, J.C. (1999) Wavelet transform to quantify heart rate variability and to assess its instantaneous changes. Journal of Applied Physiology, 86, 1081-1091.
- Galinier, M., Pathak, A., Fourcade, J., Androdias, C., Curnier, D., Varnous, S., Boveda, S., Massabuau, P., Fauvel, M., Senard, J.M. and Bounhoure, J.P. (2000) Depressed low frequency power of heart rate variability as an independent predictor of sudden death in chronic heart failure. European Heart Journal, 21, 475-482. doi:10.1053/euhj.1999.1875
- Grigioni, M., Carotti, A., Del Gaudio, C., Morbiducci, U., Albanese, S.B. and D’Avenio, G. (2006) Multiresolution analysis of heart rate variability as investigational tool in experimental fetal cardiac surgery. Annals of Biomedical Engineering, 34, 799-809. doi:10.1007/s10439-006-9084-x
- Huang, C.-M., Chang, H.-C., Kao, S.-T., Li, T-C., Wei, C.-C., Chen, C., Liao, Y.-T. and Chen, F.-J. (2011) Radial pressure pulse and heart rate variability in heatand cold-stressed humans. Evidence Based Complementary & Alternate Medicine, 14, 1-9.
- Wang, B. and Xiang, J. (1998) Detecting system and power spectral analysis of pulse signals of human body. 4th International Conference on Signal Processing Proceedings, Beijing, 12-16 October 1998, 1646-1649.
- De Melis, M., Morbiducci, U., Rietzschel, E.R., De Buyzere, M., Qasem, A., Van Bortel, L., Claessens, T., Montevecchi, F.M., Avolio, A. and Segers, P. (2009) Blood pressure waveform analysis by means of wavelet transform. Medical & Biological Engineering & Computting, 47,165-173. doi:10.1007/s11517-008-0397-9
- Hashimoto, J., Imai, Y. and O’Rouke, M.F. (2007) Indices of pulse wave analysis are better predictors of left ventricular mass reduction than cuff pressure. American Journal of Hypertension, 20, 378-384. doi:10.1016/j.amjhyper.2006.09.019
- Joshi, R.R., Wangikar, S.W. and Nawsupe, G. (2008) Instrumentation based pulse diagnosis. DSS Technical Report, Ministry of Communication & Information Technology, New Delhi.
- Diggle, P. and Fisher, N.I. (1991). Nonparametric comparison of cumulative periodograms. Applied Statistics, 40, 423-434. doi:10.2307/2347522
- Xu, L., Zhang, D., Wang, K., Li, N. and Wang, X. (2007) Baseline wander correction in pulse waveforms using wavelet-based cascaded adaptive filter. Computers in Biology & Medicine, 37, 716-731. doi:10.1016/j.compbiomed.2006.06.014
- Nawsupe, G. and Joshi, R.R. (2011) Modified wavelet-based technique for baseline drift removal and diagnostic scope of spectral energy of radial pulse signal. International Journal of Biomedical Engineering and Technology, 6, 1-13. doi:10.1504/IJBET.2011.040450
- Karamchandani, S., Merchant, S.N., Desai, U.B. and Jindal, G.D. (2010) Application of crisp and fuzzy clustering algorithms for identification of hidden patterns from plethysmographic observations on the radial pulse. IEEE Engineering in Medical & Biolology Society, 1, 3978-3981.
- Pan, J. and Tompkins, W.A. (1985) Real-time QRS detection algorithm. IEEE Transactions in Biomedical Engineering, 32, 230-237. doi:10.1109/TBME.1985.325532
- Thompson, J.D., Higgins, D.G. and Gibson, T.J. (1994) CLUSTAL W: improving the sensitivity of progressive multiple sequence alignment through sequence weighting, position specific gap penalties and weight matrix choice. Computer Applications in Biological Sciences, 10, 19-29.
- Chou, K.C. and Shen, H.B. (2007) Review: Recent progresses in protein subcellular location prediction. Analytical Biochemistry, 370, 1-16. doi:10.1016/j.ab.2007.07.006
- Du, Q.S., Huang, R.B., Wang, S.Q. and Chou, K.C. (2010) Designing inhibitors of M2 proton channel against H1N1 swine influenza virus. PLoS One, 5, e9388. doi:10.1371/journal.pone.0009388
APPENDIX
Essence of Our Algorithms for Detection of Peaks and Onset Points:
Pulse signal is recorded by the instrument (VASOMON) at a constant sampling frequency 100 Hz. For peak detection purpose we successively filter out this signal using linear digital band-pass filter with lower cutoff frequency 1.5 Hz and higher cutoff frequency 20 Hz. This particular range is chosen, as most of the information of pulse is contained in this range. Our peak-detection algorithm is an extension of the approach of Pan and Tompkins [24]. Their algorithm was confined to QRS detection in ECG waveforms. We have modified and extended it for detection of peaks in more complicated waveforms, viz., those of pulse signals.
Considering the possibility of local maxima and variation in the morphology patterns, our algorithm adaptively recognizes the peaks in a pulse waveform based on digital analysis of slope of P wave, amplitude of the peak in each beat and the distance (N-N interval) between two previous peaks. (The first two peaks are identified by local maxima search).
Detection of Onset Points: Having identified a peak in any period, we scan n1 and n2 time-points backwards from the peak’s time point and get two local minima by using sliding window of adaptive size depending upon relative variation in amplitude in the local region. The onset point for this period is then chosen as the global minimum of all the local minima identified in this adaptive search. Here, n1 and n2 are the number of points we find out adaptively in terms of distance between onset and peak points of the previous period [22].
The algorithm of Xu et al. [21] directly chooses the minimum of 20 backward points; they had tested it only on simulated data and therefore did not notice the sizable error due to possible trapping in a wrong local minimum, which does occur in the case of real data. Similar limitation lies in their approach to identifying the peaks. Our algorithm is free of such lacunae.
Average accuracy of detected peaks and onset points by our algorithm was found >95%.
NOTES
*Corresponding author.