Journal of Biomedical Science and Engineering
Vol. 5 No. 4 (2012) , Article ID: 18511 , 10 pages DOI:10.4236/jbise.2012.54023
Computer-assisted formulas predicting cancer mortality risk after exposure to acute low dose ionizing radiation in humans
![]()
Morristown-Hamblen Healthcare System, Morristown, USA
Email: sung.chung@comcast.net
Received 16 January 2012; revised 17 February 2012; accepted 29 February 2012
Keywords: Acute Low Dose Radiation; Radiation-Induced Cancer Mortality; Formula of Cancer Mortality; Formula of Leukemia Mortality; Safety in Radiotherapy; Radiation Hazard and Injury
ABSTRACT
A clear relationship between dose of radiation and mortality in humans is still not known because of lack of human data that would enable to determine human tolerance in total body irradiation. Human data for analysis have been primarily from radiation accidents, radiotherapy and the atomic bomb victims. A general formula that predicts mortality probability as a function of dose rate and duration of exposure to acute high dose ionizing radiation in humans was published by the author, applying the “probacent” model to the reported data on animal-model-predicted dose versus mortality. In this study, the “probacent” model is applied to the data on dose versus cancer mortality risk, published by the United Nations (UNSCEAR, 2010) and other investigators to construct general formulas expressing a relationship between dose and solid cancer or leukemia mortality probability after exposure to acute low dose ionizing radiation in humans. There is a remarkable agreement between formula-derived and published values of dose and solid cancer or leukemia mortality probability (p > 0.99). The general formula might be helpful in preventing radiation hazard and injury in acute low dose ionizing radiation, and for safety in radiotherapy.
1. INTRODUCTION
A clear and exact quantitative relationship between dose of radiation and mortality in humans is still not known because of lack of human data that would enable to determine LD50 for humans in total body irradiation. Analysis of human data has been primarily from radiation accidents, radiotherapy and the atomic bomb victims [1-7].
Van Middlesworth published worldwide increased levels of 131I fallout in animal thyroid glands after nuclear weapon tests and also immediately after the nuclear reactor accident at Chernobyl during the period from 1954-1987 [8-10].
Consequently, laboratory animals have been used to investigate the relationship between radiation exposure and biomedical effects in total body irradiation, and further to possibly derive a general predictive mathematical formula expressing a dose-effect curve [1,2,11,12].
The death rate equation of the “probacent” mathematical model developed by the author [13] was applied to the animal-model predicted data on dose versus mortality in humans published by Cerveny, MacVittie and Young [1] to construct a general formula that expresses a relationship among dose rate, duration of exposure and mortality in acute high dose ionizing total body irradiation in humans [14]. There was a remarkable agreement between formula-predicted and published estimated LD50 and also mortalities (p > 0.995 in χ2 goodness-of-fit test).
The death rate equation was applied to predict agespecific death rate in the US elderly population, 2001 [15], and to express a relationship between dose rate and survival time in total body irradiation in mice [16]. The results of the above two studies revealed a close agreement between “probacent”-formula-derived and published-reported values of death rates in humans or survival times in mice (p > 0.995 in χ2 test).
A mathematical model of the “probacent”-probability equation, Eq.1 was developed on the basis of animal experiments, clinical applications and mathematical reasoning to express a relationship among intensity of stimulus, duration of exposure and response in biological phenomena [15,17,18].
In this study, the “probacent” model is applied to the currently available data published by the United Nations (UNSCEAR 2010) [19] and other investigators [20] to construct a general formula that would express a relationship between dose and solid cancer or leukemia mortality risk after exposure to acute low dose ionizing radiation in humans.
The model of “probacent”-probability equation expressed by Eq.1 was constructed from experimental studies on animals to express survival probability in mice exposed to g-force in terms of magnitude of acceleration and exposure time [17,21]; to express a relationship among intensity of stimulus or environmental agent (such as drug [17,18,22], heat [23], pH [24] and electroshock [23,25], duration of exposure and biological response in animals.
The model has been applied to data in the literature to express carboxyhemoglobin levels of blood as a function of carbon monoxide concentration in air and duration of exposure [26,27]; to express a relationship among plasma acetaminophen concentration, time after ingestion and occurrence of hepatotoxicity in man [28,29]; to predict survival probability in patients with heart transplantation [30]; to predict survival probability in patients with malignant melanoma [31]; to predict survival probability in patients with acute myelogenous leukemia [32]; to express a relationship among age, height and weight, and percentile in Saudi and US children of 6 - 16 years of age [33]; to predict the percentile of heart weight by body weight from birth to 19 years of age [34]; and to predict the percentile of serum cholesterol levels by age in adults [35].
The model was applied to the United States life tables, 1992 and 2001 reported by the National Center for Health Statistics (NCHS) to construct formulas expressing age-specific survival probability, death rate and life expectancy in US adults, men and women [13,15,36,37].
Mehta and Joshi successfully applied the “probacent”- probability equation, Eq.1 to use model-derived data as an input for radiation risk evaluation of Indian adult population in their studies [38].
 (1a)
(1a)
 (1b)
(1b)
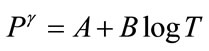
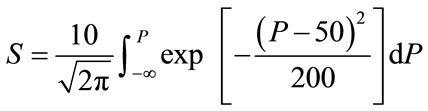
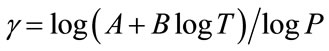
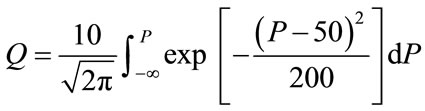
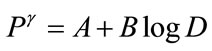
where T = time after biomedical insult, diagnosis of cancer or age; Q is percent survival probability or mortality probability; P is “probacent” (abbreviation of probability percentage) and considered to be a relative biological amount of reserve for survival or loss of reserve for survival; “probacent” of 0, 50 and 100 corresponds to mean- 5 S.D., mean and mean + 5 S.D.; one “probacent” is equivalent to 0.1 S.D. in a normal distribution. In addition, 0, 50 and 100 “probacent” seem to correspond to 0, 50 and 100 percent probability in mathematical prediction problems in terms of percentage. Therefore, the probability, Q could be used to predict probability in general biomedical phenomena. “Probacent” values are obtainable from a list of conversion of percent probability into “probacent” that was published by the author (Table 6 of Ref. [9] and Table 4 of Ref. [10]); γ, A and B are constants; A is an intercept and B a slope; γ represents a curvature (a shape of a curve) and expressed by the following equation:
To my knowledge, there seem to be no general mathematical models in the literature that express the quantitative relationship between dose and cancer mortality risk after exposure to acute low dose ionizing radiation in total body irradiation in humans.
The purpose of this study is to derive a general mathematical formula that expresses a relationship between dose and cancer mortality risk after exposure to acute low dose ionizing radiation in humans. The mathematical model of the “probacent”-probability, Eq.1 is employed in this study to predict solid cancer or leukemia mortality probability as a function of dose.
2. MATERIALS AND METHODS
The United Nations Scientific Committee on the Effects of Atomic Radiation (UNSCEAR 2010) published the Committee’s current estimates for the risk of radiationinduced fatal cancer in 2011 as shown in Table 1 [19]. These cancer risk estimates are similar to those previously made by the Committee’s UNSCEAR 2006 [39]. These estimates are based on the generalized EAR model of linear-quadratic dose-response [39]. The objective of the UNSCEAR is to provide evidence-based estimates of the risks to harm health from exposure to low dose and low dose rates of radiation that may be received, throughout the world, by the general public, workers and patients undergoing medical procedures [19].
The author uses averaged values, 0.565% (range of 0.36% - 0.77%) and 5.75% (range of 4.3% - 7.2%) of solid cancer mortality risk estimates of all solid cancer combined; and 0.04% (range of 0.03% - 0.05%) and 0.8% (range of 0.6% - 1.0%) of leukemia mortality risk following after exposure to an acute low dose of 0.1 and 1 Gy (Table 1), respectively to derive a general formula.
Wall, Kendall, Edwards, Bouffler, Muirhead and Meara of Health Protection Agency, the United Kingdom published the risk from X-rays and other low dose radiation in X-ray examinations in 2006 [20]. The range of risk is one in 10,000 to one in 1000 for the category of low risk band of X-ray examinations such as CT, angiography, contrast studies of the alimentary, biliary and urinary tracts, and interventional radiology. The averaged value of 30 mGy (range of 10 - 50 mGy in the low risk
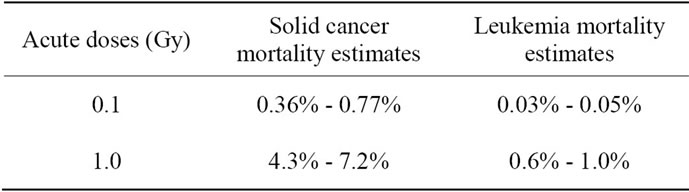
Table 1. Lifetime risk of radiation-induced cancer mortality estimates of all ages and both sexes reported by the United Nations (UNSCEAR 2010) [19].
band category of X-ray examinations [20,40,41] is used to construct a general formula.
The author takes an averaged value of 0.055% (range of 0.01% - 0.1%) as a cancer mortality risk, and 0.05% as a solid cancer mortality risk and 0.005% as a leukemia mortality risk for 30 mGy in construction of a general formula as follows:
0.05% value is derived on the basis of the data on solid cancer mortality and leukemia in Table 1 with an assumption that the averaged ratio of solid cancer mortality risk to total cancer mortality risk for 100 and 1000 mGy is applicable for 30 mGy.
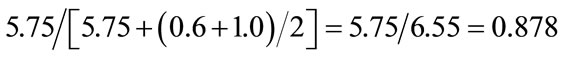
Ratio of solid cancer mortality to total cancer mortality for 100 mGy:

Ratio of solid cancer mortality to total cancer mortality for 1000 mGy:
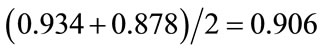
Average ratio of the above two ratios:
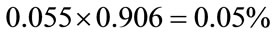
The solid cancer mortality risk for 30 mGy:
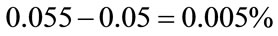
The leukemia mortality risk for 30 mGy:
General formulas, Eqs.2 and 3 that express a relationship between dose and solid cancer or leukemia mortality risk (%) in acute low dose ionizing radiation are constructed on the basis of the above data.
The data are plotted on a log-log graph paper as illustrated in Figure 1 for a better mathematical analysis. A close look at the data points of solid cancer mortality probabilities indicates that three data points of 30 mGy versus 0.05%, 100 mGy versus 0.565% and 1000 mGy versus 5.75% appear to fall on an upward curved line, suggesting a γ value >1 and an applicability of the “probacent”-probability equation, Eq.1. Figure 2 similarly illustrates that three data points of leukemia mortality
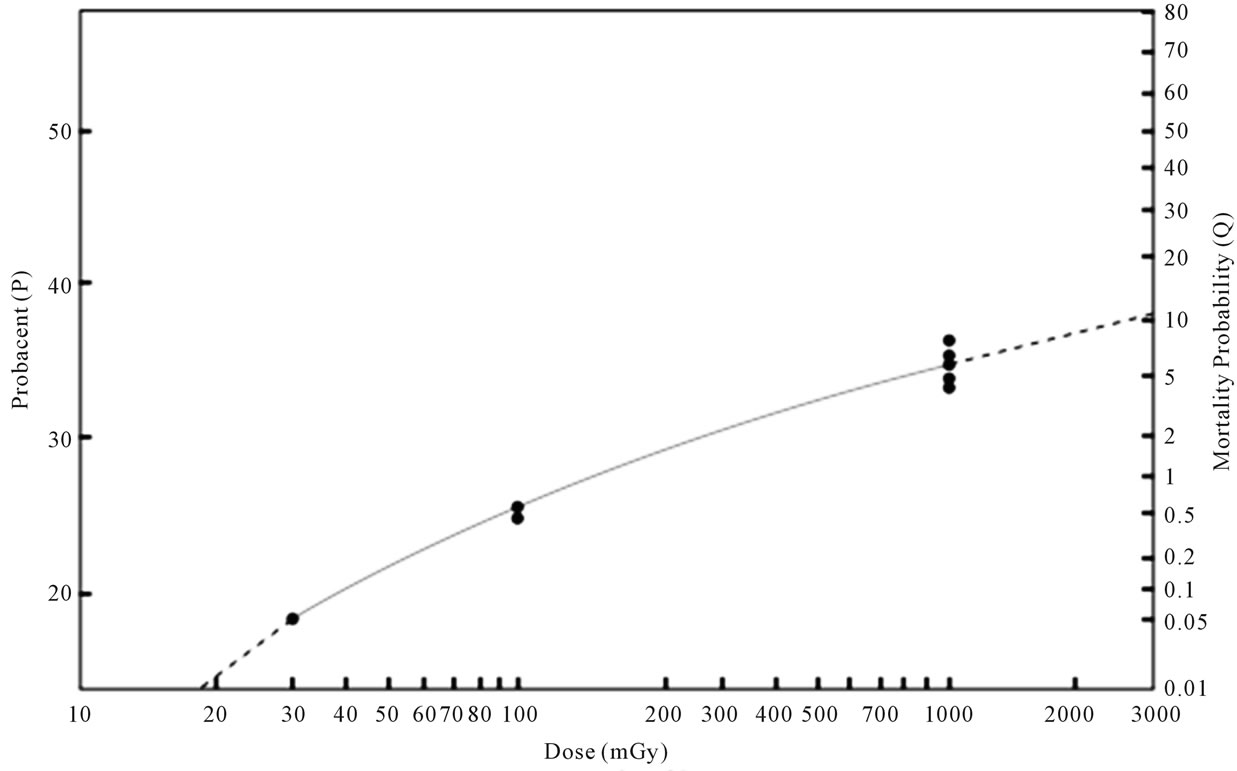
Figure 1. Relationship between dose and solid cancer mortality probability after exposure to acute low dose ionizing radiation in humans. The abscissa represents dose in mGy (log scale). The ordinate on the right side represents solid cancer mortality probability (Q) in percentage. The ordinate on the left side represents “probacent” (P) corresponding to mortality probability (Q). The Data points of closed circles of reported-estimated solid cancer mortality probabilities after exposure to dose of 30, 100 and 1000 mGy shown in Table 2 appear to fall on or very close to the solid curved line representing Eq.2.
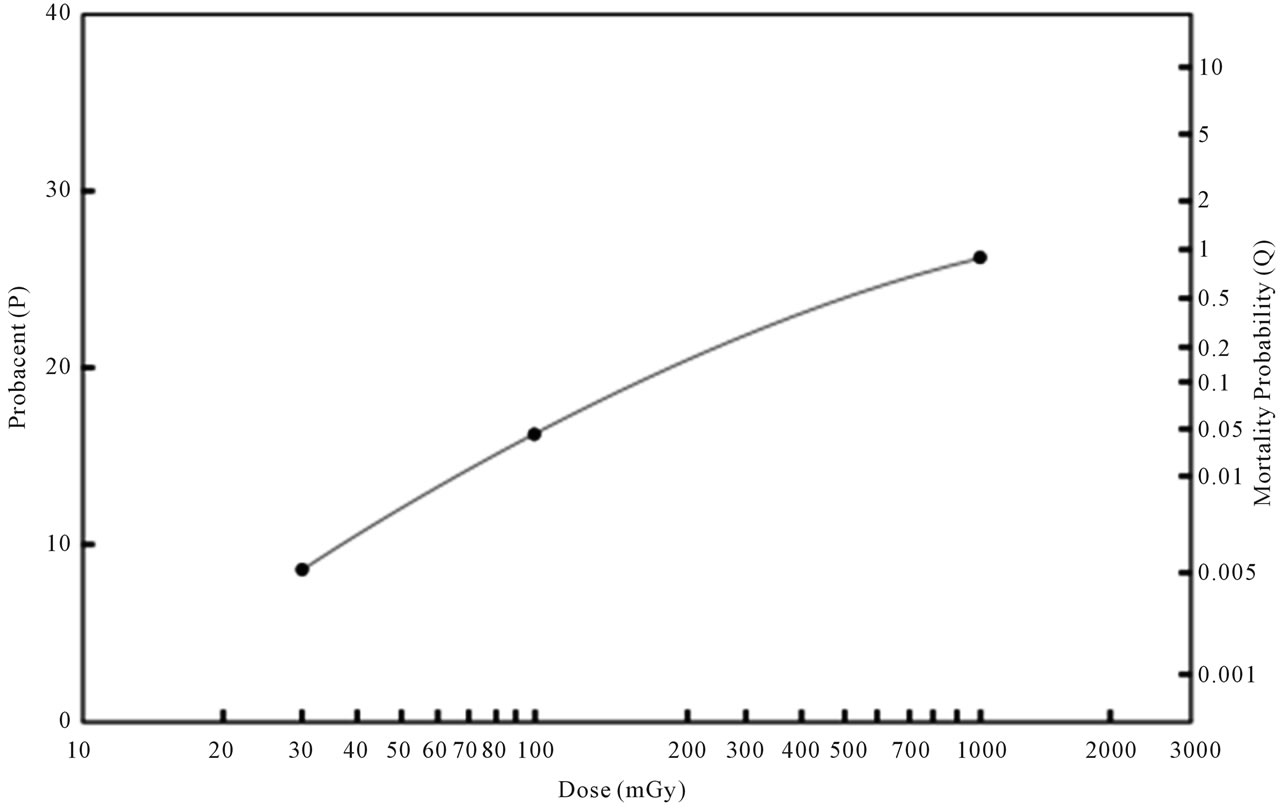
Figure 2. Relationship between dose and leukemia mortality probability of life-time risk after exposure to acute low dose ionizing radiation in humans. The abscissa represents dose in mGy (log scale). The ordinate on the right side represents leukemia mortality probability (Q) in percentage. The ordinate on the left side represents “probacent” (P) corresponding mortality probability Q). The data points of closed circles of reported estimated leukemia mortality probabilities after exposure to 30, 100 and 1,000 mGy of References [19] and [20] shown in Table 3 appear to fall on the solid curved line representing Eq.3. The other data points of reported estimated leukemia mortalities for 1000 mGy of Reference [39] in Table 3 are not plotted but, if plotted, would fall very close to the solid line of Eq.3.
probabilities appear to fall on a slightly upward curved line.
The mathematical method how to construct a general formula is described in Appendix and the author’s previous publications [13,42]. The best fitting γ value in Eq.1a is determined by a statistical method of the least sum of squares of curved regression described in the author’s previous publication [43]. Eqs.2 and 3 are constructed to predict solid cancer and leukemia mortality probability (Q) as a function of radiation dose (D) after exposure to acute low dose ionizing radiation in humans, respectively.
2.1. Formula of Solid Cancer Mortality Probability
 (2a)
(2a)
 (2b)
(2b)
where D = dose of radiation in mGy, P = “probacent”, and Q = solid cancer mortality probability (%).
2.2. Formula of Leukemia Mortality Probability
 (3a)
(3a)
 (3b)
(3b)
where D and P are same as above; Q = leukemia mortality probability (%).
2.3. Description of the Computer Program
Computer programs are written in UBASIC for IBM microcomputer and compatibles for Eqs.2 and 3. The computer programs use a formula of approximation instead of integral of Eqs.2b and 3b because the computer cannot perform integral [18,42]. Mathematical transformation of integral, Eqs.2b and 3b to the formula of approximation in computer programming is described in the author’s book [42]. A representative computer program for Eq.2 is illustrated in Figure 3 to calculate solid
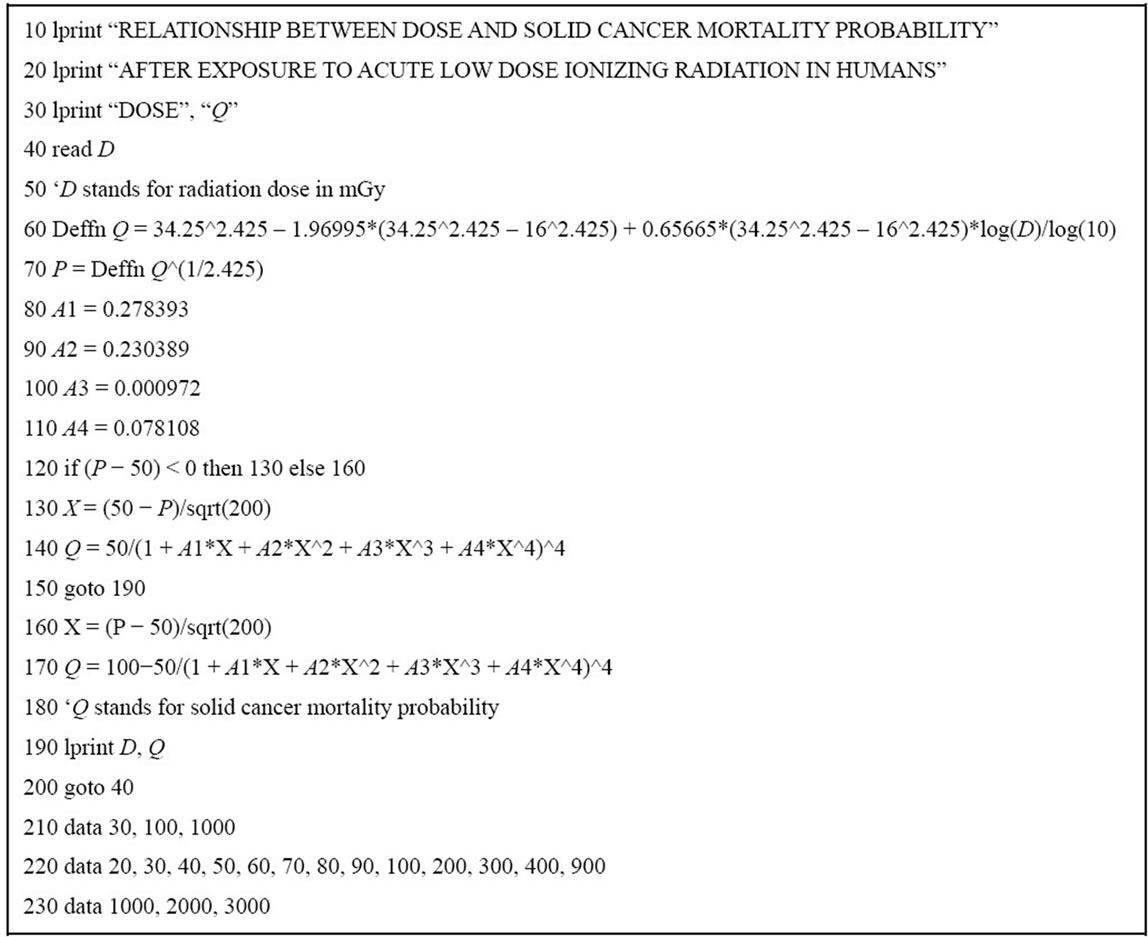
Figure 3. Computer program for Eq.2 to calculate solid cancer mortality probability (%) in life-time follow-up after exposure to acute low dose ionizing radiation in humans. Part of the results of execution of the program are shown in Table 2 (see text).
cancer mortality probability as a function of dose after exposure to acute low dose ionizing radiation in humans.
2.4. Statistical Analysis
A χ2 goodness-of-fit test (logrank test) [44] is used to test the fit of mathematical model to the data on dose versus mortality probability in acute low dose ionizing radiation in humans [19,20,39]. The differences are considered statistically significant when p < 0.05.
3. RESULTS
Table 2 shows the results of solid cancer mortality risk in percentage as a function of dose after exposure to acute low dose ionizing total body irradiation in humans. Solid cancer means excluding leukemia from total cancer developed in life-time follow-up observations after exposure in the life span studies (LSS).
Table 2 also shows comparison of the formula-derived values with the reported data on acute low dose versus solid cancer mortality probability (%). Differences between both values of formula-derived and reported estimated solid cancer mortality probabilities are statistically not significant (p > 0.99). A close agreement is seen between both values in Table 2. The maximum difference is ±0.75% in exposures to 1000 mGy.
Figure 1 illustrates the relationship between dose and solid cancer mortality probability after exposure to acute low dose ionizing radiation in humans. The closed circles of data points fall on or appear to fall close to the solid curved line expressed by Eq.2. Dashed lines below and above beyond the ends of the solid curved line of Eq.2 represent extrapolation of the Eq.2-expressed solid line.
Table 3 shows the results of leukemia mortality risk in percentages as a function of dose after exposure to acute low dose ionizing total body irradiation in humans. Comparison of both values of formula-derived and reported estimated mortality probabilities reveals a close agreement without statistically significant differences (p > 0.995).
Figure 2 illustrates the relationship between dose and leukemia mortality probability after exposure to acute low dose ionizing radiation in humans. The closed circles of data points of References [19] and [20] in Table 3 which Eq.3 is based on in its construction fall on the solid curved line expressed by Eq.3. The other data-
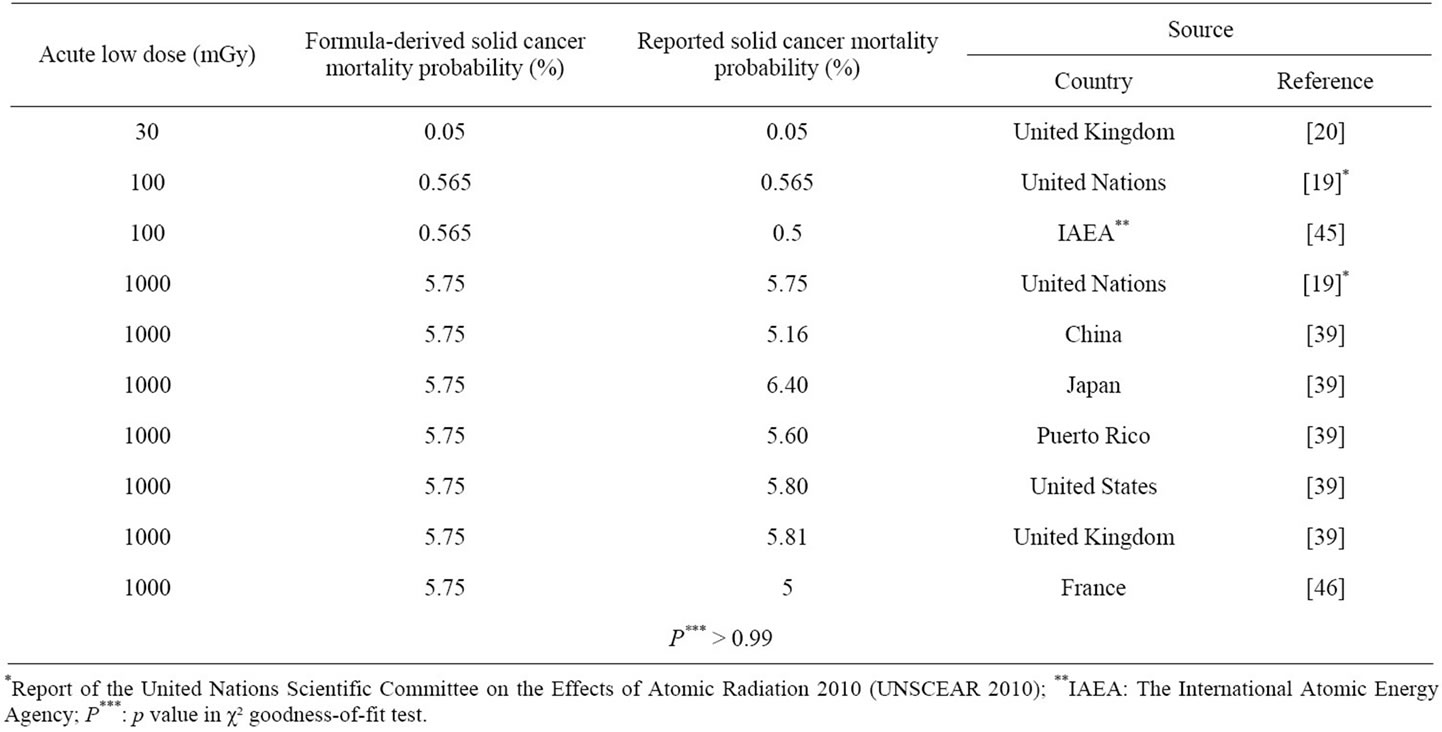
Table 2. Relationship between dose and solid cancer mortality probability after exposure to acute low dose ionizing radiation in humans.
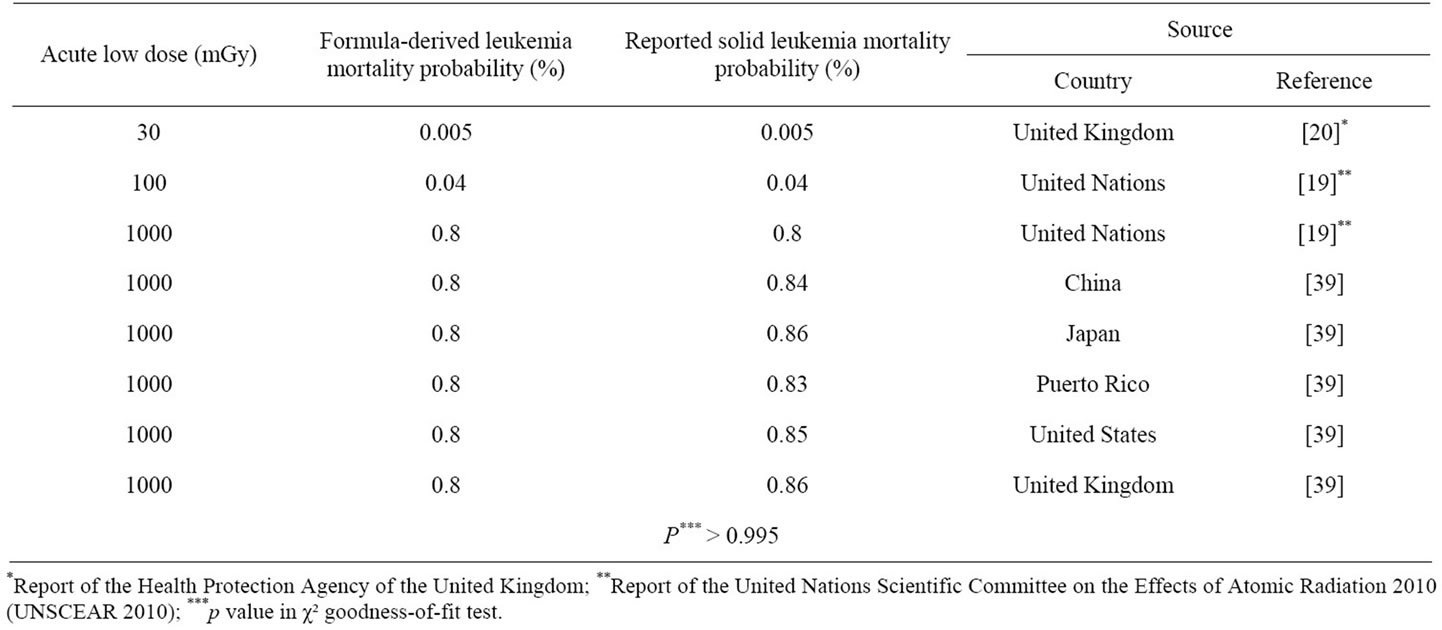
Table 3. Relationship between dose and leukemia mortality probability after exposure to acute low dose ionizing radiation in humans.
points of Reference [39] in Table 3 are not plotted in Figure 2 but, if plotted, would fall very close to the solid curved line at 1000 mGy expressed by Eq.3.
4. DISCUSSION
Tables 2 and 3, and Figures 1 and 2 reveal a virtually remarkable agreement between formula-derived and reported-estimated data on solid cancer (P > 0.99) or leukemia (P > 0.995) mortality probabilities after exposure to acute low dose ionizing radiation in humans.
Extrapolation of the line expressed by Eq.2, illustrated by the dashed lines in Figure 1 might be possible beyond the lower and upper ends. However, it would require more relevant human data on solid cancer risk from further studies to examine the validity of the extrapolation as well as predictions for doses other than 30, 100 and 1000 mGy by the solid line. This study is primarily based on the UNSCEAR’s report, 2010 [19].
The United Nations Scientific Committee on the Effects of Atomic Radiation (UNSCEAR) has been undertaking reviews and evaluations of global and regional exposures to radiation, and also evaluates evidence of radiation-induced health effects including cancers and deaths in exposed groups, including survivors of the atomic bombings in Japan. The UNSCEAR provides international standards for the protection of the general public and workers against ionizing radiation [19].
If the γ value of Eqs.1a, 2a and 3a becomes equal to one, these Eqs.1-3 represent a lognormal distribution. Therefore, Eqs.1-3 of the “probacent”-probability equation seem to represent a generalized lognormal distribution. The γ value is relatively rarely one, indicating a straight line on the graph when data points are plotted on an X-Y graph paper as seen in Figures 1 and 2. This phenomenon seems to be analogous in physics to that light path is actually curved when passing through a gravitational field of space but appears straight [48,49]. If the base of logarithm is one, the lognormal distribution becomes a normal distribution (log1 1n = n) [42,47].
Reduction in dose rates decreases mortality in humans and increases survival time in mice exposed to ionizing radiation [14,16]. Cui and his coworkers demonstrated that a fractionated total body irradiation (FTBI) increased survival rates and therapeutic effects in bone marrow transplantation in mice [50]. This suggests that Eqs.2 and 3 with different values of constants, A, B and γ might be possibly applicable to data on dose-effect curves for a chronic very low dose rate for a prolonged duration like years in total body irradiation in subjects such as workers of nuclear plants and professionals of radiology services (16).
It is the current understanding in the studies of the development of cancer after radiation exposure that the process starts by the mutation of one or more genes of the DNA of a single “stem-like” cell in a body organ contributes to cancer development unless affected cells have repaired damaged DNA. Body responses to radiation exposure reflect status of living body in which pathologic changes, physiologic repair and inherent aging process are concurrently occurring [11]. There is a strong epidemiological evidence that exposure of humans to radiation at moderate and high levels can lead to excess incidence of solid tumors in many body organs and of leukemia [19].
5. CONCLUSION
General formulas, Eqs.2 and 3 constructed in this study are applied to the published data on dose and solid cancer or leukemia mortality probability estimates in humans after exposure to acute low dose ionizing radiation [19,20]. A close agreement is present between both values of formula-derived and published solid cancer or leukemia mortality probability estimates as shown in Tables 2 and 3. The general formulas might be helpful in preventing radiation hazard and injury in acute low dose radiation, and for safety in radiotherapy. Findings in this study and the “probacent” model might be hopefully useful in research on human tolerance and safety in exposures to very low dose rates for long durations of exposure like years, that is, in chronic very low dose ionizing total body irradiation for nuclear workers and radiology professionals. The formulas, Eqs.2 and 3 are constructed on the basis primarily of currently available data on dose-effect relations published by the United Nations and other investigators [19,20,39,45,46], and so would need further research on more additional relevant human data for their verifications.
6. ACKNOWLEDGEMENTS
The author is grateful to Dr. C. W. Sheppard for his teaching and valuable advice and encouragement in my research. The author would like to thank Dr. Lester Van Middlesworth for his outstanding research on radiation and thyroid, and for his teaching and advices in my research related to thyroid physiology, using 131I radioisotopes at the Department of Physiology and Biophysics, the University of Tennessee.
![]()
![]()
REFERENCES
- Cerveny, T.J., MacVittie, T.J. and Young, R.W. (1989) Acute radiation syndrome in humans. In: Walker, R.I. and Cerveny, T.J., Eds., Medical Consequences of Nuclear Warfare, TMM Publications, Office of the Surgeon General, Falls Church, 15-36.
- Jones, T.J., Morris, M.D., Wells, S.M. and Young, R.W. (1986) Animal mortality resulting from uniform exposures to photon radiations: Calculated LD50 and a compilation of experimental data. Oak Ridge National Laboratory, Oak Ridge, Tennessee. doi:10.2172/6940829
- Nénot, J. (2009) Radiation accidents over the last 60 years. Journal of Radiological Protection, 29, 301-320. doi:10.1088/0952-4746/29/3/R01
- Abrahamson, S. Bender, M.A., Boecker, R.B., et al. (1993) Health effect models for nuclear power plant accident consequence analysis. US Government Printing Office, Washington, DC.
- Donnelly, E.H., Nemhauser, J.B., SMITH, M., et al. (2010) Acute radiation syndrome: Assessment and management. Southern Medical Journal, 103, 541-544. doi:10.1097/SMJ.0b013e3181ddd571
- Department of Radiology, University of Illinois (1990) Acute effects of whole body irradiation: Lesson from Chernobyl. http://www.uic.edu/com/uhrd/manuscript/section4/section4.html
- Baverstock, K.F., Ash, P.J.D. (1983) A review of radiation accidents involving whole body exposure and the relevance to the LD50/60 for man. British Journal of Radiology, 56, 837-849. doi:10.1259/0007-1285-56-671-837
- Van Middlesworth, L. (1989) World wide iodine fallout in animal thyroid, 1954-1987. In: Ashizawa, K., Yamashita, S. and Nagataki, S., Eds., Radiation and the Thyroid, Excerpta Medica, Amsterdam, 36-56.
- Van Middlesworth, L. (1989) Effects of radiation on the thyroid gland. Advanced Internal Medicine, 34, 265-284.
- Simon, S.L., Bouville, A. and Land, C.E. (2006) Fallout from nuclear weapon tests and cancer risks. American Scientist, 94, 48-57. doi:10.1511/2006.1.48
- Sacher, G.A. (1960) On the relation of radiation lethality to radiation injury and its relevance for the prediction problem. 19th International Congress of Radiology, 23- 30 July 1959, 1223-1232.
- Travis, E.L., Peters, L.G., Thames, H.D., et al. (1985) Effects of dose-rate on the total body irradiation: Lethality and pathologic findings. Radiology and Oncology, 4, 341-151. doi:10.1016/S0167-8140(85)80122-5
- Chung, S.J. (1995) Formula expressing life expectancy, survival probability or death rate in life table at various ages in US adults. International Journal of Biomedical Computing, 39, 209-217. doi:10.1016/0020-7101(94)01068-C
- Chung, S.J. (2011) Predictive formulas expressing relationship among dose rate, duration of exposure and mortality probability in total body irradiation in humans. Journal of Biomedical Science and Engineering, 4, 497- 505. doi:10.4236/jbise.2011.47063 http://www.scirp.org/journal/Paperinformation.aspx?ID=6427
- Chung, S.J. (2007) Computer-assisted predictive formulas expressing survival probability and life expectancy in US adults, men and women, 2001. Computer Methods and Programs in Biomedicine, 86, 197-209. doi:10.1016/j.cmpb.2007.02.009
- Chung, S.J. (2011) predictive formulas expressing relationship between dose rate and survival time in total body irradiation in mice. Journal of Biomedical Science and Engineering, 4, 707-718. doi:10.4236/jbise.2011.411088 http://www.scirp.org/journal/Paperinformation.aspx?paperID=8523
- Chung, S.J. (1960) Studies on a mathematical relationship between stress and response in biological phenomena. Republic of Korea Journal of the National Academy of Sciences, 2, 115-162.
- Chung, S.J. (1986) Computer-assisted predictive formulas expressing among metrazol dose and time and mortality in mice. Computer Methods and Programs in Biomedicine, 22, 275-284. doi:10.1016/0169-2607(86)90004-0
- United Nations (2011) Report of the United Nations Scientific Committee on the Effects of Atomic Radiation 2010 (UNSCEAR 2010). United Nations, New York. http://uscear.org/unscear/about_us/sessions.html
- Wall, B.F., Kendall, G.M., Edwards, A.A., Bouffler, S., Muirhead, C.R. and Meara, J.R. (2006) What are the risks from medical X-rays and other low dose radiation? British Journal of Radiology, 79, 285-284. doi:10.1259/bjr/55733882
- Chung, S.J. (1959) Studies of positive radial acceleration on mice. Journal of Applied Physiology, 14, 52-54.
- Boak, H. and Chung, S.J. (1962) Studies on a relationship between dose, time and percentage of occurrence of response and a method of evaluation of combined action in drugs. The New Medical Journal, 5, 35-82.
- Kim, C.C. and Chung, S.J. (1962) Studies on a relationship between stress, duration of exposure and percentage of response in goldfish to single, double, and triple stresses of acceleration, electroshock, heat, chemical and osmotic stimuli. Republic of Korea Theses of Catholic Medical College, 5, 257-336.
- Cho, D.W. and Chung, S.J. (1961) Studies of tolerance of Paramecium caudatum to hydroxyl ions. Journal of Yamaguchi Medical School, 8, 151-160.
- Chung, S.J. (1989) Computer-assisted mathematical relationship among electroshock voltage and duration of exposure and occurrence of convulsion in mice. Computer Methods and Programs in Biomedicine, 28, 23-30. doi:10.1016/0169-2607(89)90177-6
- Forbes, W.H., Sergent, F. and Roughton, F.J.W. (1988) The risk of carbon monoxide uptake by normal men. American Journal of Physiology, 143, 594-608.
- Chung, S.J. (1988) Formula predicting carboxyhemoglobin resulting from carbo monoxide exposure. Veterinary and Human Toxicology, 30, 528-532.
- Forbes, L.F., Roscoe, P., Wright, N. and Brown, S.S. (1991) Plasmaparacetamol half-life and hepatic necrosis in patients with paracetamoloverdosage. Lancet, 1, 519- 522.
- Chung, S.J. (1989) Computer-assisted predictive mathematical relationship among plasma acetaminophen concentration, time after ingestion and occurrence of hepatotoxicity in man. Computer Methods and Programs in Biomedicine, 28, 37-43. doi:10.1016/0169-2607(89)90179-X
- Chung, S.J. (1993) Formula predicting survival probability in patients with heart transplantation. International Journal of Biomedical Computing, 32, 211-221. doi:10.1016/0020-7101(93)90015-X
- Chung, S.J. (1991) Formula predicting survival in patients with invasive malignant melanoma. International Journal of Biomedical Computing, 28, 37-43. doi:10.1016/0020-7101(91)90051-F
- Chung, S.J. (1991) Formula predicting survival probability in patients with acute myelogenous leukemia. International Journal of Biomedical Computing, 29, 283-293. doi:10.1016/0020-7101(91)90045-G
- Chung, S.J. (1994) Formulas expressing relationship among age, height and weight and percentile in Saudi and US children of age 6-16 years. International Journal of Biomedical Computing, 37, 259-272. doi:10.1016/0020-7101(94)90124-4
- Chung, S.J. (1990) Formulas predicting the percentiles of heart weight by body weight in subjects from birth to 19 years of age. International Journal of Biomedical Computing, 26, 257-269. doi:10.1016/0020-7101(90)90049-Z
- Chung, S.J. (1990) Formulas predicting the percentiles of serum cholesterol levels by age in adults. Archives of Pathology and Laboratory Medicine, 114, 869-895.
- Arias, E. (2004) United States life tables, 2001. National Vital Statistics Report, 52, 1-40.
- Chung, S.J. (1997) Comprehensive life tables of computer-assisted predictive mathematical relationship among age and life expectancy, survival probability or death rate in US adults. Computer Methods and Programs in Biomedicine, 52, 67-73. doi:10.1016/S0169-2607(96)01778-6
- Mehta, S.C. and Joshi, H.C. (2004) Model based point estimates of survival/death rates: An input for radiation risk estimation in Indian context. Indian Journal of Nuclear Medicine, 19, 16-18.
- United Nations (2008) Report of the United Nations Scientific Committee on the Effects of Atomic Radiation 2006 (UNSCEAR 2006), Vol. 1 (Annex A, Tables 59 and 65). United Nations, New York. http://www.unscear.org/unscear/en/publications/2006_1.html
- Brenner, D.J., Doll, R., Goodhead, D.T., Hall, E.J. Land, C.E., Little, J.R., Lubing, H.J., Preston, D.L., Preston, R.J., Puskin, R.J., Ron, E., Sachs, R.K., Samet, J.M., Setlow, R.B. and Zaide, M. (2003) Cancer risks attributable to low doses of ionizing radiation: Assessing what we really know. Proceedings of the National Academy of Sciences, 25, 13761-13766. http://www.pnas.org/content/100/24/13761
- Yu, L., Liu, X., Leng, S., Kofler, J.M., Ramierez-Giraldo, J.C., Qu, M., Christener, J., Fletcher, J.G. and McCollough C.H. (2009) Radiation dose reduction in computed tomography: Techniques and future perspective. Imaging Medicine, 1, 65-84. doi:10.2217/iim.09.5
- Chung, S.J. (2009) Seeking a new world: A new philosophy of Confucius and Kim Hang. iUniverse, Inc., Bloomington, 68-76, 153.
- Chung S.J. (2011) Computer program of nonlinear, curved regression for “probacent”-probability equation in biomedicine. Journal of Biomedical Science and Engineering, 4, 620-630. doi:10.4236/jbise.2011.49078 http://www.scirp.org/journal/Paperinformation.aspx?paperID=7676
- Dixon, W.J. and Massey Jr., F.S. (1957) Test for goodness-of-fit. Introduction to Statistical Analysis. McGrawHill, New York, 226-227.
- International Atomic Energy Agency (1995) Potential exposure in nuclear safety. INSAG-9. http://www.pub.lae.ORG/MTCD/Publications/PDF/Pub992e_web.pdf
- Laurier, D. (2000) Clusters of leukemia among young people living near nuclear site, with a focus on studies performed in the nordcotentin (France). http://ec.europa.eu/enery/nuclear/radiation_protection/doc/pulication/125-pdf
- Chung, S.J. (2010) The book of right change, JeongYeok: A new philosophy of Asia. iUniverse, Inc., Bloomington, 10.
- Hawking, S.W. (1988) A brief history of time. Bantam Books, New York, 31-32, 53-61.
- Suplee, C. (1999) Physics in the 20th century. Hany N. Abrams, Inc., New York, 82.
- Cui, Y., Yang, G., Fan, T., et al. (2002) Optimal protocol for total body irradiation for allogeneic bone marrow transplantation in mice. Bone Marrow Transplantation, 30, 843-849. doi:10.1038/sj.bmt.1703766
APPENDIX
A general formula, Eq.1 representing the “probacent”- probability equation is assumed to be applicable to the published data on dose versus solid cancer risk after exposure to acute low dose ionizing radiation in humans on the basis of aforementioned findings [19,22,39].
Two sets of data on dose (D) and solid cancer mortality probability (Q) from the published data [19,20] are used to determine values of constants, A, B and γ in Eq.1.
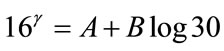
1) D = 30 mGy and Q = 0.05 %, P = 16 (“probacent” corresponding to mortality probability Q).
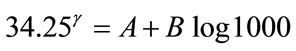
2) D = 1000 mGy and Q = 5.75 %, P = 34.25 (“probacent” corresponding to mortality probability Q).
 (A1)
(A1)
 (A2)
(A2)
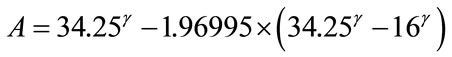
The values of constants, A and B are derived from Eqs.A1 and A2, as expressed by Eqs.A3 and A4, respectively.
 (A3)
(A3)
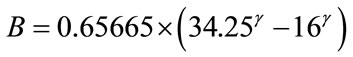 (A4)
(A4)
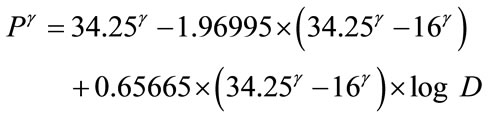 (A5)
(A5)
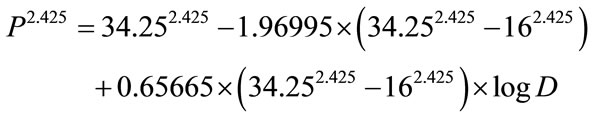
In order to determine the best fitting value of constant γ, the author employs the method of the least sum of squares described in the author’s previous publication [43]. A very close and best agreement is found between the computer-derived and reported solid cancer mortality probabilities with the γ value of 2.425. The formula, Eq. 2 is finally constructed as follows:
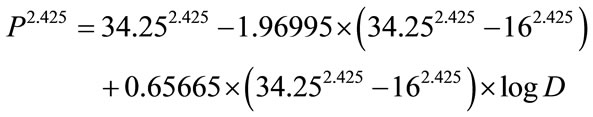 (2a)
(2a)
 (2b)
(2b)
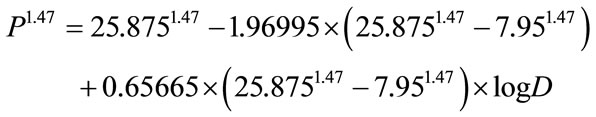
Eq.3 of leukemia formula is likewise constructed from two sets of data below described and use of the least sum of squares for curved regression:
1) D = 30 mGy and Q = 0.005%, P = 7.95 (“probacent” corresponding to mortality probability Q).
2) D = 1000 mGy and Q = 0.8%, P = 25.875 (“probacent” corresponding to mortality probability Q).