Journal of Biomedical Science and Engineering
Vol. 5 No. 1 (2012) , Article ID: 16934 , 10 pages DOI:10.4236/jbise.2012.51004
Molecular interactions between anticancer drugs and iodinated contrast media: An in vitro spectroscopic study
![]()
1Department of Radiology, Faculty of Medicine, Oita University, Yufu-shi, Japan
2Department of Applied Chemistry, Faculty of Engineering, Oita University, Oita-shi, Japan
Email: morihrmu@oita-u.ac.jp
Received 19 October 2011; revised 10 November 2011; accepted 30 November 2011
Keywords: Molecular Interactions; Anticancer Drugs; Iodinated Contrast Medium; Fourier Transform Infrared (FT-IR) Spectroscopy; Ultraviolet-Visible (UV-Vis) Spectroscopy
ABSTRACT
Purpose: The purpose of this study is to assess molecular interactions between several anticancer drugs and an iodinated contrast medium by Fourier transform infrared spectroscopy (FT-IR) and ultravioletvisible spectroscopy (UV-Vis). Materials and Methods: Iopamidol (IPM) was used as an iodinated contrast medium, and mitomycin C (MMC), epirubicin hydrochloride (EPI), cisplatin (CDDP), 5-fluorouracil (5FU), irinotecan hydrochloride (CPT11), gemcitabine hydrochloride (dFdC), carboplatin (CBDCA), oxaliplatin (1OHP), paclitaxel hydrochloride (TAX) and docetaxel trihydrate (TXT) were used as anticancer drugs. For FT-IR, the purified IPM was mixed stoichiometrically with each anticancer drug as well as with a combination of MMC and EPI. After measuring each separated sample and the mixtures, the spectra of the mixtures were compared with the spectra of the sum of pure samples or the combination. For UV-Vis, IPM and anticancer drugs were dissolved in pure water; subsequently for the titration experiments, the mixtures were prepared by varying the molar ratio. IR absorption corresponds to stretching vibrations between atoms having covalent bonding, whereas UV-Vis spectra depend on molecular dynamics and shapes. Both UV-Vis and IR spectra change when there are molecular interactions such as aromatic ring stacking and hydrogen bonding. Result: IPM exhibited molecular interactions with MMC, EPI, CDDP, dFdC, CBDCA, 1OHP, TAX and TXT, as well as with the combination of MMC and EPI on FT-IR. However, molecular interactions were not observed on UV-Vis. Conclusion: Several anticancer drugs have molecular interactions with IPM, which could be clinically utilized for superselective intraarterial infusion chemotherapy.
1. INTRODUCTION
Intraarterial anticancer chemotherapy (IAC) for the various kinds of malignant tumors which are not curatively resectable has been widely attempted for many years, and has been utilized for the treatment of head and neck cancer [1-12], breast cancer [13], hepatic and gall-bladder cancer [14-17], pancreatic cancer [18] and uterine cervical cancer [19-22]. IAC aims to obtain improved local control with systemic chemotherapy by increasing drug concentration at the tumor site [5,7,13]. Since current improvements in catheter design have enabled the selective catheterization into the main tumor feeders, superselective intraarterial infusion (SIAI) therapy has been reported as a kind of novel method among intraarterial anticancer chemotherapies. In this situation, iodinated contrast media are often mixed with anticancer agents in order to monitor the distribution of these anti-cancer drugs via fluoroscopy or computed tomography (CT). In other words, the distribution of the diluted contrast medium is believed to reflect that of the anticancer drugs; however there is no guarantee without proof of molecular interaction such as the formation of hydrogen bonds between them [13].
In order to analyze the molecular interactions, we employed the studies of Fourier transform infrared (FT-IR) spectroscopy and ultraviolet-visible (UV-Vis) spectroscopy to detect hydrogen bonding and aromatic stacking. Spectroscopy is a technique whereby a spectrum is obtained by utilizing a phenomenon wherein a sample irradiated with light absorbs specific photons. This spectrum is represented by a wavelength on the horizontal axis, while the vertical axis indicates the absorption intensity of each wavelength component.
FT-IR spectroscopy serves as an effective method for analyzing molecular structure. It utilizes the phenomenon of wave interference and the Fourier transform to process the resulting interferogram in order to obtain an infrared spectrum. Since molecules have characteristic vibrations that correspond to its structure, irradiating these molecules with infrared range light would yield a specific infrared spectrum based on the absorption of the vibrations. In this study, stretching vibrations (the increase or decrease in the distance between atoms) of functional groups with carboxyl (C=O), hydroxyl (O-H) and amino (N-H) bonds provide useful information on the formation of hydrogen bonds (Figure 1) [23-26].
UV-Vis spectroscopy is used to measure the absorption spectra of a sample irradiated with ultraviolet to visible light based on the electronic states of molecules. The spectra within the absorption wavelength region are exhibited by the molecules with unsaturated bonds including aromatic rings. A lack of interaction results in a spectrum with a single superposition, while an interacttions between molecules through the aromatic rings produce a spectrum different from that with the single superposition (Figure 2) [27,28].
These spectroscopy studies would show changes in the specific absorption bands or peaks of the spectra if there is a molecular interaction between the anticancer drugs and the iodinated contrast media. The purpose of the present study was to assess the molecular interactions between several anticancer drugs including mitomycin C (MMC), epirubicin hydrochloride (EPI), cisplatin (CDDP), 5-fluorouracil (5FU), irinotecan hydrochloride (CPT11), gemcitabine hydrochloride (dFdC), carboplatin
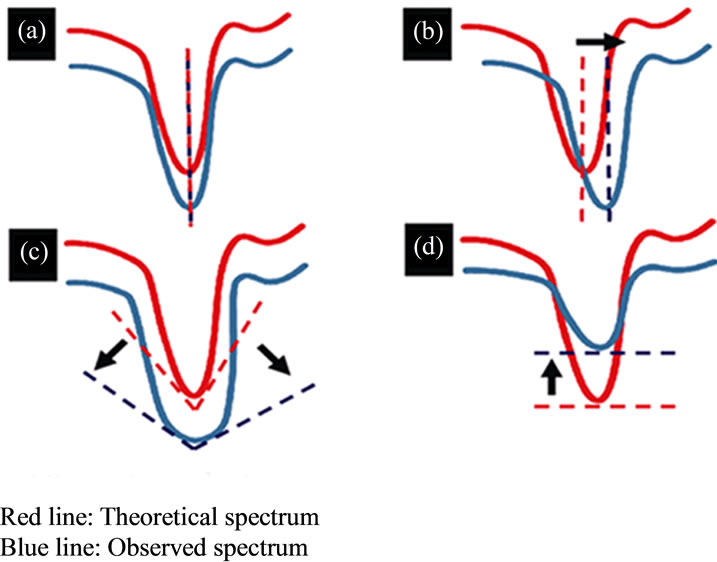
Figure 1. Principle of FT-IR spectra. (a) If there is no interacttion between molecules, the peaks of the theoretical spectrum and observed spectrum have the same wavenumbers. (b)-(d) If molecular interaction is present, the theoretical spectrum and the observed spectrum are different (arrow). Interaction between molecules is proven if (b) there is a change of 4 cm–1 or more in the wavenumbers of the peaks, (c) the absorption band appears broad, and/or (d) the intensity of the absorption band decreases.
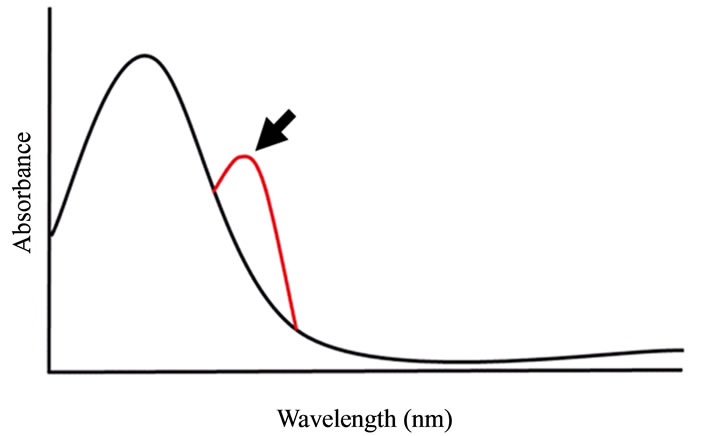
Figure 2. Principle of UV-Vis spectroscopy analysis. If molecular interaction is present, a change in the shape (arrow) of the variations in molar rate in the absorption spectra appears.
(CBDCA), oxaliplatin (1OHP), docetaxel trihydrate (TXT), and paclitaxel hydrochloride (TAX) and iopamidol (IPM) using FT-IR and UV-Vis spectra measurements and to determine whether we can assure the distribution of anticancer agents by using a mixture with iodinated contrast media.
2. MATERIALS AND METHODS
2.1. Materials
All samples were purchased as purified powder. The IPM (Wako Pure Chemical Industries, Japan) was chosen as the iodinated contrast medium and MMC (Wako Pure Chemical Industries, Japan), EPI (Wako Pure Chemical Industries, Japan), CDDP (Wako Pure Chemical Industries, Japan), 5FU (Wako Pure Chemical Industries, Japan), CPT11 (Yakult Honsha Co., Ltd., Tokyo, Japan), dFdC (Eli Lilly Company, Japan), CBDCA (Wako Pure Chemical Industries, Japan), 1OHP (Wako Pure Chemical Industries, Japan), TXT (Toronto Research Chemicals, North York, Ontario, Canada), and TAX (Wako Pure Chemical Industries, Japan) were used as the anticancer drugs.
2.2. Preparation of Samples
The samples were prepared using the purified powder of each anticancer drug, IPM powder and the mixture of both powders. For the FT-IR spectroscopy analysis, the mixtures of purified IPM and each anticancer drug, as well as a mixture of IPM, MMC and EPI were prepared with an equal molecular ratio. The samples were then dissolved in ethanol. A drop of the prepared solution was then placed on the surface of a KBr tablet and the solvent was allowed to evaporate overnight. For the UV-Vis spectra measurement, the IPM and the anticancer drugs were first dissolved in pure water. Subsequently for the titration experiments, the mixtures to be measured were prepared by varying the molar ratio of the anticancer drugs and the IPM (Tables 1 and 2). First, the anticancer drug, IPM, and the anticancer drug-IPM mixture were introduced into a spectroscopic quartz cell with an optical path.
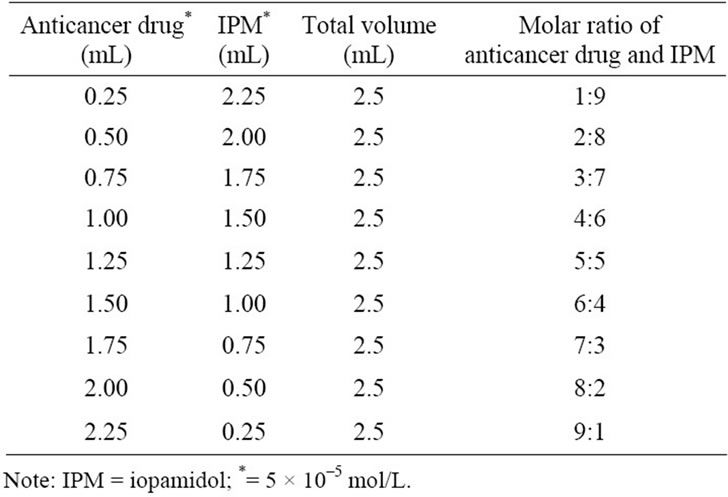
Table 1. UV-Vis spectroscopy measured, mixture composition of each anticancer drug and IPM.
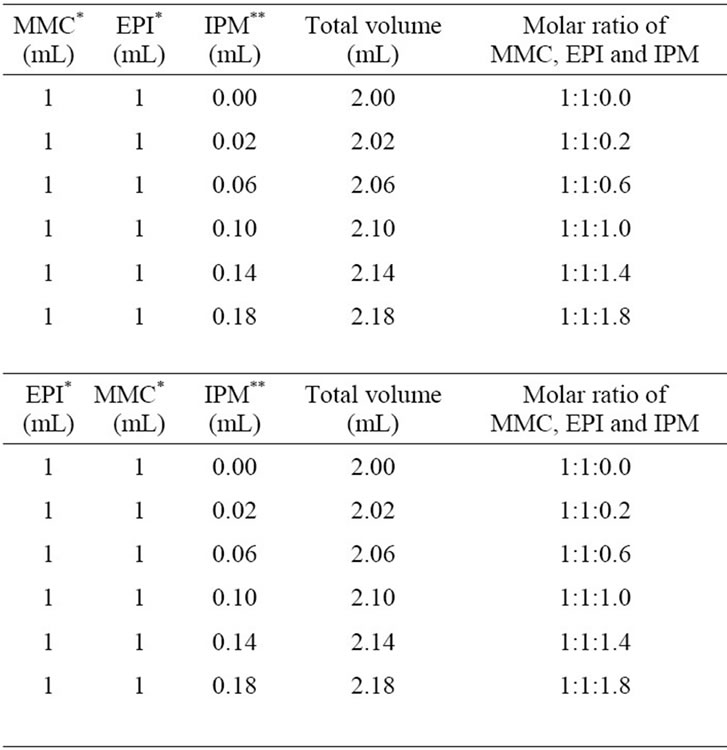
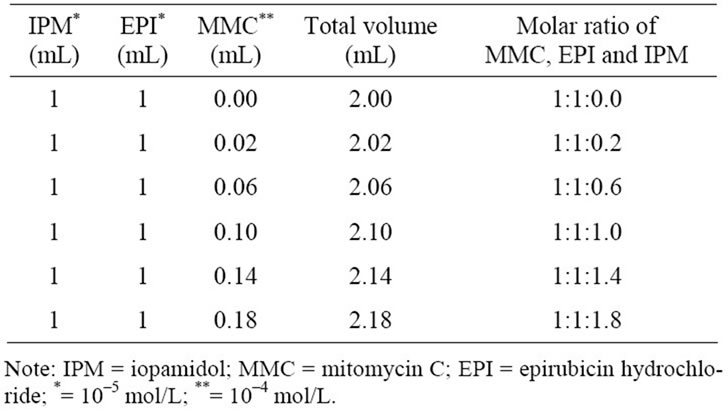
Table 2. UV-Vis spectroscopy measured mixture composition of anticancer drugs and IPM.
2.3. FT-IR Spectroscopy
The molecular interactions of anticancer drugs with IPM were analyzed using FT-IR spectroscopy. The analysis was performed in a few regions where wavenumbers (cm–1) of absorption bands or peaks corresponding to characteristic stretching vibrations related to group wavenumbers could be evaluated in detail. In the high wavenumbers region above 4000 - 3000 cm–1, stretching vibrations corresponding to the N-H and the O-H are present in the spectrum. Another spectral region at around 1700 cm–1 corresponds to the C=O.
FT-IR spectra were recorded on a FT/IR-4000 spectrometer (Jasco Corporation, Tokyo, Japan) at room temperature. Absorbance spectra were acquired at 4 cm–1 resolution and signal count at 16 scans. Spectra were truncated to span bands in the range 4000 cm–1 to 400 cm–1. Sample preparation and FT-IR scan was performed over 3 times for each combination.
The FT-IR spectra are most sensitive to hydrogen bonding interactions [23-26]. In this study, the observed spectrum was assessed by comparing it with theoretical waveform on the basis of combination of the mixture for two compounds is IPM and each anticancer drug.
A mixture of three compounds, the combination of MMC, EPI and IPM, was chosen. The observed spectrum was compared with following theoretical spectra:
1) Sums of the three compound spectra from IPM, MMC and EPI.
2) Sum of a binary mixture spectrum with one compound spectrum:
a) The spectrum of MMC-IPM mixture with the spectrum of EPI;
b) The spectrum of EPI-IPM mixture with the spectrum of MMC; and c) The spectrum of the mixture of MMC-EPI with the spectrum of IPM. These comparisons were performed because it is important to confirm how the three compounds interact.
Hydrogen bonding between the two molecules was affirmed when the following changes in the measured FT-IR spectra were observed.
1) Shifts in absorption band:
In the IR spectra, the peaks of both the observed spectrum and theoretical spectrum have the same wavenumbers if there are no interactions between molecules such as hydrogen bonding. However, hydrogen bonding is present if the peak positions of the observed spectrum showed a significant shift (4 cm–1 or more) to downward or upward wavenumbers from the theoretical spectrum (Figure 1(b)).
2) Absorption band broadening:
OH and NH groups in molecules formed through inter-molecular hydrogen bonds appear as a broad absorption band above 3000 cm–1, which represent changes in the stretching vibrations of O-H (Figure 1(c)).
3) Peak intensity:
The absorption band derived from stretching vibrations of O-H and N-H not influenced by hydrogen bonding is relatively sharp. The absorption band broadens when the molecules form hydrogen bonds, and the intensity of the absorption band increases or decreases (Figure 1(d)).
2.4. UV-Vis Spectroscopy
Aromatic compounds are characterized with a planar structure and a ring containing many electrons. If there is an aromatic compound, the absorption band appears above 200 nm in the spectrum (Figure 2). Electron-rich aromatic rings attract electron-poor aromatic rings thereby forming a molecular interaction that consequently brings a new stable state by complex [27,28]. For this study, UV-Vis spectroscopy was therefore utilized, since this is considered to be the most suitable method for detecting such interaction.
The steady-state measurements were performed using UV-Vis spectroscopy and recorded on a V-630 spectrophotometer (Jasco Corporation, Tokyo, Japan). Measurements of the anticancer drugs and IPM in pure water were carried out at room temperature using a deuterium lamp for ultraviolet and a halogen lamp for visible light. In the UV-Vis spectra, changes in the peak position and/or shape (linear spectrum) of the spectra appear if molecular interaction is present. Conversely, such changes are not manifest when there is no interaction between the aromatic rings (Figure 2).
3. RESULTS
3.1. Spectra by FT-IR Spectroscopy
3.1.1. MMC and IPM
The theoretical spectrum of MMC and IPM showed peaks at 3441 cm–1 and 1723 cm–1 corresponding to the stretching vibrations of N-H and C=O, respectively. The observed spectrum of MMC-IPM mixture revealed no significant changes in the stretching vibrations of other chemical functional groups except for NH and C=O, wherein the peak of N-H stretching vibrations at 3441 cm–1 had now disappeared and C=O changed to lower wavenumbers at 1709 cm–1 (Figure 3).
The sharp peak of 3441 cm–1 indicates that the MMC molecules are free of hydrogen bonds; however, this peaks disappears when IPM is added. It was observed that this phenomenon is the result of the added IPM forming hydrogen bonds with the NH of the MMC. The 1700 cm–1 level also had a change of position of the peak towards lower wavenumbers as a result of hydrogen bonds formed between the C=O. With the mixture of
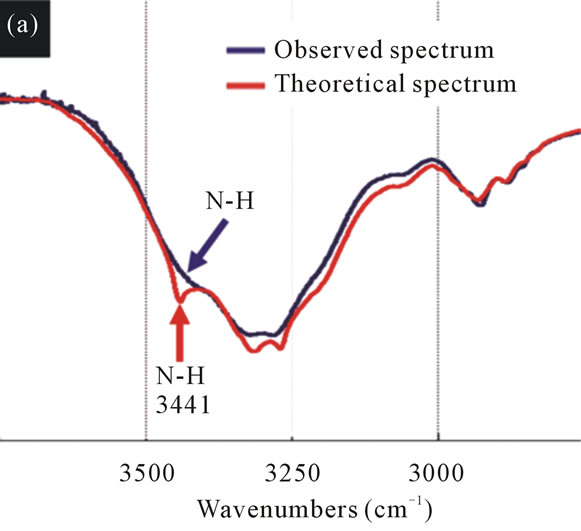
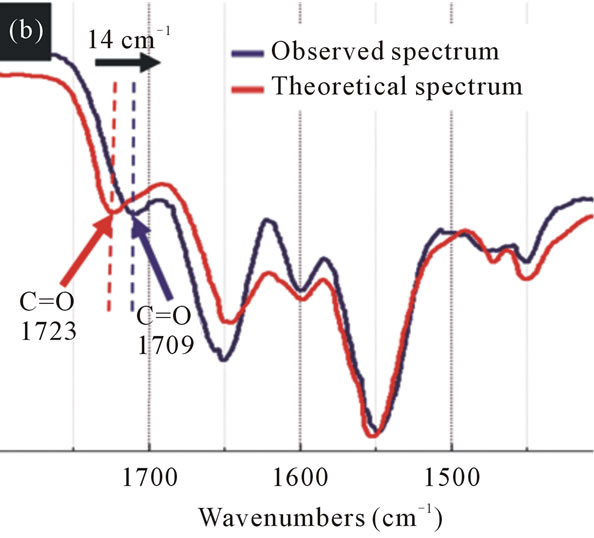
Figure 3. The FT-IR spectra of the theoretical spectrum and the observed spectrum of IPM interacting with MMC. (a) N-H stretching vibrations reflecting the theoretical spectrum of MMC and IPM. The sharp peak at 3441 cm–1 (red arrow) disappeared in the observed spectrum (blue arrow). (b) C=O stretching vibrations reflecting the spectra of MMCIPM. The peak position of C=O has changed by 14 cm–1 (black arrow) to lower wavenumbers after mixing with IPM.
MMC and IPM, molecular interaction was observed at the NH and C=O, forming a complex between the molecules.
3.1.2. EPI and IPM
For wavenumbers above 3000 cm–1, the spectra have a broad absorption band corresponding to the functional groups OH and NH. The theoretical spectrum have a peak of 3358 cm–1 while the observed spectrum showed a peak of 3324 cm–1, with deviation in the peak position of 34 cm–1. In addition, the intensity of the absorption band increases in the observed spectrum (Figure 4). This indicates that the same molecules are grouped together. After mixing the EPI and IPM result in an interaction between the EPI and IPM molecules through the forma-
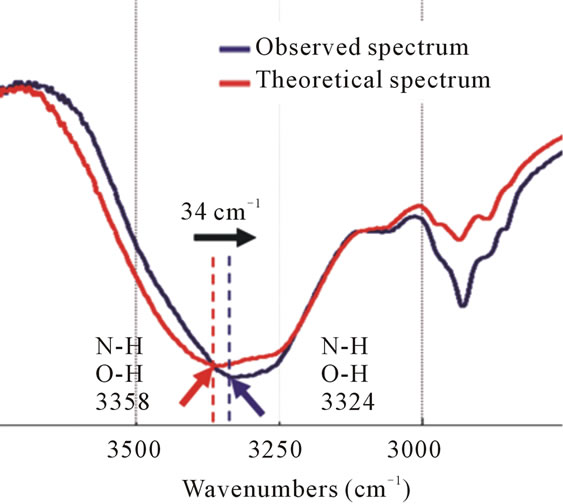
Figure 4. The FT-IR spectra of the theoretical spectrum and observed spectrum of IPM interacting with EPI. The N-H and O-H stretching vibrations have changed by 34 cm–1 (black arrow) to the lower wavenumbers after mixing EPI with IPM.
tion of hydrogen bonds. This molecular interaction is reflected in the spectrum as the position of the peak changes towards lower wavenumbers.
3.1.3. CDDP and IPM
Both theoretical and observed spectra show a broad absorption band of over 3000 cm–1, which correspond to the functional groups NH and OH. No major changes have been observed in these peaks, which are both around 3278 cm–1; however, the peak of the observed spectrum broadened towards higher wavenumbers (Figure 5). This means that while the same molecules are grouped together initially, mixing CDDP and IPM results not only in the interaction of the same molecules but also in the interaction of CDDP and IPM molecules.
These hydrogen bonds in NH and OH groups are involved in a weaker type of interaction.
3.1.4. dFdC and IPM
Both theoretical and observed spectra display broad an absorption band of over 3000 cm–1. The peak of the theoretical spectrum is located at 3280 cm–1 corresponding to the stretching vibrations of N-H and O-H interacting with the same molecules by the formation of hydrogen bonds, whereas that of the observed spectrum is observed at 3333 cm–1, which gives a higher deviation of 53 cm–1. Moreover, this absorption band broadened in the observed spectrum (Figure 6). Comparison with the theoretical spectrum reveals a difference in the position of the peak. This means that the dFdC and IPM mixture broke some hydrogen bonds between the same molecules and formed new interactions between different molecules. This molecular interaction produced changes in the stretching vibrations of N-H and O-H reflected as the
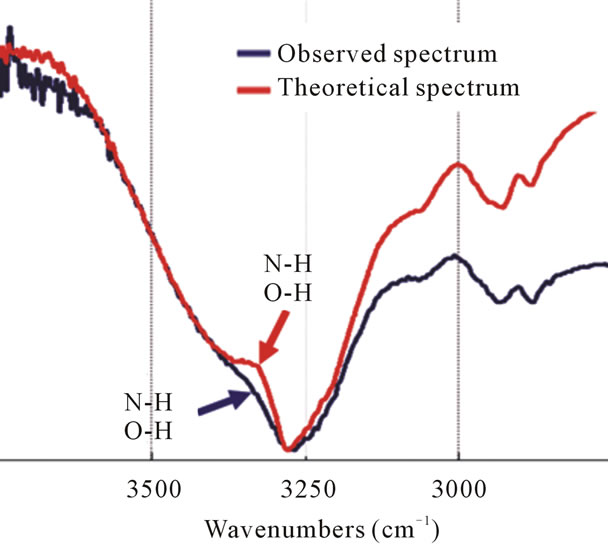
Figure 5. The FT-IR spectra of the theoretical spectrum and observed spectrum of IPM interacting with CDDP. The peak position corresponding to the N-H and O-H stretching vibrations has not changed, but it appears as a broad peak to higher wavenumbers after mixing CDDP with IPM (blue arrow).
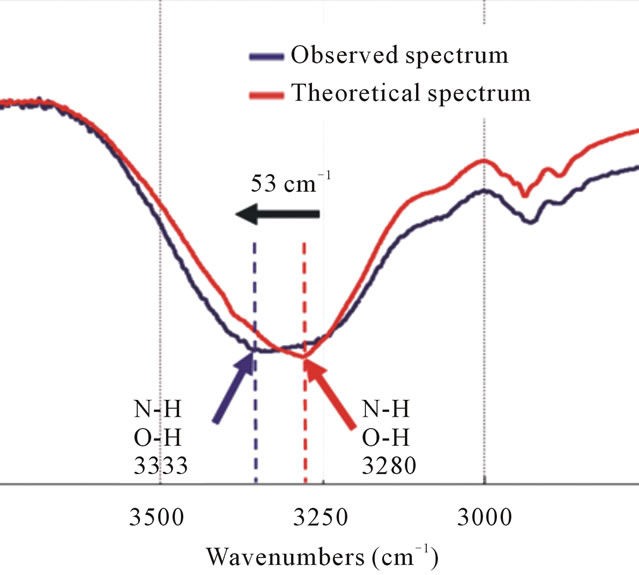
Figure 6. The FT-IR spectra of the theoretical spectrum and the observed spectrum of IPM interacting with dFdC. The N-H and O-H stretching vibrations have changed by 53 cm–1 to higher wavenumbers (black arrow) and broadened (blue line) after mixing dFdC with IPM.
corresponding peak changes to high wavenumbers in the theoretical spectrum.
3.1.5. CBDCA and IPM
The most interesting region is the sharp peak found at 3106 cm–1 from the theoretical spectrum corresponding to the N-H stretching vibrations which is the stretching vibrations of NH free from hydrogen bonds present in the molecule of CBDCA; however, this peak disappears in the observed spectrum. This disappearance of the peak when CBDCA is mixed with IPM means that the functional group NH in CBDCA formed hydrogen bonds with the IPM. This interaction between the molecules produced changes in the stretching vibrations of N-H resulting in the disappearance of the peak (Figure 7).
3.1.6. 1OHP and IPM
The spectra of 1OHP and IPM displays almost the same phenomenon as that of the mixture of CBDCA and IPM since the theoretical spectrum shows a peak of 3091 cm–1 which is the stretching vibrations of N-H with no hydrogen bonds while the peak of the mixture disappeared. This change is due to the formation of hydrogen bonds between molecules. At around 1700 cm–1, there are also changes in the peak position towards lower wave numbers, which indicate new hydrogen bonds are also created through the mixture of different molecules (Figure 8).
3.1.7. TAX and IPM
The peaks of the TAX and IPM were observed at 3426 cm–1 in the theoretical spectrum and 3368 cm–1 in the observed spectrum, although there are changes in the peak position of the TAX-IPM mixture to lower wavenumbers. In addition, the broadened absorption band can be attributed to the NH and OH. This means that the TAX and IPM mutually interact via the NH and OH, creating a complex through hydrogen bonds (Figure 9).
3.1.8. TXT and IPM
Spectral change for N-H and O-H stretching vibrations similar to that of the TAX-IPM mixture was observed. The broadened absorption band in the TXT-IPM mixture attributed to N-H and O-H stretching vibrations also dis-
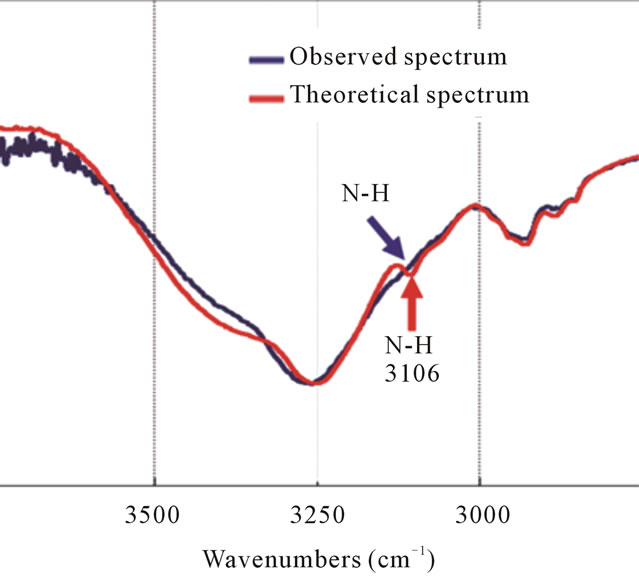
Figure 7. The FT-IR spectra of the theoretical spectrum and the observed spectrum of IPM interacting with CBDCA. The sharp peak at 3106 cm–1 (red arrow) corresponding to the N-H stretching vibrations has disappeared after mixing CBDCA with IPM (blue arrow).
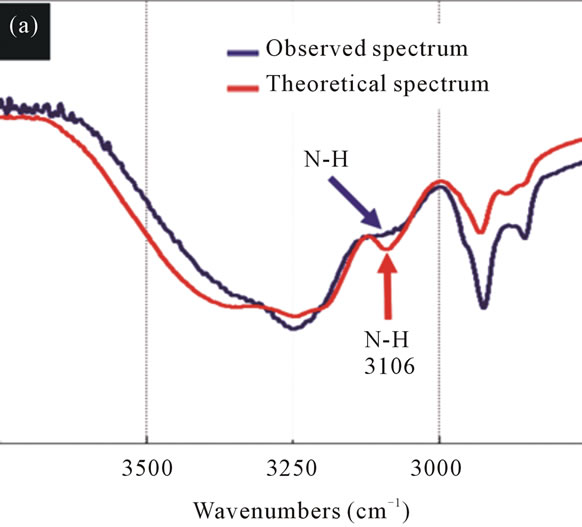
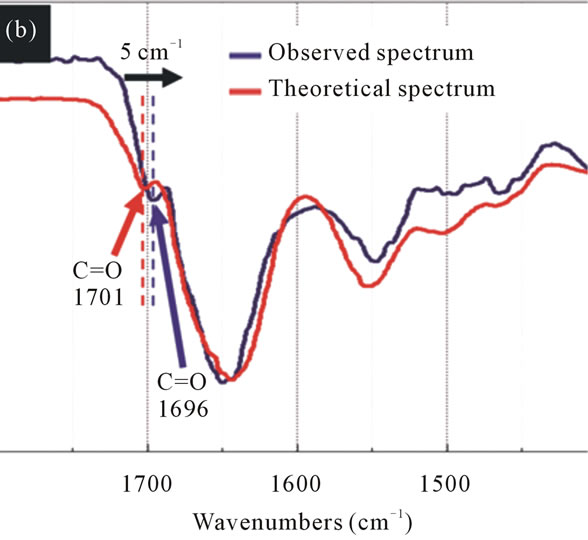
Figure 8. The FT-IR spectra of the theoretical spectrum and the observed spectrum of IPM interacting with 1OHP. (a) The sharp peak at 3106 cm–1 (red arrow) attributed to N-H stretching vibration has disappeared in the observed spectrum (blue arrow). (b) The C=O stretching vibration has changed to lower wavenumbers by 5 cm–1 (black arrow) after mixing 1OHP with IPM.
played a change of 60 cm–1 to lower wavenumbers. This is the result of the formation of hydrogen bonds between molecules (Figure 10).
3.1.9. Others Anticancer Drugs and IPM
With regard to 5FU and CPT11 when mixed with IPM with a molecular ratio of 1:1, no significant changes in the IR spectra were found. This indicates that there is no molecular interaction by hydrogen bonds at the level of NH, OH and C=O.
3.1.10. MMC, EPI and IPM
The mixtures of MMC, EPI and IPM produced interesting results. There are changes in the stretching vibrations of C=O with a change in position by 2 cm–1, 5 cm–1, 7 cm–1, and 9 cm–1 to lower wavenumbers corresponding to the sums of spectra of MMC-EPI mixture and IPM;
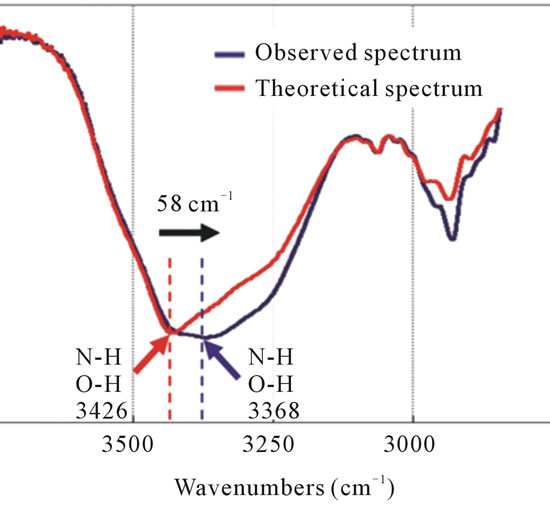
Figure 9. The FT-IR spectra of the theoretical spectrum and the observed spectrum of IPM interacting with TAX. The NH and OH peak has changed by 58 cm–1 toward lower wavenumbers (black arrow) and it becomes broad (blue line) after mixing TAX with IPM.
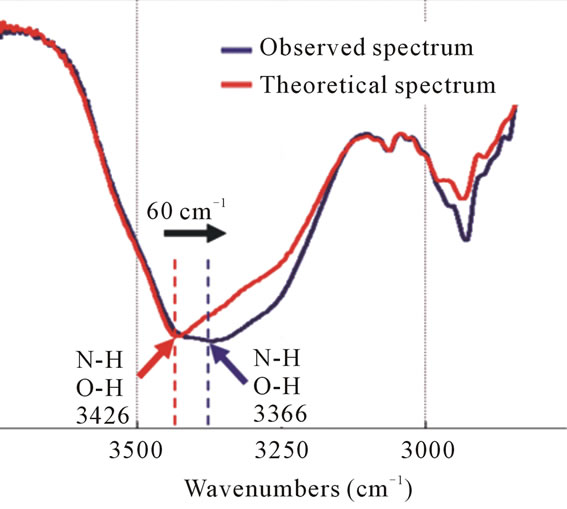
Figure 10. The FT-IR spectra of the theoretical spectrum and the observed spectrum of IPM interacting with TXT. The NH and OH peak has changed by 60 cm–1 toward lower wavenumbers (black arrow) and it becomes broad (blue line) in the observed spectrum.
MMC-IPM mixture and EPI; MMC, IPM and EPI and EPI-IPM mixture and MMC, respectively (Table 3). The change observed between the theoretical sum of the spectrum of MMC-EPI and IPM and the observed spectrum is very small, but a comparison with the other theoretical spectra showed significant changes to lower wavenumbers.
This analysis confirms that these three compounds display molecular interaction through hydrogen bonding. While both the theoretical sum of the spectra of MMC, EPI and IPM and the theoretical sum of the spectrum of the EPI-IPM mixture and MMC showed a sharp peak at 3440 cm–1 corresponding to the stretching vibrations of N-H, the other theoretical spectra and the observed spec-
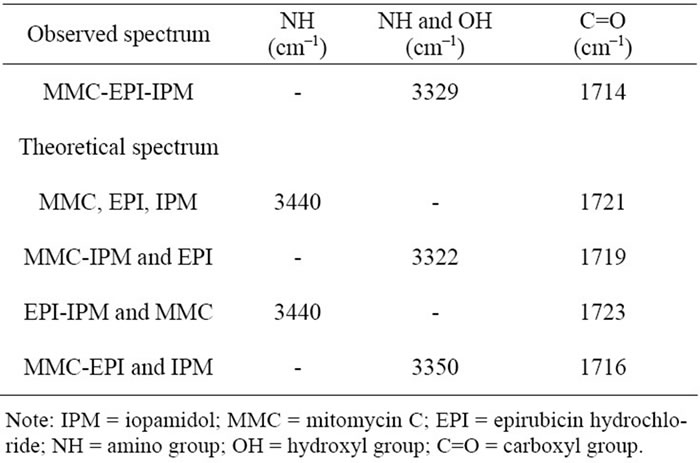
Table 3. Molecular interaction between MMC, EPI and IPM by FT-IR spectroscopy.
trum could not be determined accurately to analyze the peaks. In addition, the broadened absorption band corresponding to the N-H and O-H stretching vibrations changed as well when compared to the observed spectrum: the sum of the spectra of the MMC-IPM mixture and EPI changed by 7 cm–1 to high wavenumbers, while that of the MMC-EPI mixture and IPM changed by 21 cm–1 to lower wavenumbers. However, the peaks of the other theoretical spectra could not be clearly identified.
The NH and OH functional groups were not discussed, because in this region absorption bands were broad and it was difficult to determine the changes of peaks to sup port the analysis. In addition, by analyzing the spectra that were prepared by changing the order of the mixture of MMC, EPI and IPM, it turned out that all spectra were the same (Table 3).
3.2. Spectra by UV-Vis Spectroscopy
The UV-Vis spectra of the mixtures of the all anticancer drugs (MMC, EPI, CDDP, 5FU, CPT11, CBDCA, dFdC, 1OHP, TAX and TXT) and combination of MMC and EPI with IPM were observed, while changes in the equilibrated displacement of the spectra were not. Consequently, this confirms that there is no existence of molecular interaction between each anticancer drug and the contrast medium in an aqueous solution.
4. DISCUSSION
Hydrogen bonds are formed by interactions (N-H...O, O-H...N) among electronegative atoms (N, O), bonds between hydrogen atoms (N-H, O-H) and another electronegative atom (N, O). Therefore, the formation of hydrogen bonds between samples containing OH, NH and C=O groups changes C=O, O-H, N-H stretching vibrations, as observed in infrared spectral changes characterized in Figure 1 [ 23-26 ]. In our FT-IR spectroscopy study, changes observed between the theoretical spectrum and spectrum of the mixture means that there is an interaction between the molecules, which is the consequence of a change in the stretching vibration between N-H, O-H and C=O.
With the method used for the analysis of UV-Vis spectra, no considerable changes between anticancer drugs and IPM were observed. One possibility for this is that it is difficult for the substances to interact and form a stable complex through the stacking of aromatic rings in an aqueous solution with a diluted concentration. Another possibility could be that the formation of hydrogen bonds induces a conformational change of the molecules and consequently hinders the charge-transfer interaction between the aromatic rings. However, this does not mean that there was absolute no interaction between the aromatic rings.
As described above, molecular interactions between the anticancer drugs and IPM have been investigated in vitro, which is summarized in Table 4. These results revealed that IPM has an affinity with certain kinds of anticancer drugs wherein the hydrogen bonds are mainly acting forces, thus indicating that IPM can bind to the anticancer drugs to form a molecular complex in the mixture of these materials (Figure 11). The nature of affinity is probably due to the fact that IPM is rich in chemical functional groups such as NH, OH and C=O in its molecular structure. Given these results from our study, the early distribution or retention of the contrast medium on CT or fluoroscopy can approximately reflect the concentration of the anticancer drug after SIAI. To the best our knowledge, there is no report that determines the molecular interaction of anticancer drugs and iodinated contrast media using FT-IR and UV-Vis spectroscopy. These results can provide an important insight into the interactions within the mixture of iodinated contrast media and anticancer drugs.
There are several limitations in this study. The combination of the anticancer drugs and contrast medium was confined to IPM and ten anticancer drugs. Other contrast media and anticancer drugs might show different results which have yet to be studied The FT-IR measurement analyzes powder samples since the study of FT-IR cannot be analyzed in aqueous media; therefore, the result was obtained on solid state with the best possible way, although the situation is different with the human body. Moreover, several factors of both spectroscopies, including temperature, pH, molar rate and solvent materials, are considerably different between in vitro and in vivo. In addition, the actual effect of these interacttions on pharmacokinetics or pharmaceutical activities after distribution of the drugs still remains unclear. As the next step, analyses involving variation of the temperature, pH and molar rate may be necessary. An animal model would also contribute to the evaluation of the
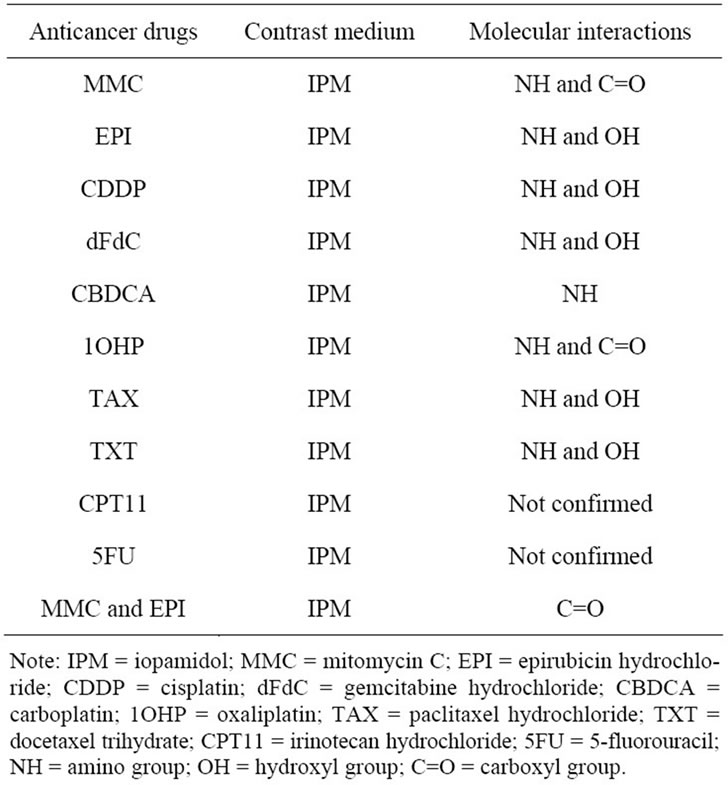
Table 4. The molecular interaction between anticancer drugs and IPM by using FT-IR spectroscopy.
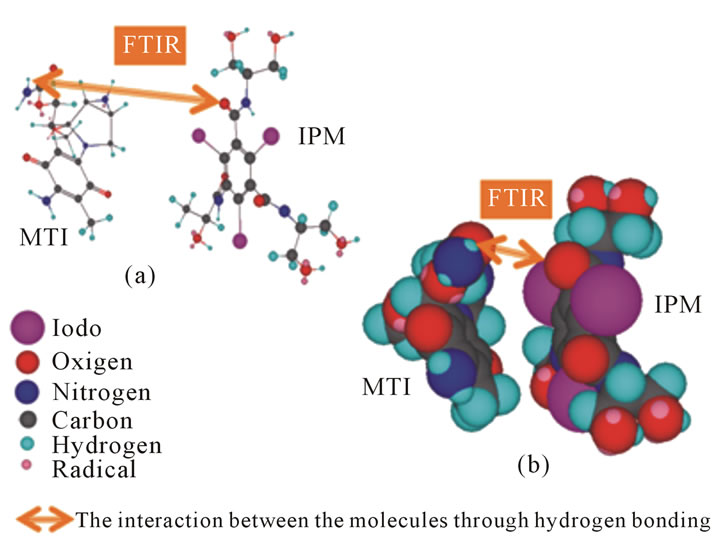
Figure 11. Ball and stick model (a) and space filling model (b). It shows the hydrogen-bonding based molecular interaction between MMC and IPM.
actual therapeutic effect of the IPM-anticancer drug complex.
5. CONCLUSION
In conclusion, the molecular interactions of IPM were observed in FT-IR spectra with MMC, EPI, CDDP, dFdC, CBDCA, 1OHP, TAX and TXT, as well as with the combination of the two anticancer drugs MMC and EPI. On the basis of these results, it is reasonable to assume that the mixture of IPM and anticancer drugs form a complex, and that the contrast medium distribution scanned by fluoroscopy or CT reflects the anticancer drug distribution when STAI chemotherapy is employed.
6. ACKNOWLEDGEMENTS
The authors gratefully acknowledge Christian C. Mercado for editing and proofreading this paper.
![]()
![]()
REFERENCES
- Qureshi, A.I., Suri, M.F., Khan, J., Sharma, M., Olson, K., Guterman, L.R. and Hopkins, L. (2001) Superselective intra-arterial carboplatin for treatment of intracranial neoplasms: Experience in 100 procedures. Journal of NeuroOncology, 51, 151-158. doi:10.1023/A:1010683128853
- Ishii, A., Korogi, Y., Nishimura, R., Kawanaka, K., Yamura, M., Ikushima, I., Hirai, T., Yamashita, Y. and Shinohara, M. (2004) Intraarterial infusion chemotherapy for head and neck cancers: Evaluation of tumor perfusion with intraarterial CT during carotid arteriography. Radiation Medicine, 22, 254-259.
- Imai, S., Kajihara, Y., Munemori, O., Kamei, T., Mori, T., Handa, T., Akisada, K. and Orita, Y. (1995) Superselective cisplatin (CDDP)-carboplatin (CBDCA) combined infusion for head and neck cancers. European Journal of Radiology, 21, 94-99. doi:10.1016/0720-048X(95)00692-J
- Iida, E., Okada, M., Mita, T., Furukawa, M., Ito, K. and Matsunaga, N. (2008) Superselective intra-arterial chemotherapy for advanced maxillary sinus cancer: An evaluation of arterial perfusion with computed tomographic arteriography and of tumor response. Journal of Computer Assisted Tomography, 32,397-402. doi:10.1097/RCT.0b013e3181151331
- Homma, A., Oridate, N., Suzuki, F., Taki, S., Asano, T., Yoshida, D., Onimaru, R., Nishioka, T., Shirato, H. and Fukuda, S. (2009) Superselective high-dose cisplatin infusion with concomitant radiotherapy in patients with advanced cancer of the nasal cavity and paranasal sinuses: A single institution experience. Cancer, 115, 4705-4714. doi:10.1002/cncr.24515
- Rohde, S., Kovács, A.F., Turowski, B., Yan, B., Zanella, F. and Berkefeld, J. (2005) Intra-arterial high-dose chemotherapy with cisplatin as part of a palliative treatment concept in oral cancer. American Journal of Neuroradiology, 26, 1804-1809.
- Korogi, Y., Hirai, T., Nishimura, R., Hamatake, S., Sakamoto, Y., Murakami, R., Baba, Y., Arakawa, A., Takahashi, M., Uji, Y. and Taen, A. (1995) Superselective intraarterial infusion of cisplatin for squamous cell carcinoma of the mouth: Preliminary clinical experience. American Journal of Roentgenology, 165, 1269-1272.
- Doweck, I., Robbins, K., Samant, S. and Vieira, F. (2008) Intra-arterial chemoradiation for T3-4 oral cavity cancer: Treatment outcomes in comparison to oropharyngeal and hypopharyngeal carcinoma. World Journal of Surgical Oncology, 6, 2. doi:10.1186/1477-7819-6-2
- Terayama, N., Sanada, J., Matsui, O., Kobayashi, S., Kawashima, H., Yamashiro, M., Takanaka, T., Kumano, T., Yoshizaki, T. and Furukawa, M. (2006) Feeding artery of laryngeal and hypopharyngeal cancers: Role of the superior thyroid artery in superselective intraarterial chemotherapy. Cardiovascular and Interventional Radiology, 29, 536-543. doi:10.1007/s00270-005-0094-0
- Mitsudo, K., Shigetomi, T., Fujimoto, Y., Nishiguchi, H., Yamamoto, N., Furue, H., Ueda, M., Itoh, Y., Fuwa, N. and Tohnai, I. (2011) Organ preservation with daily concurrent chemoradiotherapy using superselective intra-arterial infusion via a superficial temporal artery for t3 and t4 head and neck cancer. International Journal of Radiation Oncology Biology Physics, 79, 1428-1435. doi:10.1016/j.ijrobp.2010.01.011
- Kobayashi, W., Teh, B.G., Sakaki, H., Sato, H., Kimura, H., Kakehata, S. and Nagahata, M., (2010) Superselective intra-arterial chemoradiotherapy with docetaxel-nedaplatin for advanced oral cancer. Oral Oncology, 46, 860-863. doi:10.1016/j.oraloncology.2010.10.001
- Kanoto, M., Oda, A., Hosoya, T., Nemoto, K., Ishida, A., Nasu, T., Koike, S. and Aoyagi, M. (2010) Impact of superselective transarterial infusion therapy of high-dose cisplatin on maxillary cancer with orbital invasion. American Journal of Neuroradiology, 31, 1390-1394. doi:10.3174/ajnr.A2082
- Görich, J., Rilinger, N., Sokiranski, R., Vogel, J., Wikström, M., Krämer, S., Merkle, E., Rieber, A. and Brambs, H.J. (1996) CT-guided intraarterial chemotherapy in locally advanced tumors. Radiology, 199, 567-570.
- Kinami, Y. and Miyazaki, I. (1978) The superselective and the selective one shot methods for treating inoperable cancer of the liver. Cancer, 41, 1720-1727. doi:10.1002/1097-0142(197805)
- Ando, E., Tanaka, M., Yamashita, F., Kuromatsu, R., Yutani, S., Fukumori, K., Sumie, S., Yano, Y., Okuda, K. and Sata, M. (2002) Hepatic arterial infusion chemotherapy for advanced hepatocellular carcinoma with portal vein tumor thrombosis: Analysis of 48 cases. Cancer, 95, 588-595. doi:10.1002/cncr.10694
- Matsumoto, S., Kiyosue, H., Komatsu, E., Wakisaka, M., Tomonari, K., Hori, Y., Matsumoto, A. and Mori, H. (2004) Radiotherapy combined with transarterial infusion chemotherapy and concurrent infusion of a vasoconstrictor agent for nonresectable advanced hepatic hilar duct carcinoma. Cancer, 100, 2422-2429. doi:10.1002/cncr.20265
- Mäkelä, J., Kantola, R., Tikkakoski, T., Siniluoto, T., Leinonen, S., Kiviniemi, H., Laitinen, S. and Kairaluoma, M. (1997) Superselective intra-arterial chemotherapy with mitomycin C in hepatic metastases from colorectal cancer. Journal of Surgical Oncology, 65, 127-131. doi:10.1002/(SICI)1096-9098(199706)65:2<127::AID-JSO10>3.0.CO;2-2
- Tanaka, T., Sakaguchi, H., Anai, H., Yamamoto, K., Morimoto, K., Nishiofuku, H. and Kichikawa, K. (2004) Catheter position for adequate intra-arterial chemotherapy for advanced pancreatic cancer: Evaluation with CT during arterial injection of contrast material. Journal of Vascular and Interventional Radiology, 15, 1089-1097. doi:10.1097/01.RVI.0000131220.07444.7B
- Yamakawa, Y., Fujimura, M., Hidaka, T., Hori, S. and Saito, S. (2000) Neoadjuvant intraarterial infusion chemotherapy in patients with stage IB2-IIIB cervical cancer. Gynecologic Oncology, 77, 264-270. doi:10.1006/gyno.2000.5730
- Kobayashi, K., Furukawa, A., Takahashi, M. and Murata, K. (2003) Neoadjuvant intra-arterial chemotherapy for locally advanced uterine cervical cancer: Clinical efficacy and factors influencing response. CardioVascular and Interventional Radiology, 26, 234-241. doi:10.1007/s00270-003-0506-y
- Kokubo, M., Tsutsui, K., Nagata, Y., Okajima, K., Katakura, Y., Negoro, Y., Yamamoto, M. and Hiraoka, M. (1998) Radiotherapy combined with transcatheter arterial infusion chemotherapy for locally advanced cervical cancer. Acta Oncologica, 37, 143-149. doi:10.1080/028418698429694
- Sugiyama, T., Nishida, T., Hasuo, Y., Fujiyoshi, K. and Yakushiji, M. (1998) Neoadjuvant intraarterial chemotherapy followed by radical hysterectomy and/or radiotherapy for locally advanced cervical cancer. Gynecologic Oncology, 69, 130-136. doi:10.1006/gyno.1998.4976
- Steiner T. (2002) The hydrogen bond in the solid state. Angewandte Chemie International Edition, 41, 49-76. doi:10.1002/1521-3773(20020104)
- Kaushal, A.M., Chakraborti, A.K. and Bansal, A.K. (2008) FTIR studies on differential intermolecular association in crystalline and amorphous states of structurally related non-steroidal anti-inflammatory drugs. Molecular Pharmaceutics, 5, 937-945. doi:10.1021/mp800098d
- Gagoś, M., Menestrina, G., Niewiadomy, A. and Gruszecki, W.I. (2005) Molecular organization of the antifungal and anticancer drug 2-(2,4-dihydroxyphenylo)-5,6-dichlorobenzothiazole in solution and in monolayers: An effect of pH. Journal of Photochemistry and Photobiology B: Biology, 80, 101-106. doi:10.1016/j.jphotobiol.2005.03.004
- Selvaraj, V. and Alagar, M. (2007) Analytical detection and biological assay of antileukemic drug 5-fluorouracil using gold nanoparticles as probe. International Journal of Pharmaceutics, 337, 275-281. doi:10.1016/j.ijpharm.2006.12.027
- Sanders, J.K.M. and Hunter, C.A. (1990) The nature of π-π intreactions. Journal of the American Chemical Society, 112, 5525-5534. doi:10.1021/ja00170a016
- Hemley, R., Kohler, B.E. and Siviski, P. (1979) Absorption spectra for the complexes formed from vitamin-A and beta-lactoglobulin. Biophysical Journal, 28, 447-455. doi:10.1016/S0006-3495(79)85192-9