Journal of Cancer Therapy
Vol.5 No.10(2014), Article
ID:49471,17
pages
DOI:10.4236/jct.2014.510099
The Effect of Antineoplastons A10 and AS2-1 and Metabolites of Sodium Phenylbutyrate on Gene Expression in Glioblastoma Multiforme
Stanislaw R. Burzynski, Sonali S. Patil
Department of Cell and Molecular Biology, Burzynski Research Institute Inc., Stafford, TX, USA
Email: spatil@burzynskiresearch.com
Copyright © 2014 by authors and Scientific Research Publishing Inc.
This work is licensed under the Creative Commons Attribution International License (CC BY).
http://creativecommons.org/licenses/by/4.0/


Received 11 July 2014; revised 5 August 2014; accepted 1 September 2014
ABSTRACT
Antineoplastons are peptide and amino acid derivatives that occur naturally in the human body. They inhibit the growth of neoplastic cells without growth inhibition of normal cells. Phenylacetylglutaminate (PG) is an active ingredient of antineoplastons A10 and AS2-1 (ANP) and is also a metabolic by-product of phenylbutyrate (PB). The formulation of antineoplaston AS2-1 is a 4:1 mixture of phenylacetate (PN) and PG. Antineoplaston A10 is a 4:1 mixture of PG and isoPG. This study investigates the molecular mechanism of action of PG and PN. The Human U87 glioblastoma (GBM) cell line was used as the model system in this study. A total human gene array screen using the Affymetrix Human Genome plus 2.0 oligonucleotide arrays was performed using mRNA derived from U87 cells exposed to PG and PN. Pathway analysis was performed to allow the visualization of effect on metabolic pathways and gene interaction networks. Our preliminary results indicate that PG and PN interrupt signal transduction in RAS/MAPK/ERK and PI3K/AKT/PTEN pathways, interfere with cell cycle, decrease metabolism and promote apoptosis in human U87 GBM cells. The effect on multiple cellular pathways and targets, suggests that ANP and PB are promising candidates for clinical studies in GBM.
Keywords:Glioblastoma, Antineoplastons, Phenylbutyrate, Gene Expression, Pathways, Cell Cycle

1. Introduction
Research on antineoplastons began in 1967 after isolation of previously-unknown peptide fractions from blood of healthy individuals [1] [2] . Chromatographic and electrophoretic techniques led to the isolation of 119 peptide and amino acid derivative fractions present in blood and urine [3] . Prior to final purification these fractions were screened in various biological systems to establish their significance [4] [5] . We have previously found that the initial fractions detected were deficient in the serum of patients with advanced cancer [1] . It was hypothesized that deficient serum fractions could possess anticancer activity. This was confirmed by further research and active fractions were named antineoplastons (ANP) [5] [6] . In 1976, a mechanism of action for antineoplastons was proposed, which evolved from the theory of autonomous cybernetic systems (ACS) and studies of peptides and amino acid derivatives in blood and urine [6] [7] . The basis of this theory was a comparison of a cell to ACS [7] . Two of the pathways, information and energy, enter ACS through different types of channels: receptor for information and feeder for energy. Both pathways lead to elements that transform and store energy (accumulator) or information (correlator). The homeostat connects the accumulator and correlator and influences them both. These pathways leave ACS through an effector, which generates a specific reaction [7] . Standard cancer treatment, such as surgery, radiation therapy (RT), and chemotherapy involve large amounts of energy and a small amount of information. The final results of standard therapies are limited due to poor specificity and efficacy and significant toxicity [8] . It was proposed that future cancer treatment should provide a large amount of information and preferably a small amount of energy [7] . Treatment should be based on information processing in cancer cells and affect not only multiple genomic targets, but also signaling pathways [8] [9] . Such treatment will “turn on” tumor suppressor genes and “turn off” oncogenes [10] . According to our theory, the body has a system of “biochemical switches” consisting of peptides, amino acid derivatives, and carboxylic acids (ANP), which decrease the activity of oncogenes and increase the activity of tumor suppressor genes [6] . Cancer patients have a deficiency of ANP and the introduction of these compounds as anticancer drugs may control cancer growth. Purification of one of the ANP fractions, A2, isolated from urine led to the identification of 3-phenylacetylamino-2, 6-piperidineodione. The compound has been synthetically reproduced and subjected for preclinical and phase I studies [7] [8] . In the small intestine it is metabolized to phenylacetylglutaminate (PG), phenylacetylisoglutaminate (isoPG), and phenylacetate (PN) which were reproduced synthetically and formulated into ANP A10 injections (PG:isoPG, 4:1) and ANP AS2-1 (PN:PG, 4:1) [7] [8] .
Glioblastoma multiforme (GBM), the most common highly malignant brain tumor, has an average annual incidence in the US of over 50,000 [11] . The clinical presentation of GBM is variable and depends on the location of the tumor in the brain, the dynamics of growth and associated mass-effect and edema. None of the symptoms are specific for GBM, but the most common are headache, seizure activity, personality change, focal weakness, nausea and vomiting, speech abnormalities, decreased consciousness, and sensory and visual deficits. The most common neurological signs are hemiparesis and cranial nerve paralysis, papilledema, confusion, depressed sensory perception, hemianesthesia, hemianopsia, and dysphasia. A very important feature of the clinical presentation is progression of the symptoms and signs leading to poor performance and death [12] [13] . Currently available evidence indicates that GBM cells of origin are precursors of glial cells. Numerous studies suggest that GBM develops as a result of changes such as epigenetic abnormalities, mutations, amplifications or deletions, and translocations that interfere with signaling pathways and produce neoplastic phenotype [9] . The Cancer Genome Atlas (TCGA) identified crucial genomic abnormalities in GBM [14] . This led to identification of biological subgroups of GBM and prognostic gene signatures [15] [16] . The highly complex and continuously evolving genomic structure of GBM suggests that a multitargeted approach could be applied to the treatment of this tumor and further suggests that the design of GBM clinical trials be introduced on the basis of biomarker analysis [9] [17] [18] . The identification of genomic targets and signaling pathways became a necessity in the rational design of the new clinical studies in brain tumors.
ANP A10 and AS2-1 successfully completed the program of phase I and phase II clinical studies and are now entering phase III trials [19] -[24] . Sodium phenylbutyrate (PB) was initially introduced for the treatment of episodic hyperammonemia in children with inborn errors of urea synthesis [25] . Additional studies revealed that PB is a histone deacetylase inhibitor (HDAC) and led to its investigation in numerous disorders, including cancer [26] . As explained above, PG and PN are two main ingredients of ANP [8] . Eighty percent of PB is metabolized to PG in the human body. Initially, PB is broken down to PN in the liver, which is then conjugated with L-glutamine forming PG. Since there is a gradual conversion of PB into PG, the three compounds (PG, PN, and PB) exert simultaneous biological activity in the body of the patient who is treated with PB. The Burzynski Research Institute (BRI) conducted several studies that focused on the elucidation of molecular mechanisms of action of PG and PN. Due to the importance of identifying a possible new treatment for GBM, it was decided to study the effect of PG and PN on the genome of the human GBM cell line U87. Some of these results were previously presented and published [27] [28] . In vivo experiments in animal models of different types of cancer have been performed and published, but such studies of GBM are planned in the future. This paper provides new data and summarizes findings that were previously published.
2. Materials and Methods
2.1. Preparation of Compounds for Treatment in Cell Culture Medium
PG and PN were synthesized as sodium salts at BRI. Stock solutions of these compounds were made in sodium-free MEM (Gibco). In order to maintain the salt concentration in the medium at physiological levels, the salt from the compounds was taken into account during media formulation.
2.2. Cell Culture
All human malignant cell lines were purchased from American Tissue Culture Collection (Rockville, MD). Cells were not used for more than 9 passages (3 months) post-resuscitation (Cell Line Verification Test Recommendations, ATCC Technical Bulletin No. 8 (2008)) U87 ATCC-HTB-14. For all the experiments, U87 cells were maintained in complete modified Eagle’s medium (CMEM) (Gibco) at 37˚C, >90% humidity, 5% CO2 (AirGas, Houston), for 3 days to allow cells to enter exponential growth phase. U87 cells were then treated with trypsin (Sigma) and re-plated at a density of 3000 cells/well in 96 well plates or 5000/cm2 in flasks based on each experiment for 3 days. After this period the culture medium was replaced with CMEM containing 50 mM PG, 10 mM PN or a combination of 50 mMPG + 10 mM PN. These concentrations were used in all the experiments.
2.3. Gene Array Study
U87 cells were treated as before for 3 days with PG, PN or the combination. Total RNA was isolated from the cells in Trizol (Ambion) using standard protocols followed by RNeasy cleanup step (Qiagen). Biotin-labeled cRNA was synthesized from total RNA using standard procedures and was hybridized to the Affymetrix Human Genome U133 plus 2.0 arrays. An on-column DNase treatment was included in the isolation procedure. RNA was checked for quality using a nanodrop spectrophotometer (260/280 ratios greater than 1.9) and on an Agilent bioanalyzer 2100 (28S/18S close to 2). The total RNA (2 μg) was first converted to single stranded cDNA using Superscript II reverse transcriptase and the GeneChip T7 promoter primer kit (Affymetrix). The single stranded cDNA was then converted to double stranded cDNA using DNA polymerase I, DNA ligase and RNaseH from E. coli. The double stranded cDNA was purified using a cleanup kit from Affymetrix and converted to cRNA by in vitro transcription using biotinylated ribonucleotides and T7 polymerase (Affymetrix 1-cycle labeling kit). The labeled cRNA was subsequently purified and fragmented by metal induced hydrolysis to yield 35 - 200 base fragments that can be hybridized to the Affymetrix Human Genome plus 2.0 oligonucleotide arrays. After hybridization, the chip was washed, stained with streptavidin-phycoerythrin (SAPE) before being scanned. An antibody amplification staining protocol that used biotinylated goat IgG followed by a second SAPE staining increased the sensitivity of the assay. The chip was then scanned and images analyzed using Affymetrix GCOS software. Further quantitative data analysis to identify changes in gene expression patterns was done using Gene Spring v7.3 (Agilent).
2.4. Data Analysis
The CEL files were normalized to median using the MAS5 algorithm followed by filtering to obtain gene lists with good signal-to-noise ratios using the Genespring Cross Gene error model for replicates. This gene list was further filtered to include only those that were consistently “present” or “absent” in all triplicate for each condition. This gene list was subjected to a one way ANOVA (p < 0.05) based on treatment condition followed by a filtering on fold change based on at least 2 fold differential expressions between compared conditions. A Benjamini Hochberg false discovery correction was also included in the analysis to improve the confidence in the data.
2.5. Quantitative PCR
Selected genes from the gene array study were listed for quantitative PCR to confirm the changes in gene expression using an independent method. Chemistry: Taqman, Assay Type: relative quantification ΔΔCt method. Internal control: β-Actin, Template: 1st strand cDNA, equivalent of 20 ng total RNA/well. The +/− values were obtained by calculating the relative expression for the value obtained by adding the ΔΔCt and ΔCt standard deviation (RE+/−), and then subtracting the RE+/− value from the RE. For each gene, expression of the CON sample is normalized to 1.0.
2.6. Polo-Like Kinase Assay
U87 cells were collected post treatment as described above by trypsinization and lysed in Sigma lysis buffer. Kinase activity was determined by using the Polo-like Kinase Assay Kit (Cyclex Research Products). Plates were pre-coated with a substrate which contains residues that can be phosphorylated by PLK1. The detection antibody only detects the phosphorylated form of threonine residues on the substrate.
2.7. Lactic Acid and pH Measurement
U87 cells were treated with ANP as above. Media was collected after 24 hours for pH measurement and lactate measurement using the lactate assay kit (Eton Bioscience).
3. Results
3.1. RAS/MAPK/ERK Signaling Pathways
Next to phospoinositide 3 kinase (PI3K)/AKT/phosphastase and tensin homolog (PTEN), RAS/mitogen activated protein kinase (MAPK)/extracellular signal regulated kinase (ERK) is the most important signaling system for cell proliferation [29] . It receives signals from growth factors receptors and transmits them to cell nucleus.
RAS gene is frequently mutated in human cancers (in approximately 30% of all cancers). Mutated RAS is losing sensitivity to hydrolysis catalyzed by neurofibromin, the product of tumor suppressor gene NFI which results in increased signal transmission. The mutations are rare in gliomas, but increased activity of RASGTP was found in GBM and high grade astrocytomas [30] . It is generally accepted that the activation of RAS signaling in brain tumors is due to increased activity of growth factor receptors. From RAS the signal is conducted through RAF-MAP kinase (MEK) to MAPK (Figure 1). From MAPK the signal enters the nucleus where it triggers cell cycle progression from G1 to S phase and proliferation [29] . Alterations in BRAF occur in a wide variety of cancers including lung, colorectal, non-Hodgkin’s lymphoma, and malignant melanoma. The signal from BRAF is transduced to the family of MEK and MAPK kinases, and MAPK are inhibited by dual specificity protein
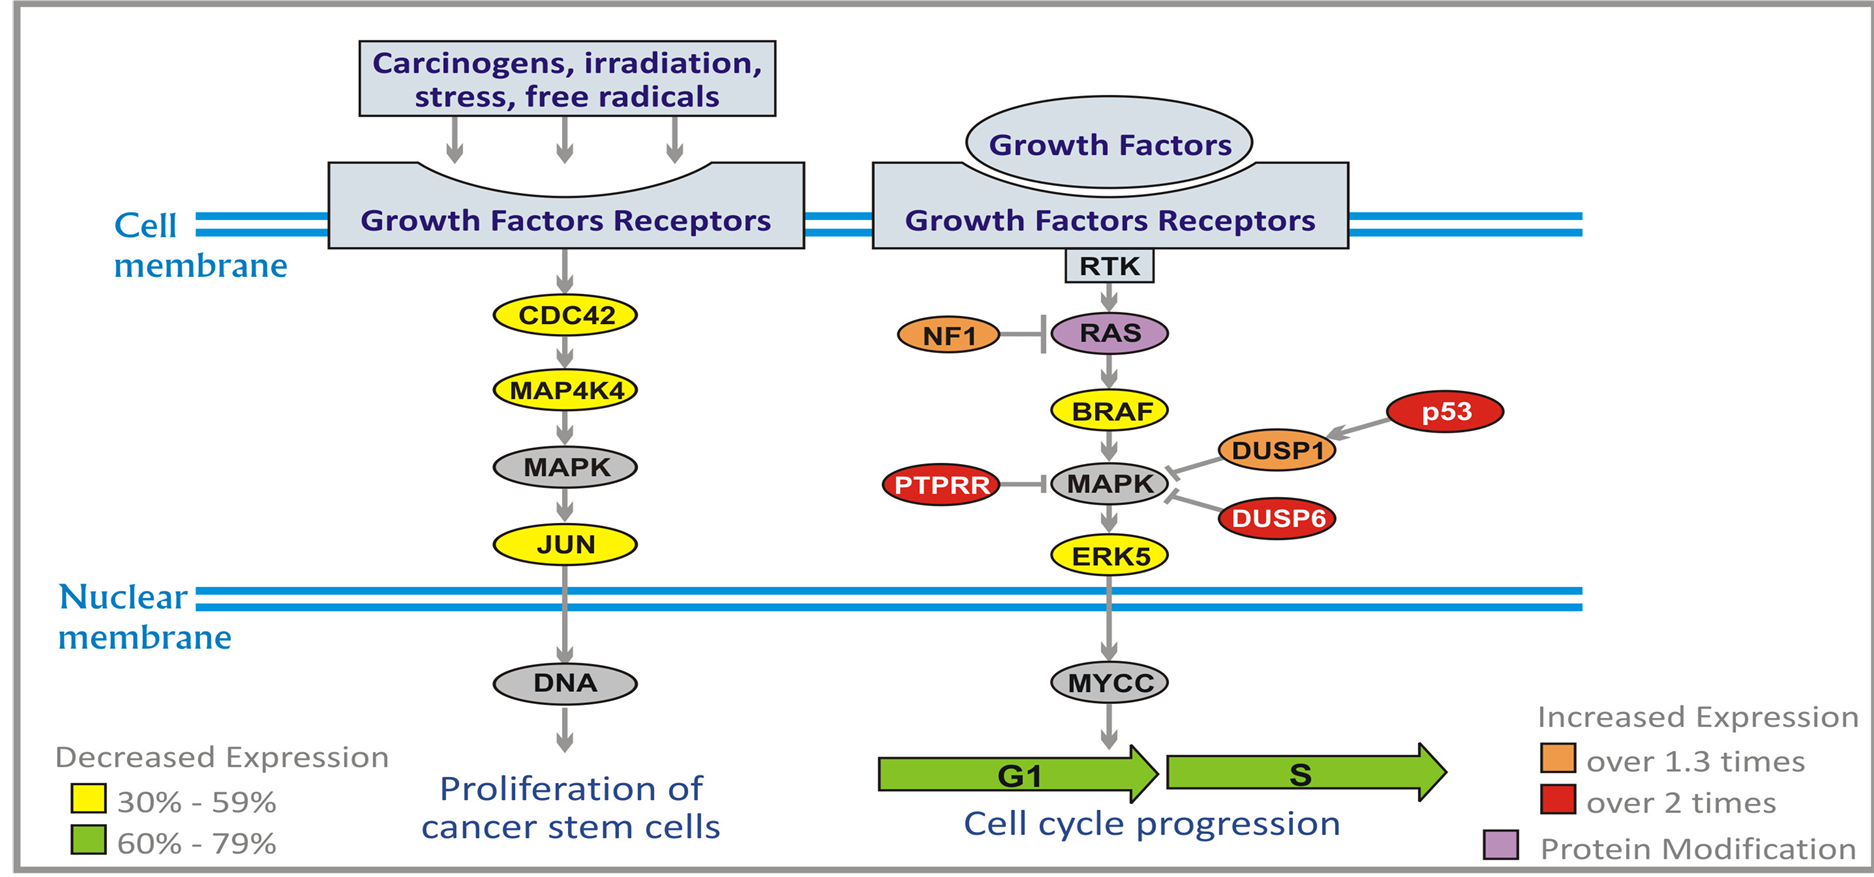
Figure 1. Effect of ANP treatment on gene expression of the RAS/MAPK/ERK pathways in U87 cells (abbreviations explained in text).
phosphatases (DUSP1 and DUSP6). The activity of DUSP1 is induced by protein p53. Another MAPK inhibitor receptor-type-tyrosine-protein phosphatase R (PTPRR) sequesters MAPK in the cytoplasm in an inactive form.
The additional signaling pathway leads to cell division cycle phosphatase (CDC42), MAP4K4, and MAPK. CDC42 is a plasma-membrane associated GTPase which cycles between inactive GTP-bound and inactive GDP-bound state. In an active state it binds to a variety of effector proteins and it activates MAP4K4 kinase (MEK kinase 4). MAP4K4 activates JUN oncogene through MAPK which leads to proliferation of malignant cells (Figure 1).
ERK5 pathway leads from epidermal growth factor receptor (EGFR) to ERK5 (MAPK7 kinase) and to the nucleus where it activates genes encoding transcription factors (Figure 1). As a result, there is stimulation of proliferation of neoplastic cells. PG and PN decrease expression of BRAF by 48%, and increase expression of DUSP1 (over 1.3 times), NF1 (over 1.7 times), DUSP6 and p53 (over 2.1 times), and PTPRR (over 2.7 times). PN inhibits farnesylation of RAS protein.
PG and PN down-regulate expression of CDC42, MAP4K4, JUN and ERK5 (30% - 59%) which leads to decrease of proliferation of neoplastic cells [31] . There are no currently available targeted therapy agents which down-regulate the JUN pathway [32] .
3.2. PI3K/AKT/PTEN Pathway
PI3K/AKT/PTEN pathway is of primary importance in pathogenesis of brain tumors [30] . The signal originates from activation of PI3K which can be accomplished by numerous growth factor receptors and RAS pathway (Figure 2). The most important include insulin-like growth factor receptor (IGF-1R), EGFR, platelet derived growth factor receptor (PDGFR) and vascular endothelial growth factor receptor (VEGFR) [33] . Second messengers generated by PI3K, phosphatidylinositols (PtdIns): PtdIns (4, 5) P2 (PIP2) and PtdIns (3, 4, 5) P3 (PIP3) recruit AKT (which is serine-threonine kinase) to the cell membrane. AKT family includes three members: AKT1, AKT2 and AKT3, which are phosphorylated by 3-phosphoinositide-dependent protein kinase-1 (PDK1)
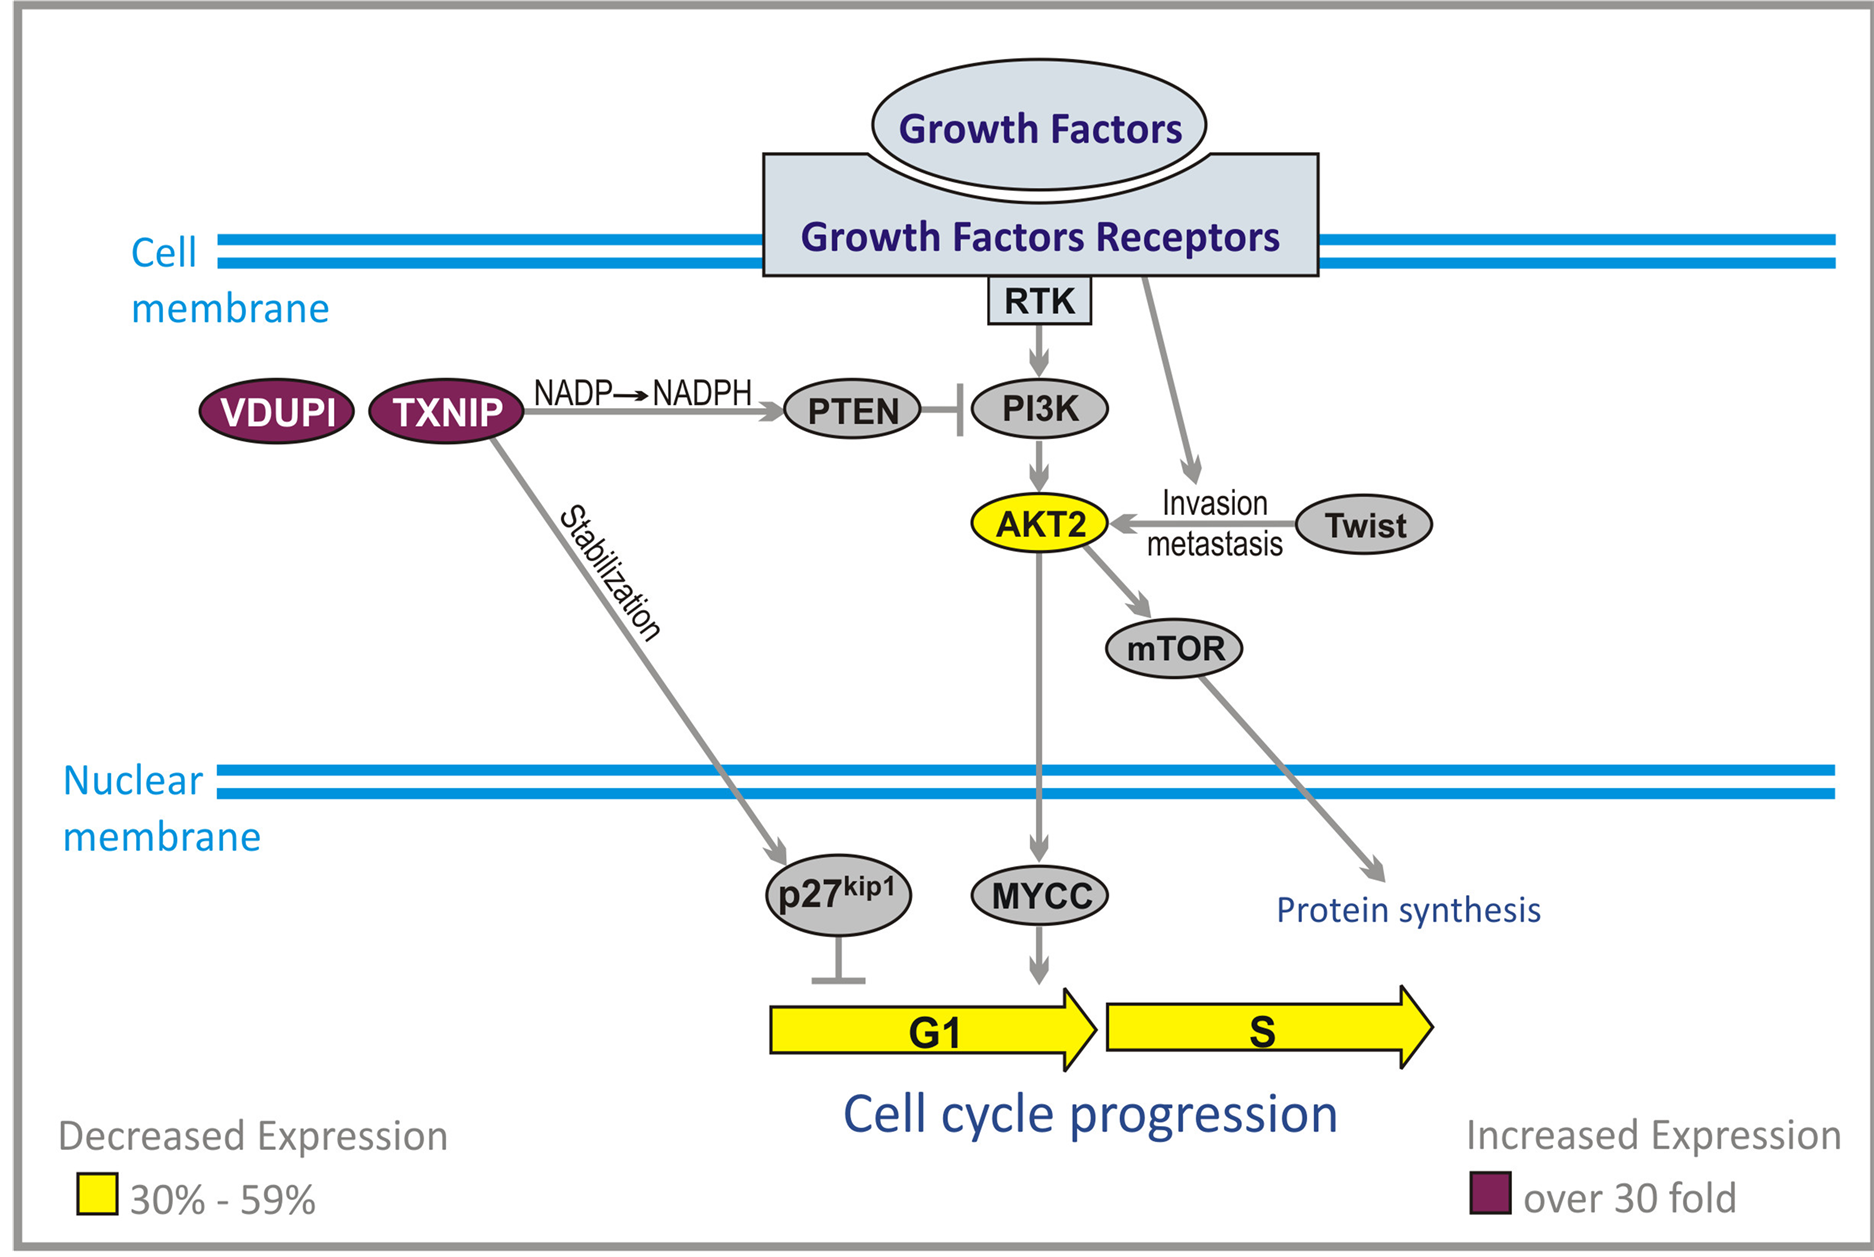
Figure 2. Effect of ANP treatment on gene expression of the PI3K/AKT pathways in U87 cells (abbreviations explained in text).
and PDK2. PIP3 is inactivated through conversion to PIP2 by phosphatase and tensine homolog (PTEN). This mechanism resembles inactivation of RASGTP by GTAase activating proteins (GAPs). AKT activates and inhibits numerous targets. Through activation of mammalian targets of rapamycin (mTOR) it promotes cell cycle progression, initiation of translation and survival. Inhibition of pro-apoptotic protein BAD (BAD) and forkhead box sub-group O (FOXO) factors, and activation of nuclear factor κB (NFκB) by AKT blocks apoptosis. This is also accomplished through increased activity of murine double minute 2 (MDM2), which inhibits p53 [34] . High grade gliomas show increased activity of PI3K/AKT pathway but amplification of AKT has not yet been described in human astrocytomas [35] . The main mechanism is inactivation of PTEN, which is deleted in the majority of high grade gliomas, and increased activity of EGFR, PDGFR and RAS signaling [30] . Increased activity of AKT is mediated in substantial degree by mTOR, especially when there is a loss of PTEN [36] . The impact of mTOR pathway is important in maintaining the transformed phenotype of cancer cells, but mTOR mutations, or overexpression, have not yet been reported in human cancers [36] . AKT2 is a transcriptional target of Twist protein and acts downstream of Twist to promote malignant cell invasion and metastasis. Twist gene encode a transcription factor which shows increased expression in the large majority of human glioma, and is specifically associated with the highest grade of tumor.
Thioredoxin-interacting protein (TXNIP) gene was originally identified as a vitamin D3 up-regulated protein (VDUPI) [37] [38] . Further research identified this gene as a tumor suppressor and metastasis suppressor. It was documented that its decreased expression is involved in pathogenesis of colorectal, gastric, liver, and breast cancers as well as ulcerative colitis. Over expression of TXNIP caused G1 cell cycle arrest in hepatocellular carcinoma cells. TXNIP was found to be a critical regulator of hepatic glucose production. TXNIP is also necessary to preserve the activity of tumor suppressor gene PTEN which plays a crucial part in most cancers, and inhibits AKT. The mechanism of action of TXNIP is quite complex and is mediated through NADPH (Figure 2). Crucial step in this mechanism is a preservation of NADPH by inhibition of thioredoxin catalyzed conversion to NADP.
Another important activity of TXNIP is increase of activity of p27kip1 which is a powerful inhibitor of G1/S cell cycle transition. Due to the action of TXNIP, p27kip1 is stabilized and retained in the nucleus where it exerts its inhibitory activity on cell cycle in malignant cells [28] .
PG and PN decrease expression of AKT2 gene by 55% and increase expression of TXNIP over 30 times [28] This was also confirmed by qPCR, Table1
3.3. Cell Cycle Genes
The cells in the human body developed a complex network of proteins and genes, which control cell cycle. In simple terms this is a system of biochemical switches that controls duplication of the cell genome, macromolecules, and organelles. S-phase of the cell cycle is necessary for duplication of DNA. Subsequently, cell division occurs in M-phase. These two crucial phases are separated by G1 phase between M-phase and S-phase and a G2 phase between S-phase and M-phase [35] . These two phases, G1 and G2 are necessary to permit cell growth. In normal cells S-phase occupies approximately half of the cell cycle (10 - 12 hours). M-phase requires less than 1 hour. For the cycle lasting 24 hours, phases G1, S and G2 together occupy 23 hours. Compared to cell cycle in normal cells where the process is strictly controlled for the benefit of the entire body, malignant cells escape such controls, and divide much faster than neighboring normal cells. They take advantage of them, which leads to short lasting prosperity culminating in the death of the entire organism.
The control of such excessive proliferation could lead to final elimination of cancer cells. PG and PN effect expression of the genes at the most important cell cycle checkpoint: G1/S, G2/M, and the spindle assembly (exit

Table 1 . Quantitative PCR for confirmation of selected genes from microarray.
RE = relative expression. The relative expression obtained by RT-qPCR agrees with the results obtained by microarray.
M) [28] . Among the most important proteins involved in the checkpoints are cyclin-dependent kinases (CDKs). CDKs are only active when they are bound to cyclins, and that is why they are named cyclin-dependent kinases. The concentrations of cyclins oscillate during the cell cycle.
They bind CDKs when they reach high levels and trigger cell cycle progression. The cyclins survive only for a short time and are destroyed by proteolysis catalyzed by ubiquitin ligases, which leads to decreased activity of CDK-cyclin complexes [39] . The activity of CDK/cyclin complexes can be increased by CDC25 group of phosphatases and decreased by CDK inhibitor proteins (CKI).
3.4. G1/S Checkpoint
During G1 phase, the cell produces numerous proteins necessary for cell growth and control of the cell cycle. In malignant cells, the synthesis of proteins, which are the products of tumor suppressor genes, for instance p21, is inhibited by a group of enzymes known as histone deacetylases (HDAC). These enzymes deacetylate lysine residues on the N-terminal part of the core histones and together with other proteins repress transcription. For the control of malignant cell growth, it is important that the genes responsible for biosynthesis of the products of tumor suppressor genes are not silenced. Inhibition of HDAC1 (60% - 79%) and HDAC5 (30% - 59%) by PN and PG activates silenced tumor suppressor genes, which slows down or stops cell cycle progression (Figure 3).
Throughout the cell cycle, origin recognition complex (ORC) proteins bind to replication origins to form a scaffold for additional cell cycle regulators. Two of these proteins, ORC1 and ORC6 bind to ARS consensus sequence of origins of replication, which depend on ATP. At early G1 cell division control protein 6 (CDC6) binds to ORC complex (mainly ORC1). Binding of CDC6 assures that DNA replication before mitosis is initiated. The attachment of CDC6 is necessary for binding another group of proteins, the minichromosome maintenance (MCM) proteins. CDC6 interacts with CDK2. The MCMs act as factors that allow the DNA to undergo a single round of replication per cell cycle. A large protein complex, which is formed this way, is named the pre-replicative complex (pre-RC). MCM2 and MCM3 are phosphorylated by cell division cycle 7-related protein kinase (CDC7). PG and PN reduce expression of genes coding for ORC1L (80% - 90%), CDC6, MCM2, MCM5 (60% - 79%), and CDK2, ORC6, MCM3, MCM4, MCM6, MCM7, and CDC7 (30% - 59%) (Figure 3).
Early G1is characterized by suppression of CDKs activity. Extracellular signals, for instance originating from the serine/threonine protein kinase B-raf (BRAF) and proliferating cell nuclear antigen (PCNA) activate biosynthesis of cyclin D3, which forms a complex with CDK4 [39] . This complex is inhibited by proteins which are products of TP53 and p21 tumor suppressor genes. Active complex cyclin D3/CDK4 triggers increased syn-
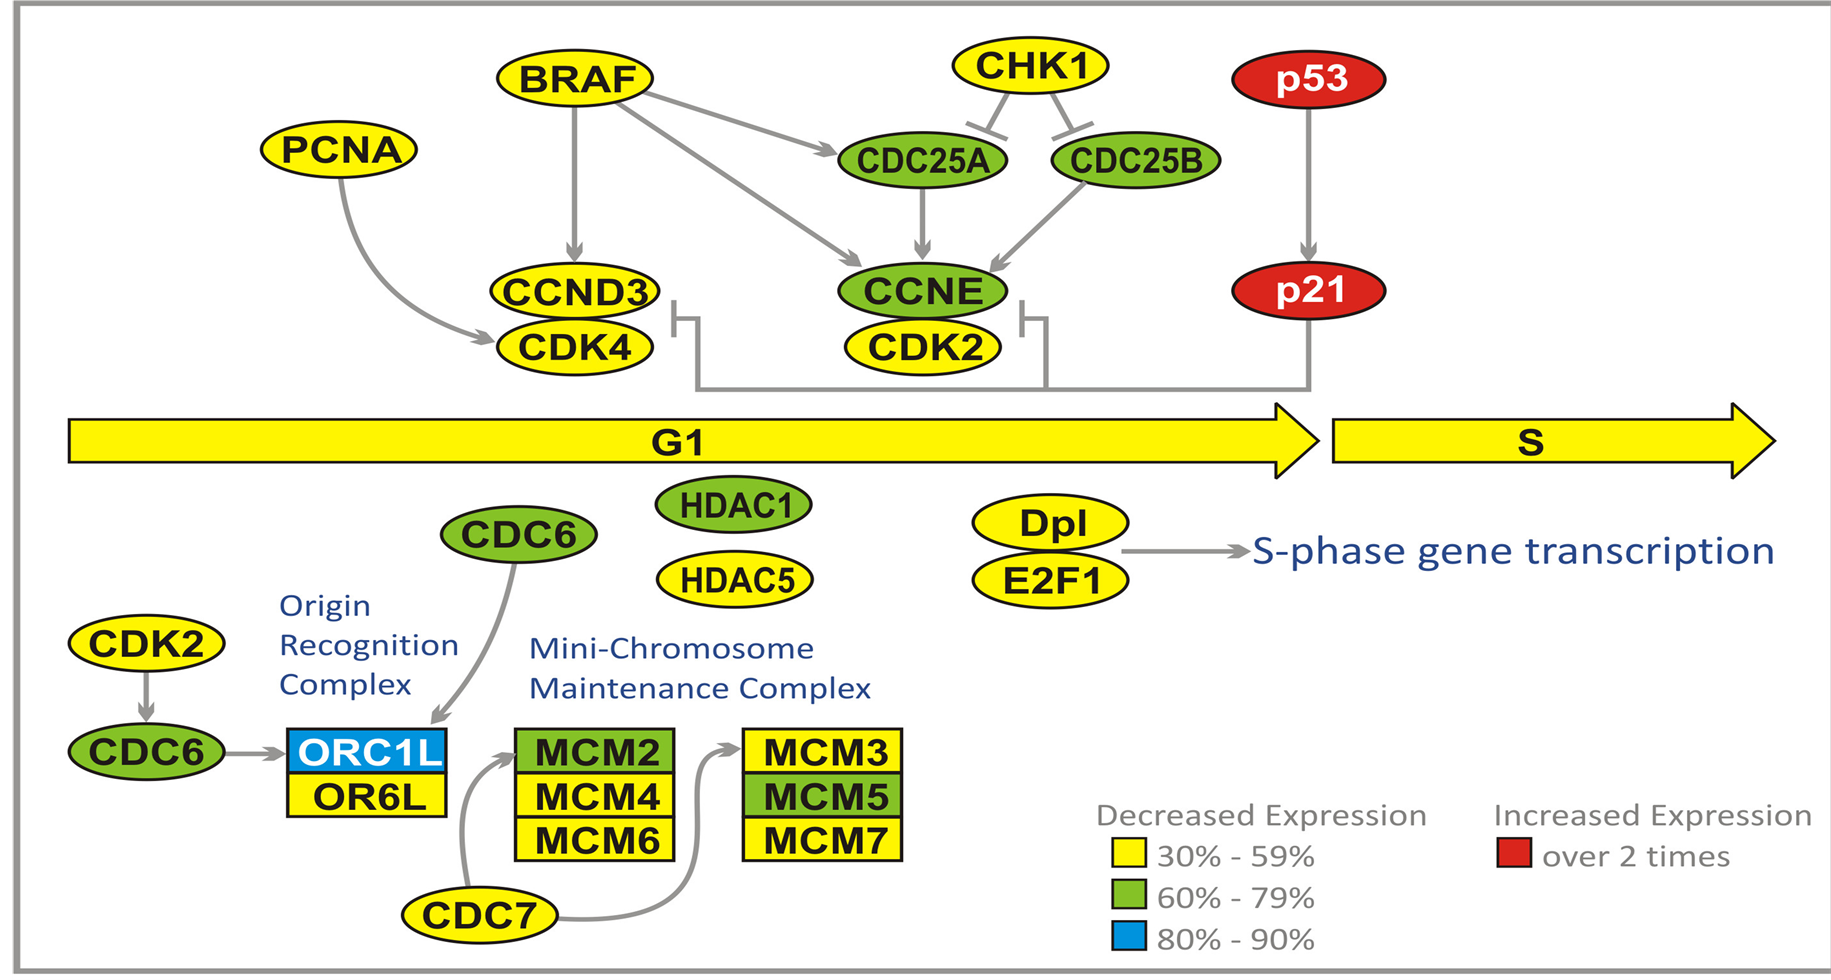
Figure 3. Effect of ANP treatment on gene expression of the cell cycle in U87 cells at G1/S checkpoint (abbreviations explained in text).
thesis of cyclin E, which forms a complex with CDK2. This complex is inhibited by p53 and p21 proteins, but activated by M-phase inducer phosphatase 1 and 2 (CDC25A and CDC25B). Both of these tyrosine protein phosphatases, dephosphorylate CDK2 and stimulate its kinase activity. They are acting at DNA damage checkpoint of G1. The G1 checkpoint stops progression into S-phase through inhibition of activation of cyclin D3/ CDK4 and cyclin E/CDK2 complexes. The checkpoints are triggered by DNA damage that leads to activation of TP53, which transactivates gene p21 producing a cyclin-dependent kinase inhibitor 1 (CKI1) protein. p21 protein inhibits both cyclin D3/CDK4 and cyclin E/CK2 complexes. Damaged DNA activates CHK1 kinase which inhibits (through phosphorylation) CDC25A and CDC25B.
A prominent effect of cyclin D3/CDK4 activity is exerted by regulatory proteins E2Fs which bind to the promoters of the genes encoding proteins required for crossing G1/S checkpoint. E2Fs cooperate with another transcription factor Dp1, encoded by TFDP1 gene. E2F1 binds retinoblastoma 1 protein (RB1). Such binding blocks the entry to S-phase. Cyclin D3/CDK4 phosphorylates RB1 which activates S-phase progression through release of E2F.
PG and PN reduce expression of CDC25A, CDC25B, cyclin E (CCNE) (60% - 79%). PCNA, BRAF, CCND3, CDK2, CDK4, Dp1, E2F1, and CHK1 (30% - 59%), and increase the expression of TP53 and p21 genes (over 2 times) [28] Table1 The effect of PG and PN on the expression of genes at G1/S checkpoint should prohibit the entry of GBM cells into S-phase of cell cycle. In addition all six genes of the Mini Chromosome Maintenance Complex (MCM) are downregulated, indicating a blockade of initiation of DNA replication in cell cycle of cells exposed to antineoplastons (Figure 3).
3.5. G2/M Checkpoint
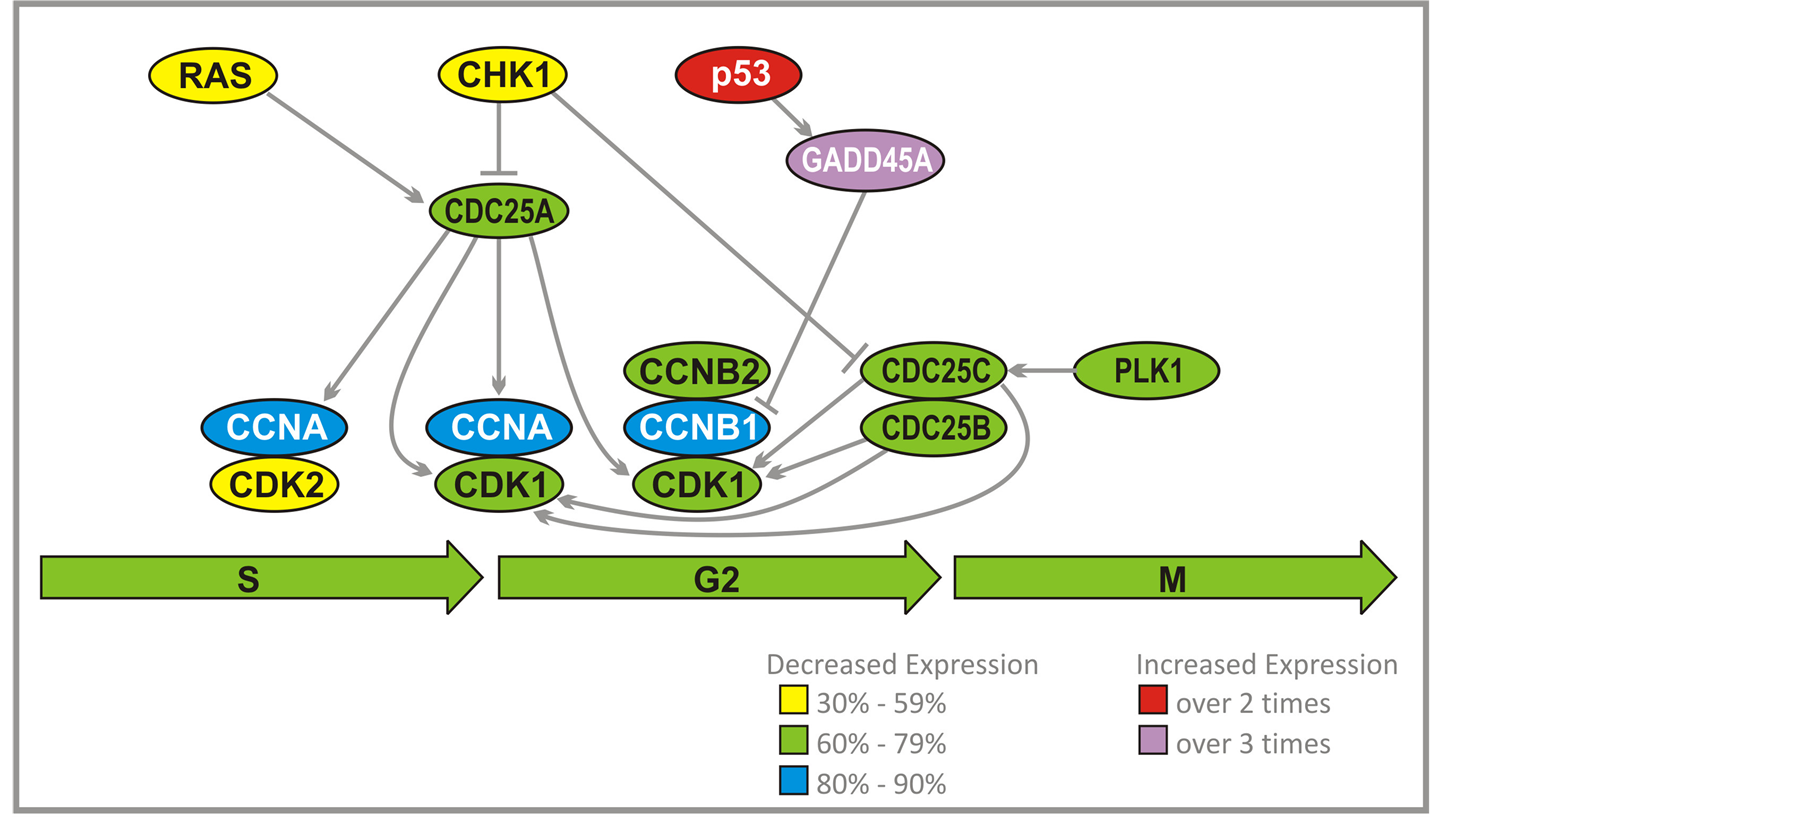
Activation of a complex cyclin A/CDK2 by CDC25A leads to DNA replication (Figure 4). Another function for cyclin A/CDK2 is to prevent a second replication. This is accomplished through dissociation of CDC6 from ORC complex, and a breakdown of pre-RC. MCM proteins and CDC6 are prevented from forming a complex at replication origin. CDC6 is destroyed by ubiquitylation by the Skp, Cullin, F-box containing (SCF) complex. Phosphorylation of some MCM proteins by cyclin A/CDK2 initiates export from the nucleus. High activity of cyclin A/CDK2 persists through G2 and early M-phases, which prevents repeated replication after S-phase is completed. Cyclins B1 and B2 accumulate during G2, which result in activation of the complex with CDK1. The complex remains inhibited by Wee kinase until crossing G2/M checkpoint. At that time CDC25C and to a lesser extent CDC25B and CDC25A stimulate kinase activity of CDK1 through dephosphorylation. Cyclin B1/B2/CDK1 is able to suppress its own inhibitor Weel and activate CDC25 group of kinases. CDC25C is activated by Polo-Like Kinase (PLK1). It is proposed that polo kinase, by activation of CDC25C, leads to stimulation of cyclin B1/B2/CDK1 complex that activates more CDC25C and inactivates Weel. This would dramatically accelerate activation of cyclin B1/B2/CDK1 and entry into mitosis. p53 through growth arrest and DNAdamage-inducible protein (GADD45A), inhibits cyclin B1.
PG and PN decrease expression of the genes which encode cyclin A and cyclin B1 (80% - 90%). CDC25A, CDC25B, CDC25C, CDK1, CDK2, cyclin B, and PLK1 (60% - 79%) (Figure 3, Figure 4(a)) and increase expression of TP53 and GADD45A (2 - 3 times). We have confirmed that the activity of PLK1 is indeed suppressed in U87 cells after exposure to ANP (Figure 4(b)). Such effects of PG and PN effectively stop the cell cycle of GBM at G2/M checkpoint [28] .
It is generally expected that if selective G2/M checkpoint medications are introduced, the treatment would minimize the adverse effect on normal cells. This is one of the reasons for extensive research in this area. None of these agents are currently available as FDA approved drugs.
3.6. Energy Metabolism Genes
Malignant brain tumors have substantial dysregulation of energy metabolism compared to normal cells. It is obvious that they require a lot of energy to grow, but in contrast to normal brain that oxidizes glucose and metabolites of fatty acids (ketone bodies) they primarily depend on glucose as the source of energy. Glutamine which can be metabolized to beta-hydroxybutyrate may offer another source of energy, but the transport of glutamine through the cell membrane is inhibited by PG. The process of energy production takes place in the mitochondria. Contrary to normal cells, malignant cells have a disturbed respiratory process and modify their glycolysis to anaerobic conditions. Such transition in metabolism is supported by AKT protein, but inhibited by p53. One of
 (a)
(a) (b)
(b)
Figure 4. (a) Effect of ANP treatment on gene expression of the cell cycle at G2/M checkpoints in U87 cells (abbreviations explained in text); (b) Activity of polo like kinase 1 (PLK1) is suppressed in U87 cells after exposure to ANP.
the important features of PG and PN anti-tumor activity is decreased expression of AKT2 and increased expression of TP53 (Table 1).
Glucose enters the cells through transporter GLUT-1, and is converted to pyruvate which inside the mitochondrion is metabolized to acetyl-CoA that enters tricarboxylic acid (TCA) cycle (Figure 5). The cycle produces ATP which delivers energy necessary for the tumor growth. Substantially decreased expression of the genes encoding enzymes of the TCA cycle markedly decreases energy production in malignant cells, and leads to their death. PG and PN decrease expression of gene PDP2 from 60% to 79%, and the following genes by 30% - 59%: Aconitase (ACO2), Isocitrate dehydrogenases (IDH3A, IDH3B, IDH2), dihydrolipoamide S-succinyl-transferase (DLST), oxoglutarate (alpha-ketoglutarate) dehydrogenase (OGDH), dihydrolipoamide dehydrogenase (DLD), Succinyl-CoA ligases (SUCLG1, SUCLG2), succinate dehydrogenase subunit-C (SDHC), fumarate hydrogenase (FH), and malate dehydrogenate (MDH1). We performed preliminary studies to measure lactic acid
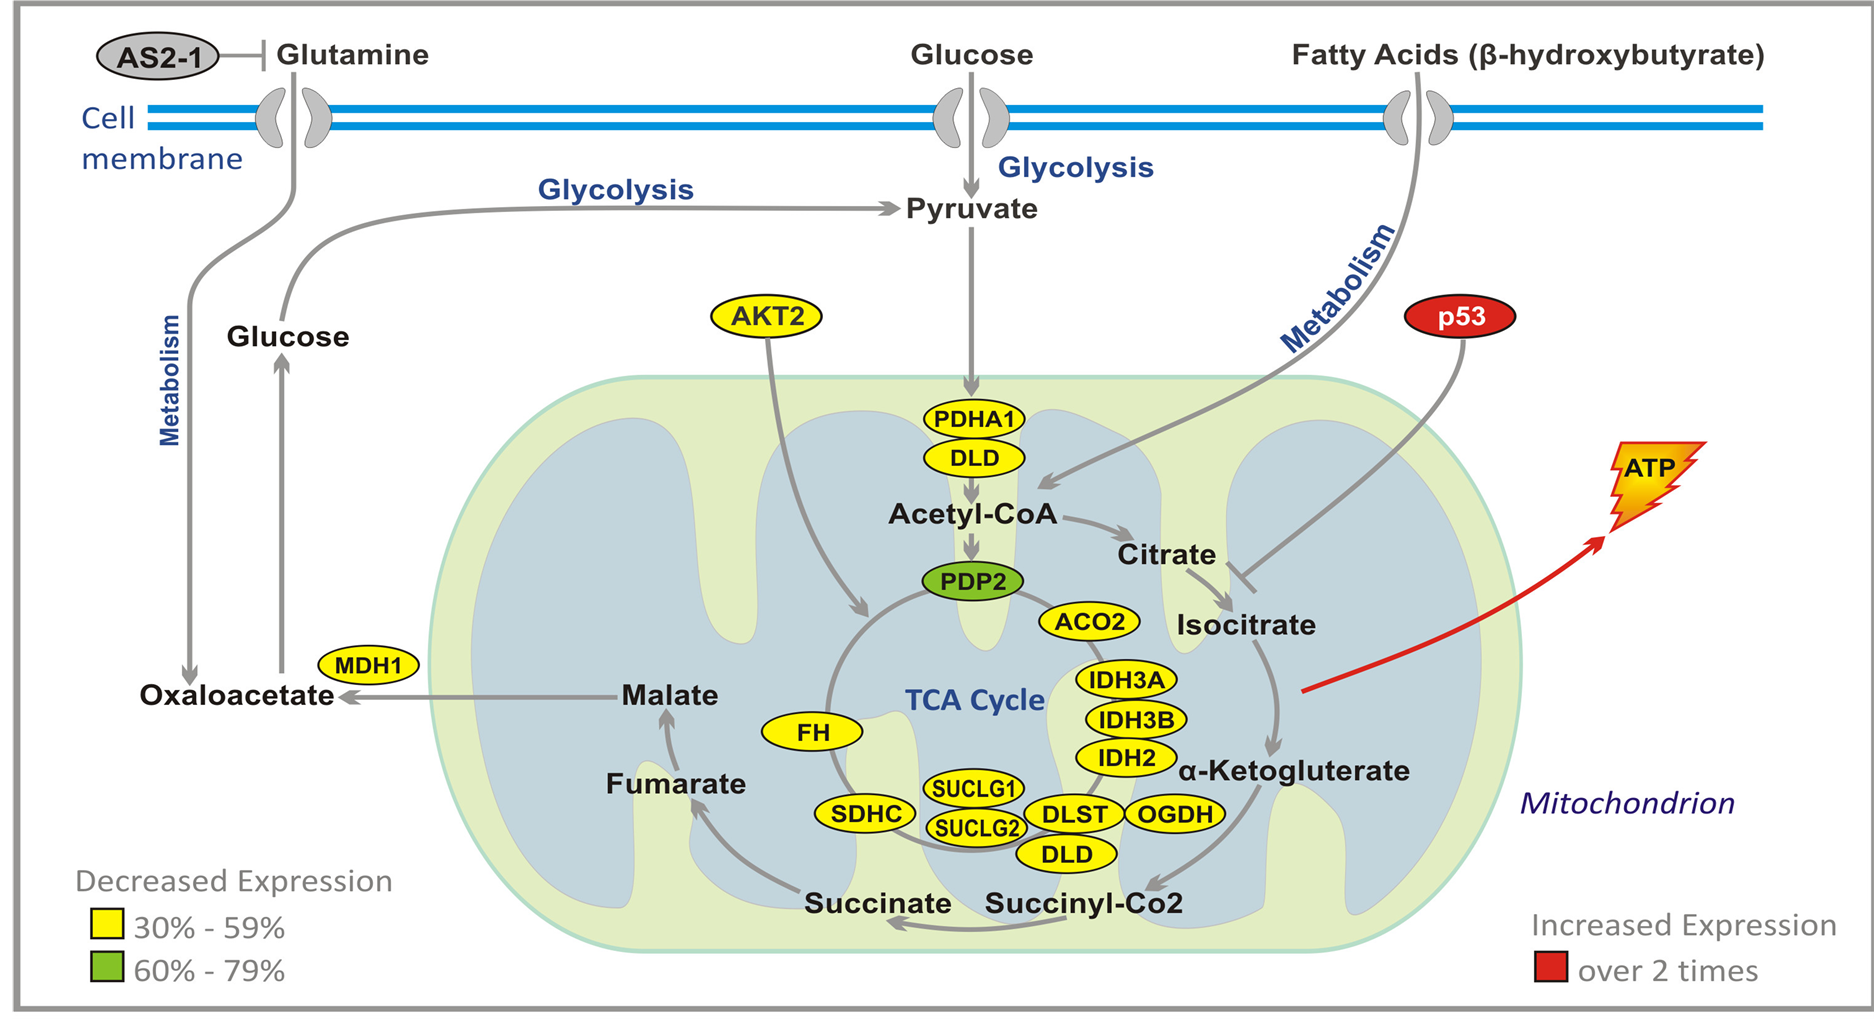
Figure 5. Effect of ANP treatment on gene expression of the energy metabolism pathways in U87 cells (abbreviations explained in text).
in growth medium after 24 hour treatment of U87 cells with ANP (Figure 6). A reduction in lactic acid production is seen. Also the pH of the growth medium does not decrease as would have been expected in medium if glycolysis pathways were unaffected.
3.7. Apoptosis Pathways Genes
Induction of neoplastic cell death is the final goal of any targeted therapy, but some regimens used in treatment of brain tumors, explore also direct apoptotic mechanisms. Apoptosis is a highly complex process (Figure 7), and it is the subject of numerous excellent reviews [40] -[42] . It proceeds through two main pathways. Extrinsic pathway leads through cluster of differentiation 95 (CD95) receptor, tumor necrosis factor (TNF) and TNF-related apoptosis-inducing ligand (TRAIL) [43] . The main event in the second (intrinsic) pathway is the release of cytochrome C from mitochondria [44] . The extrinsic and intrinsic pathways are united in the common cascade of activation of proteolytic enzymes, caspases, which together with cytochrome C and apoptotic protease-activating factor 1 (APAF1) form apoptosome (wheel of death) and degrade proteins. Proteins of B cell lymphoma 2 (BCL-2) family play an important part in regulation of apoptosis. Anti-apoptotic proteins, BCL-2 and BCL-XL inhibit pro-apoptotic BCL-2 associated X protein (BAX). Proteins BAX and BCL-2 associated death promoter (BAD) promote mitochondrial-outer-membrane permeabilization (MOMP) and release of cytochrome C. BAD is inhibited by RAS and AKT, and BAX is activated by p53 protein, which plays a central role in this process, and its loss leads to inhibition of apoptosis [41] [45] [46] . Through transactivation of p21, p53 protein causes arrest of the cell cycle at G1/S checkpoint, and is also instrumental in transcription of many apoptosis-associated genes including BAX [47] [48] .
PG and PN directly target apoptotic machinery [28] . They increase more than two times expression of TP53 (Table 1) and p21, and inhibit BCL-2 (based on studies of other researchers). We have also confirmed an increase in expression of caspase 5 (CASP5) by qPCR. Indirectly PG and PN promote apoptosis of cancerous cells through interruption of signal transmission in RAS and AKT pathways.
3.8. Neuronal Survival and Differentiation Genes
Neurotrophins are growth factors which are necessary for proper functioning and development of the nervous system. The two most important members of this group are nerve growth factor (NGF), and brain-derived neu-
 (a)
(a) (b)
(b)
Figure 6. Measurement of Lactic acid in growth medium of U87 cells treated with ANP for 24 hours. A decrease in lactic acid in growth medium is seen after 24 hours treatment of U87 cells with ANP, also a corresponding lack of pH decrease was seen. This could be due to an inhibition of glycolytic pathways as indicated by microarray data.
rotrophic factor (BDNF). These growth factors initiate signaling through two types of membrane receptors: Trk system potassium uptake protein A (TRKA) for NGF and TRKB for BDNF (Figure 8). After binding of NGF and BDNF, TRKA and TRKB form dimers which trigger the transactivation of tyrosine kinase domain, and initiate a cascade of signal transduction. NGF is responsible for trophic support of neurons, maintenance of sympathetic and sensory nervous system, and it has anti-neuropathy effect. BDNF is instrumental in synaptic transmission, memory processing, learning, and regulation of food intake.
The adult brain contains few areas of neurogenesis. In the hippocampus multipotent progenitor cells have the ability to differentiate into neurons, astrocytes, and oligodendrocytes. Mammalian achaete scute homolog-1 (MASH1) transcription factor plays a crucial role in differentiation and survival of neuronal progenitor cells. The signaling cascade activates MASH1 (Figure 8). Apoptosis-signaling regulating kinase-1 (ASK1) activates and recruits myocyte-enhancing factor 2C (MEF2C) to the MASH1 promoter. The signaling pathway leads first from ASK1 to Ca2+ calmodulin-dependent protein kinase 2 (CaMK2). Activated CaMK2 phosphorylates
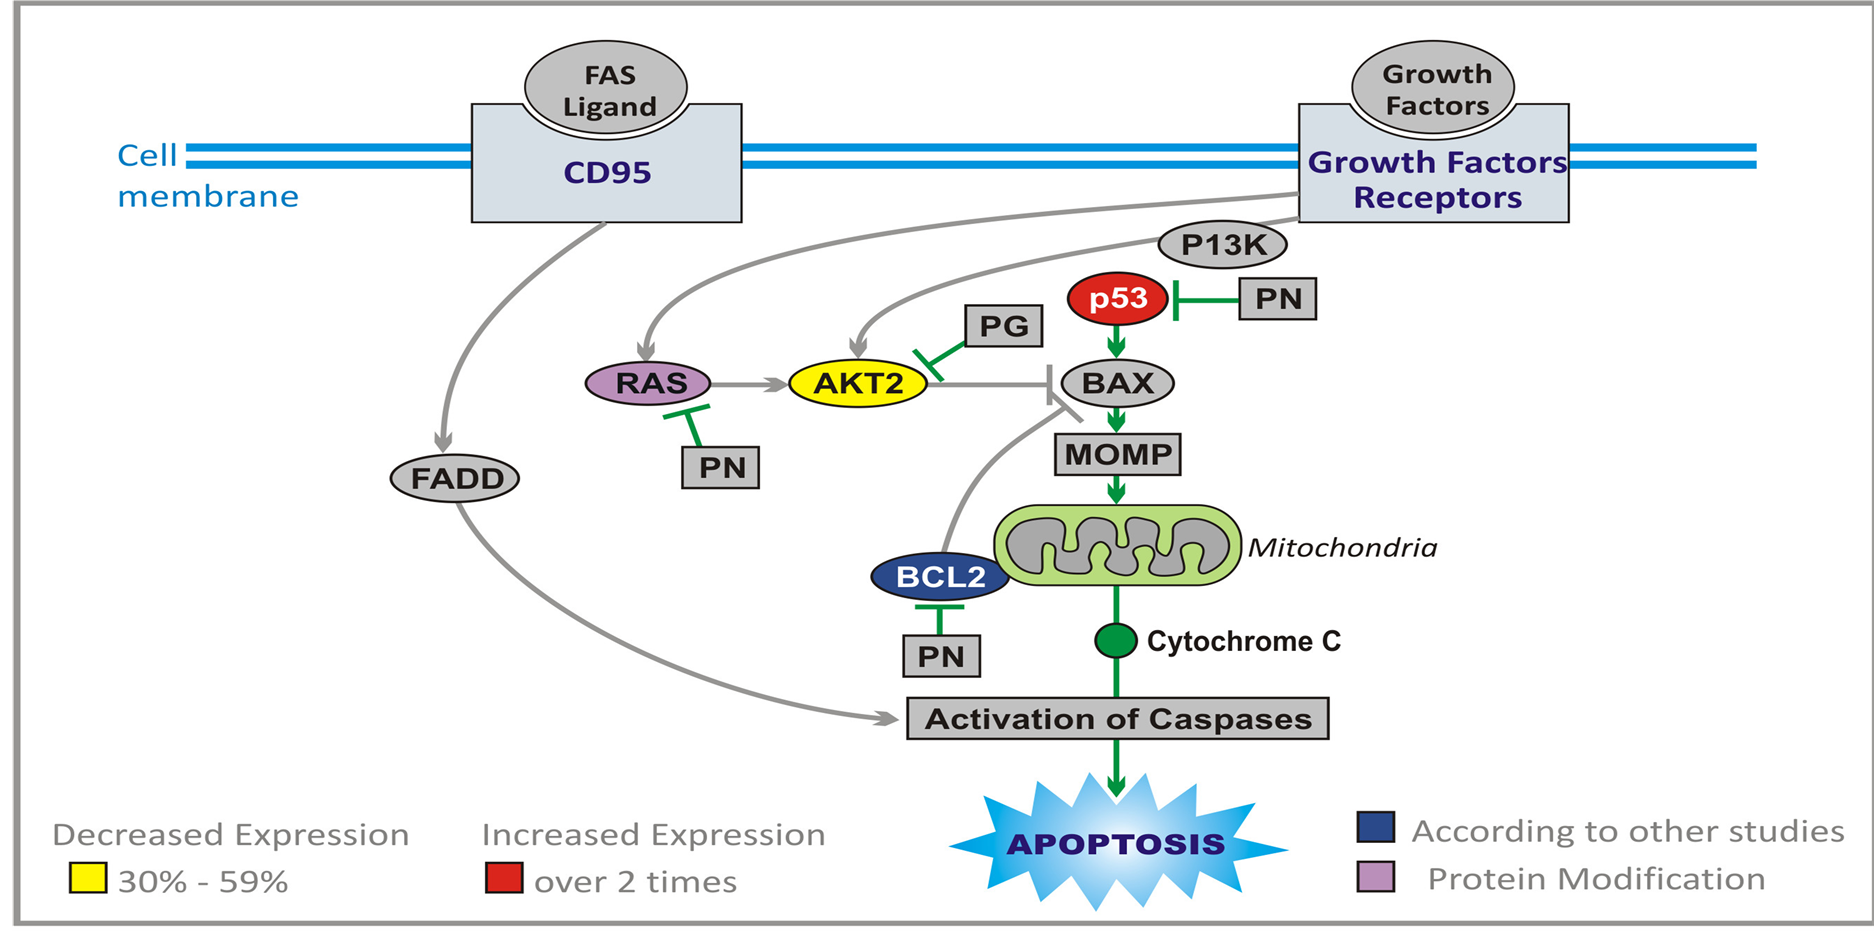
Figure 7. Effect of ANP treatment on gene expression of the apoptosis pathways in U87 cells (abbreviations explained in text).
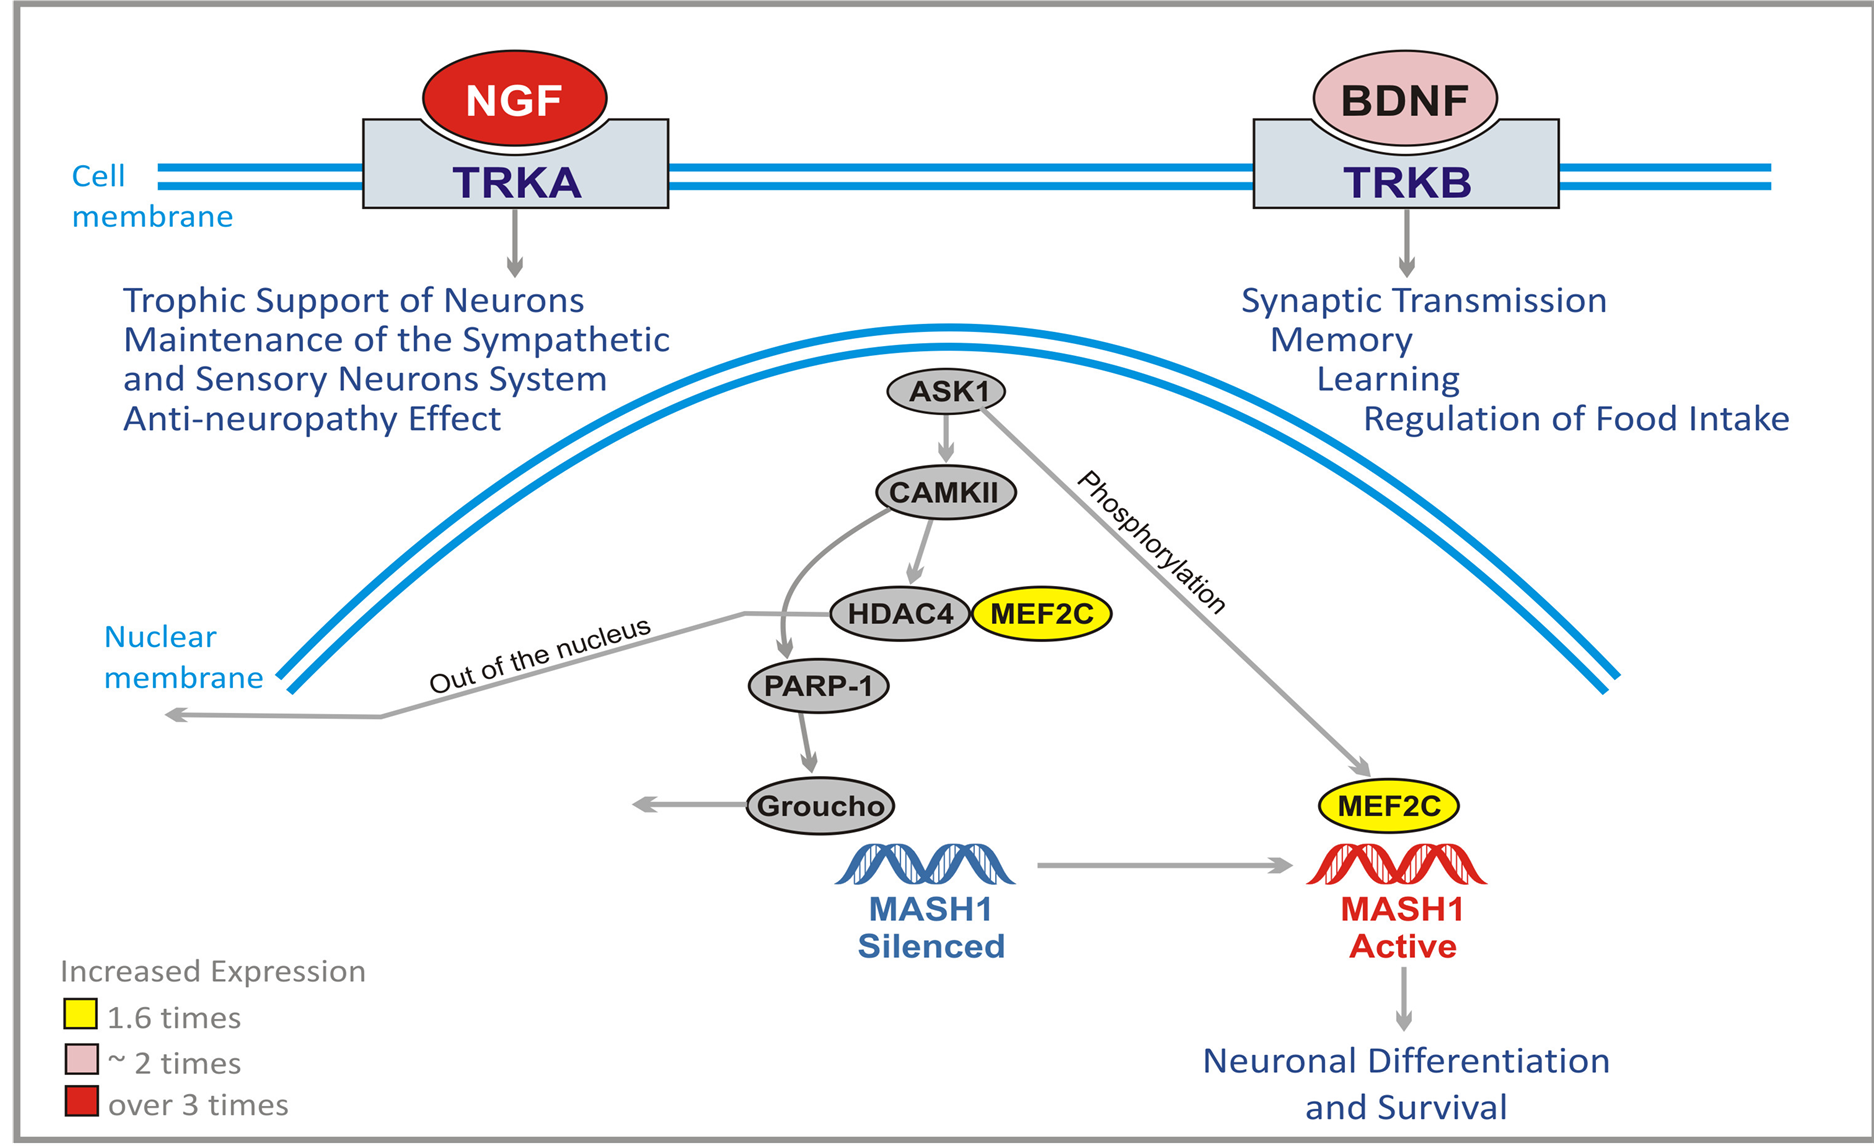
Figure 8. Effect of ANP treatment on gene expression of neuronal survival and differentiation in U87 cells (Abbreviations explained in text).
HDAC4 which is an inhibitor of MEF2C. Subsequently HDAC4 leaves the nucleus. At the same time CaMK2 activates poly (ADP)-ribose polymerase 1 (PARP-1) which dissociates Groucho/TLE co-repressor complex from the MASH1 promoter. Now ASK1 phosphorylates MEF2C which binds and activates MASH1 promoter leading to neuronal differentiation and survival.
PG and PN increase the expression of NGF by approximately 2 times, and BDNF over 3 times and MEF2C 1.6 times. Such effects may help the patient to recover from the damage caused by chemotherapy and radiation, and by progression of the tumor.
3.9. Cytokines and Inflammatory Response Genes
The involvement of immune cells in the body response to cancer is not completely understood. The brain imposes anatomical constraints on the immune system, but gliomas are known to have immune cell infiltrates including T-and B-cells, macrophages, and microglial cells. Cytokines are proteins that regulate the activation, growth, and differentiation of immune cells. They are either secreted or bound to the cell membranes. They affect almost every biological process. Recent studies confirm that a moderate immune response protects against brain tumor development. Immunotherapies accomplished some success in the treatment of brain tumors, and there is no doubt that they represent attractive future strategies. The study of the effect of PG and PN on GBM cells shows remarkably increased expression of inflammatory response genes. These are interesting, but preliminary data, and they need to be confirmed by the studies of gene expression in the cells of the immune system. Such positive effect on the expression of important genes of the immune system may increase anti-tumor effect as well as help the body to recover from immunosuppression and myelosuppression resulting from radiation and chemotherapy. In this area, especially interesting is over a 10-fold increase in expression of the genes for β-interferon-2 and approximately 5 times increased expression of the genes stimulating bone marrow activity: Interleukins (ILIA, ILBA, IL11, IL15), colony stimulating factors (CSF1, CSF3), chemokine (C-X-C motif) ligand 2 (CXCL2) and platelet derived growth factor 1 (PDGF1).
4. Discussion
The results of this study indicate that the ingredients of ANP and the metabolites of PB, PG and PN inhibit important signaling pathways such as RAS/MAPK/ERK and PI3K/AKT/PTEN and decrease metabolism and promote apoptosis in GBM cells. In close to 90% of GBM there is abnormal proliferation and survival signaling represented by RAS and AKT pathways [49] [50] . As shown in the Results, PG and PN interrupt signal transduction of RAS pathway through inhibition of RAS, BRAF, ERK5, CDC42, MAP4K4, and JUN. Further interruption of signal transduction in this pathway is accomplished through increased expression of tumor suppressor genes TP53, NF1, DUSP1, DUSP6, and PTPRR. The AKT pathway is inhibited through decreased expression of AKT and increased expression of tumor suppressor genes PTEN, p27, TXNIP, and VDUP1. This leads to arrest of the cell cycle at G1 phase and inhibition of proliferation.
An extremely important aspect of PG and PN activity is regulation of cell cycle progression. The signals transmitted through pathways downstream at growth factor receptors increase expression of cyclin genes (CCN). Cyclins serve as regulatory domains of cyclin-dependent kinases 4 and 6 (CDK4, CDK6), and enhance catalytic activities of CDK’s and their nuclear translocation. RB1 is phosphorylated and releases E2F transcription factors that affect the expression of genes necessary for cell cycle progression (CDC’s). Active RB1 recruits HDACs which silence transcription involved in cell cycle progression. Abnormal RB1 signaling was found in approximately 80% of GBM [49] . The action of PG and PN on expression of numerous genes of CDK, CCN, CDC, and HDAC groups, and E2F1 is described in the Results. The decreased expression of these genes plus MCM complex as well as increased expression of TP53, p21, and GADD45A arrest GBM cells at G1/S and G2/M checkpoints.
Rapid proliferation of GBM cells requires constant supply of energy, and the main sources are glycolysis and glutaminolysis. Neglected for a long time, regulation of metabolism in GBM is now moving to the center place [51] . RB1 and members of the E2F group regulate expression of the enzymes necessary for nucleotide synthesis, thymidine kinase1 (TK1) and dihydrofolate reductase (DHFR) [52] -[55] . RB1 also indirectly inhibits the glycolytic cycle through oncogene MYCC and through binding E2Fs, which otherwise can activate transcription of the MYCC promoter. On the other hand, MYCC affects the glycolytic cycle through GLUT-1, HK2, LDHA, and PKM2 [56] . The effect of PG and PN on the TCA cycle was explained in the Results. It is important to stress the decreased expression of IDH2, IDH3A, and IDH3B. The previous studies documented increased activity of the energy cycle through RAS and AKT signaling, which is interrupted by PG and PN. The substantial upregulation of VDUP1 may play a critical in the blockade of glycolysis in GBM by destabilizing hypoxia inducible factor 1 (HIF1 α). VDUP1 has been shown to mediate the nuclear transport of HIF1 alpha, leading to its destabilization. HIF’s are transcription factors that activate glycolysis and angiogenesis under hypoxic conditions found in GBM.
An alternative pathway to provide carbons to the TCA cycle is by using glutamate obtained form glutamine through glutaminolysis [57] [58] . The important oncogenes, including MCCC, increase expression of glutamine transporters and glutaminase 1 (GLS1) [59] [60] . RB1 is also decreasing glutamine uptake [52] . In addition, the numbers of E2F group increase glutaminolysis through association with promoters of glutaminolytic enzymes [52] . PN binds glutamine in the liver and forms PG which decreased its availability for the energy cycle. Based on our studies, PG produces a dose-dependent inhibition of glutamine uptake.
The final goal of targeted therapy is to cause programmed cell death of malignant cells. PG and PN cause up-regulation of the expression of pro-apoptotic genes TP53 and p21. This effect, in combination with decreased expression of AKT2 and BCL-2 promotes MOMP, release of cytochrome C and activation of caspases, leading to apoptosis. The additional important effect of PG and PN is on the expression of the genes, which provide trophic support of neurons and help synaptic transmission. Most important is the increase of expression of NGF, BDNF and MEDF2C, which may help normal cells recovery from toxicity of radiation therapy and chemotherapy.
5. Conclusion
GBM cells form a highly complex system which resists destruction by standard radiation therapy and chemotherapy. The characteristics of GBM cells arise from complex interactions from a number of interrelated networks, such as proliferation survival signaling initiated by growth factors, cell cycle signaling centered around RB1 and apoptotic mechanisms linked to p53 signaling. Each of these three networks is altered in approximately 80% to 90% of GBM cells. The interactions between these networks form the system which is difficult to control by a single drug. ANP and PB affect most of the important components of this network, but the activity of these drugs is moderate. They cause from 30% to 90% decrease of expression of genes which promote proliferation and usually two to three folds increase of expression of the genes that inhibit proliferation of GBM cells. The exception is the greater up-regulation of VDUPI/TXNIP protein which has the effect on increased expression of PTEN and stabilization of p27 tumor suppressor gene. It is proposed that therapeutic effects of PB and ANP are the result of multiplicity of moderate and weak effects of a number of genes, which explains why a small percentage of GBM cases can be successfully treated with ANP and PB as single drugs. Tolerable toxicity profile offers another possibility to more effectively control GBM progression through a combination with additional targeted drugs. Some of the data based on the gene array study have already been published separately [28] . The authors are currently conducting further research since our data obtained from the gene array studies are preliminary and call for further studies at the functional level.
Acknowledgements
This study was supported by and carried out at the Burzynski Research Institute Inc. (BRI), Houston TX, USA. The Microarray assay was supported by BRI and carried out at Center for Functional Genomics, University of Albany, NY, USA.
Conflict of Interest Disclosure
Stanislaw S. Burzynski MD, PhD is the President and Chairman of the Board of Directors and a stockholder of Burzynski Research Institute Inc., the sponsor of this research study. Sonali Patil PhD is an employee at BRI.
References
- Burzynski, S. (1968) Investigations on Amino Acids and Peptides in Blood Serum of Healthy People and Patients with Chronic Renal Insufficiency. Medical Academy, Lublin.
- Burzynski, S. (1969) Investigations on Unknown Ninhydrin-Reacting Substances in Human Blood Serum. I. Attempts at Identification of Three Such Substances. Experientia, 25, 490-491. http://dx.doi.org/10.1007/BF01900774
- Burzynski, S.R. (1973) Biologically Active Peptides in Human Urine: I. Isolation of a Group of Medium-Sized Peptides. Physiological Chemistry and Physics, 5, 437-447.
- Burzynski, S.R., Ungar, A.L. and Lubanski, E. (1974) Biologically Active Peptides in Human Urine: II. Effect on Intestinal Smooth Muscle and Heart. Physiological Chemistry and Physics, 6, 457-468.
- Burzynski, S.R., Loo, T.L., Ho, D.H., Rao, P.N., Georgiades, G. and Kratzenstein, H. (1978) Biologically Active Peptides in Human Urine: III. Inhibitors of the Growth of Leukemia, Osteosarcoma and HeLa Cells. Physiological Chemistry and Physics, 8, 13-22.
- Burzynski, S.R. (1976) Antineoplastons: Biochemical Defense against Cancer. Physiological Chemistry and Physics, 8, 275-279.
- Burzynski, S.R. (1986) Antineoplastons—History of the Research (I). Drugs under Experimental and Clinical Research, 12, 1-9.
- Burzynski, S.R. (2004) The Present State of Antineoplaston Research (1). Integrative Cancer Therapies, 3, 47-58. http://dx.doi.org/10.1177/1534735403261964
- Bartek, J., Ng, K., Fischer, W., Carter, B. and Chen, C. (2012) Key Concepts in Glioblastoma Therapy. Journal of Neurology, Neurosurgery Psychiatry, 83, 753-760. http://dx.doi.org/10.1136/jnnp-2011-300709
- Burzynski, S.R. (1995) Potential of Antineoplastons in Diseases of Old Age. Drugs Aging, 7, 157-167. http://dx.doi.org/10.2165/00002512-199507030-00001
- Ostrom, Q.T., Gittleman, H.R., Farah, P., Ondracek, A., Chen, Y., Wolinsky, Y., Stroup, N.E., Kruchko, C. and Barnholtz-Sloan, J.S. (2013) CBTRUS Statistical Report: Primary Brain and Central Nervous System Tumors Diagnosed in the United States 2006-2010. Neuro-Oncology, 15, ii1-ii56. http://dx.doi.org/10.1093/neuonc/not151
- Newton, H.B. (1994) Primary Brain Tumors: Review of Etiology, Diagnosis, and Treatment. American Family Physician, 49, 787-797.
- Buckner, J.C., Brown, P.D., O’Neill, B.P., Meyer, F.B., Wetmore, C.J. and Uhm, J.H. (2007) Central Nervous System Tumors. Mayo Clinic Proceedings, 82, 1271-1286. http://dx.doi.org/10.4065/82.10.1271
- CGAR Network (2008) Comprehensive Genomic Characterization Defines Human Glioblastoma Genes and Core Pathways. Nature, 455, 1061-1068. http://dx.doi.org/10.1038/nature07385
- Sturm, D., Witt, H., Hovestadt, V., Khuong-Quang, D.A., Jones, D.T.W., Konermann, C., et al. (2012) Hotspot Mutations in H3F3A and IDH1 Define Distinct Epigenetic and Biological Subgroups of Glioblastoma. Cancer Cell, 22, 425-437. http://dx.doi.org/10.1016/j.ccr.2012.08.024
- Kim, Y.W., Koul, D., Kim, S.H., Lucio-Eterovic, A.K., Freire, P.R., Yao, J., Wang, J., Almeida, J.S., Aldape, K. and Alfred Yung, W.K. (2013) Identification of Prognostic Gene Signatures of Glioblastoma: A Study Based on TCGA Data Analysis. Neuro-Oncology, 15, 829-839.http://dx.doi.org/10.1093/neuonc/not024
- Maitland, M.L. and Schilsky, R.L. (2011) Clinical Trials in the Era of Personalized Oncology. CA: A Cancer Journal for Clinicians, 61, 365-381. http://dx.doi.org/10.3322/caac.20135
- de Tayrac, M., Aubry, M., Saikali, S., Etcheverry, A., Surbled, C., Guenot, F., et al. (2011) A 4-Gene Signature Associated with Clinical Outcome in High-Grade Gliomas. Clinical Cancer Research, 17, 317-327. http://dx.doi.org/10.1158/1078-0432.CCR-10-1126
- Burzynski, S.R. (2006) Treatments for Astrocytic Tumors in Children: Current and Emerging Strategies. Pediatric Drugs, 8, 167-168. http://dx.doi.org/10.2165/00148581-200608030-00003
- Burzynski, S.R., Janicki, T.J., Burzynski, G.S. and Marszalek, A. (2014) The Response and Survival of Children with Recurrent Diffuse Intrinsic Pontine Glioma on Phase II Study of Antineoplastons A10 and AS2-1 in Patients with Brainstem Glioma. Child’s Nervous System. http://link.springer.com/article/10.1007/s00381-014-2401-z
- Burzynski, S.R., Janicki, T.J., Burzynski, G.S. and Marszalek, A. (2014) A Phase II Study of Antineoplastons A10 and AS2-1 in Children with High-Grade Glioma. Final Report (Protocol BT-06) and Review of Recent Trials. Journal of Cancer Therapy, 5, 565-577. http://dx.doi.org/10.4236/jct.2014.56065
- Burzynski, S.R., Janicki, T.J. and Burzynski, G.S. (2014) A Phase II Study of Antineoplastons A10 and AS2-1 in Adult Patients with Recurrent Glioblastoma Multiforme. Final Report (Protocol BT-21). Journal of Cancer Therapy, in press.
- Burzynski, S.R., Janicki, T.J., Burzynski, G.S. and Marszalek, A. (2014) A Phase II Study of Antineoplastons A10 and AS2-1 in Children with Recurrent Refractory or Progressive Primary Brain Tumors. Finalr Report (Protocol BT-22). Journal of Cancer Therapy, in press.
- Burzynski, S.R., Janicki, T.J. and Burzynski, G.S. (2014) Recurrent Glioblastoma Multiforme, a Strategy for Long Term Survival. Journal of Cancer Therapy, in press.
- Brusilow, S.W., Danney, M., Waber, L.J., Batshaw, M., Burton, B., Levitsky, L., Roth, K., McKeethren, C. and Ward, J. (1984) Treatment of Episodic Hyperammonemia in Children with Inborn Errors of Urea Synthesis. New England Journal of Medicine, 310, 1630-1634. http://dx.doi.org/10.1056/NEJM198406213102503
- Iannitti, T. and Palmieri, B. (2011) Clinical and Experimental Applications of Sodium Phenylbutyrate. Drugs in R & D, 11, 227-249. http://dx.doi.org/10.2165/11591280-000000000-00000
- Burzynski, S.R. (2006) Targeted Therapy for Brain Tumors. In: Yang, A.V., Ed., Brain Cancer Therapy and Surgical Interventions, Horizons in Cancer Research, Vol. 27, Nova Science Publishers, Inc., Hauppauge, 77-11.
- Patil, S.S., Burzynski, S.R., Mrowczynski, E., Grela, K. and Chittur, S.V. (2012) Phenylacetylglutaminate and Phenylacetate in Combination Upregulate VDUP1, Cause Cell Cycle Blockade and Apoptosis in U87 Glioblastoma Cells. Journal of Cancer Therapy, 3, 192-200. http://dx.doi.org/10.4236/jct.2012.33028
- Malumbres, M. and Barbacid, M. (2003) RAS Oncogenes: The First 30 Years. Nature Reviews Cancer, 3, 459-465. http://dx.doi.org/10.1038/nrc1097
- Newton, H.B. (2004) Molecular Neuro-Oncology and Development of Targeted Therapeutic Strategies for Brain Tumors. Part 2: PI3K/Akt/PTEN, mTOR, SHH/PTCH and Angiogenesis. Expert Review of Anticancer Therapy, 4, 105-128. http://dx.doi.org/10.1586/14737140.4.1.105
- Fujii, T., Nakamura, A.M., Yokoyama, G., Yamaguchi, M., Tayama, K., Miwa, K., et al. (2005) Antineoplaston Induces G1 Arrest by PKCalpha and MAPK Pathway in SKBR-3 Breast Cancer Cells. Oncology Reports, 14, 489-494.
- Deschenes-Simard, X., Kottakis, F., Meloche, S. and Ferbeyre, G. (2014) ERKs in Cancer: Friends or Foes? Cancer Research, 74, 412-419. http://dx.doi.org/10.1158/0008-5472.CAN-13-2381
- Vivanco, I. and Sawyers, C.L. (2002) The Phosphatidylinositol 3-Kinase AKT Pathway in Human Cancer. Nature Reviews Cancer, 2, 489-501. http://dx.doi.org/10.1038/nrc839
- Bjornsti, M.A. and Houghton, P.J. (2004) The TOR Pathway: A Target for Cancer Therapy. Nature Reviews Cancer, 4, 335-348. http://dx.doi.org/10.1038/nrc1362
- Sonoda, Y., Ozawa, T., Aldape, K.D., Deen, D.F., Berger, M.S. and Pieper, R.O. (2001) Akt Pathway Activation Converts Anaplastic Astrocytoma to Glioblastoma Multiforme in a Human Astrocyte Model of Glioma. Cancer Research, 61, 6674-6678.
- Mills, G.B., Lu, Y. and Kohn, E.C. (2001) Linking Molecular Therapeutic to Molecular Diagnostics: Inhibition of the FRAP/RAFT/TOR Component of the PI3K Pathway Preferentially Blocks PTEN Mutant Cells in Vitro and in Vivo. Proceedings of the National Academy of Sciences of the United States of America, 98, 10031-10033. http://dx.doi.org/10.1073/pnas.191379498
- Nishiyama, A., Matsui, M., Iwata, S., Hirota, K., Masutani, H., Nakamura, H., Takagi, Y., Sono, H., Gon, Y. and Yodoi, J. (1999) Identification of Thioredoxin-Binding Protein-2/Vitamin D3 Up-Regulated Protein 1 as a Negative Regulator of Thioredoxin Function and Expression. Journal of Biological Chemistry, 274, 21645-21650. http://dx.doi.org/10.1074/jbc.274.31.21645
- Han, S.H., Jeon, J.H., Ju, H.R., Jung, U., Kim, K.Y., Yoo, H.S., et al. (2003) VDUP1 Upregulated by TGF-β1 and 1,25-Dihydroxy-Vitamin D3 Inhibits Tumor Cell Growth by Blocking Cell-Cycle Progression. Oncogene, 22, 4035-4046.http://dx.doi.org/10.1038/sj.onc.1206610
- Massague, J. (2004) G1 Cell-Cycle Control and Cancer. Nature, 432, 298-306. http://dx.doi.org/10.1038/nature03094
- Pelengaris, S., Khan, M. and Evan, G. (2002) c-MYC: More than Just a Matter of Life and Death. Nature Reviews Cancer, 2, 764-776. http://dx.doi.org/10.1038/nrc904
- Brown, J.M. and Attardi, L.D. (2005) The Role of Apoptosis in Cancer Development and Treatment Response. Nature Reviews Cancer, 5, 231-237.
- Ghobrial, I.M., Witzig, T.E. and Adjei, A.A. (2005) Targeting Apoptosis Pathways in Cancer Therapy. CA: A Cancer Journal for Clinicians, 55, 178-194. http://dx.doi.org/10.3322/canjclin.55.3.178
- Hueber, A.O., Zornig, M., Lyon, D., Suda, T., Nagata, S. and Evan, G.I. (1997) Requirement for the CD95 Receptor-Ligand Pathway in c-Myc-Induced Apoptosis. Science, 278, 1305-1309. http://dx.doi.org/10.1126/science.278.5341.1305
- Hockenbery, D., Nunez, G., Milliman, C., Schreiber, R.D. and Korsmeyer, S.J. (1990) Bcl-2 Is an Inner Mitochondrial Membrane Protein That Blocks Programmed Cell Death. Nature, 348, 334-336. http://dx.doi.org/10.1038/348334a0
- Levine, A.J. (1997) p53, the Cellular Gatekeeper for Growth and Division. Cell, 88, 323-331. http://dx.doi.org/10.1016/S0092-8674(00)81871-1
- el-Deiry, W.S., Harper, J.W., O’Connor, P.M., Velculescu, V.E., Canman, C.E., Jackman, J., et al. (1994) WAF1/CIP1 Is Induced in p53-Mediated G1 Arrest and Apoptosis. Cancer Research, 54, 1169-1174.
- Yu, J., Zhang, L., Hwang, P.M., Rago, C., Kinzler, K.W. and Vogelstein, B. (1999) Identification and Classification of p53-Regulated Genes. Proceedings of the National Academy of Sciences of the United States of America, 96, 14517-14522. http://dx.doi.org/10.1073/pnas.96.25.14517
- Lozano, G. and Zambetti, G.P. (2005) What Have Animal Models Taught Us about the p53 Pathway? Journal of Pathology, 205, 206-220. http://dx.doi.org/10.1002/path.1704
- Parsons, D.W., Jones, S., Zhang, X., Lin, J.C., Leary, R.J., Angenendt, P., et al. (2008) An Integrated Genomic Analysis of Human Glioblastoma Multiforme. Science, 321, 1807-1812. http://dx.doi.org/10.1126/science.1164382
- Wick, W., Weller, M., Weiler, M., Batchelor, T., Yung, A.W.K. and Platten, M. (2011) Pathway Inhibition: Emerging Molecular Targets for Treating Glioblastoma. Neuro-Oncology, 13, 566-579. http://dx.doi.org/10.1093/neuonc/nor039
- Chinnaiyan, P., Kensicki, E., Bloom, G., Prabhu, A., Sarcar, B., Kahali, S., Eschrich, S., Qu, X.T., Forsyth, P. and Gillies, R. (2012) The Metabolomic Signature of Malignant Glioma Reflects Accelerated Anabolic Metabolism. Cancer Research, 72, 5878-5888.http://dx.doi.org/10.1158/0008-5472.CAN-12-1572-T
- Clem, B.F. and Chesney, J. (2012) Molecular Pathways: Regulation of Metabolism by RB. Clinical Cancer Research, 18, 6096-6100. http://dx.doi.org/10.1158/1078-0432.CCR-11-3164
- Dou, Q.P., Zhao, S., Levin, A.H., Wang, J., Helin, K. and Pardee, A.B. (1994) G1/S-Regulated E2F-Containing Protein Complexes Bind to the Mouse Thymidine Kinase Gene Promoter. Journal of Biological Chemistry, 269, 1306-1313.
- Tommasi, S. and Pfeifer, G.P. (1997) Constitutive Protection of E2F Recognition Sequences in the Human Thymidine Kinase Promoter during Cell Cycle Progression. Journal of Biological Chemistry, 272, 30483-30490. http://dx.doi.org/10.1074/jbc.272.48.30483
- Wade, M., Kowalik, T.F., Mudryj, M., Huang, E.S. and Azizkhan, J.C. (1992) E2F Mediates Dihydrofolate Reductase Promoter Activation and Multiprotein Complex Formation in Human Cytomegalovirus Infection. Molecular and Cellular Biology, 12, 4364-4374.
- Dang, C.V., Le, A. and Gao, P. (2009) MYC-Induced Cancer Cell Energy Metabolism and Therapeutic Opportunities. Clinical Cancer Research, 15, 6479-6483. http://dx.doi.org/10.1158/1078-0432.CCR-09-0889
- DeBerardinis, R.J. and Cheng, T. (2009) Q’s Next: The Diverse Functions of Glutamine in Metabolism, Cell Biology and Cancer. Oncogene, 29, 313-324. http://dx.doi.org/10.1038/onc.2009.358
- Wise, D.R. and Thompson, C.B. (2010) Glutamine Addiction: A New Therapeutic Target in Cancer. Trends in Biochemical Sciences, 35, 427-433. http://dx.doi.org/10.1016/j.tibs.2010.05.003
- Gao, P., Tchernyshyov, I., Chang, T.C., Lee, Y.S., Kita, K., Ochi, T., et al. (2009) c-Myc Suppression of miR-23a/b Enhances Mitochondrial Glutaminase Expression and Glutamine Metabolism. Nature, 458, 762-765. http://dx.doi.org/10.1038/nature07823
- Yuneva, M., Zamboni, N., Oefner, P., Sachidanandam, R. and Lazebnik, Y. (2007) Deficiency in Glutamine but Not Glucose Induces MYC-Dependent Apoptosis in Human Cells. Journal of Cell Biology, 178, 93-105. http://dx.doi.org/10.1083/jcb.200703099