Journal of Cancer Therapy
Vol.4 No.3(2013), Article ID:31603,11 pages DOI:10.4236/jct.2013.43087
Geldanamycin Combination with Colcemid Induces Mitotic Arrest through Stabilization of bubR1 Mitotic Kinase in Human Tumor Cells
![]()
CSIR—Centre for Cellular and Molecular Biology, Hyderabad, India.
Email: vikrantpitke@gmail.com, lpareddy@gmail.com, ujwalkumar@gmail.com, sreedevi@ccmb.res.in, upasana.sarangi25@googlemail.com, #assr@ccmb.res.in
Copyright © 2013 Pitke Vikrant Vinay et al. This is an open access article distributed under the Creative Commons Attribution License, which permits unrestricted use, distribution, and reproduction in any medium, provided the original work is properly cited.
Received March 15th, 2013; revised April 16th, 2013; accepted April 24th, 2013
Keywords: Hsp90; Geldanamycin; bubR1; Cell Cycle; Tumor Cells
ABSTRACT
Mitosis-targeted anti-cancer therapies gained much attention in recent years. However, lack of tumor selectivity poses limitations to the current anti-mitotic drugs to be used as broad-spectrum anti-cancer agents. In this study, we show that combination treatment of colcemid, an inhibitor of microtubule polymerization with geldanamycin, an inhibitor of cancer chaperone, Hsp90 irreversibly targets mitosis through mitotic kinase bubR1 stabilization. When the individual and combination drugs treatments were tested against tumor cells (IMR-32 and HeLa) and non-tumor cells (SRA01), the combination treatment showed significant increase in cytotoxicity only in tumor cells followed by G2/M cell cycle block. The IMR-32 cells showed enhanced cytotoxicity in response to combination treatments, compared to HeLa cells. Further studies revealed that the G2/M arrest in IMR-32 correlates with both increased bubR1 nuclear localization and metaphase arrest. The siRNA knockdown of bubR1 has decreased tumor cell response to geldanamycin suggesting Hsp90-dependent regulation of bubR1. The combination treatment also showed inactivation of non-canonical β-catenin signaling suggesting inhibition of cancer growth. In addition, the combination treatment has significantly affected the distribution and functions of bubR1 downstream mitotic kinases such as aurks and plk1 indicating the combinatorial attack of combination treatment. In conclusion, we demonstrate that colcemid and GA combination treatment compromises the division potential of tumor cells interfering with the mitosis through bubR1 kinase.
1. Introduction
Cancer arises from deregulated cell cycle control resulting in the uncontrolled cell proliferation [1]. Considering the importance of APC/C (anaphase promoting complex/ cyclosome) in the control of mitosis, chemotherapeutic interventions of mitotic kinases have emerged as one of the anticancer strategies [2,3]. The mitotic kinases such as, budding uninhibited by benzimidazoles 1 homolog beta (bubR1) [4], polo-like kinase (plk1) [5] and aurora kinases (aurks) [6] are involved in proper completion of spindle assembly and chromosome alignment. The bubR1 kinase belongs to the mitotic arrest deficient (MAD) family of proteins and is the central component of the spindle assembly checkpoint (SAC) and responds to mitotic defects prior to plk1 and aurks. The binding of bubR1 to cdc20/Fizzy/s1p1, a co-activator of APC/C inactivates APC/C before all the kinetochores have made proper attachment to the spindle [7].
Hsps are differentially expressed during cell cycle [8,9] and function in association with tumor suppressor proteins such as p53 to regulate cell cycle [10,11]. The cancer chaperone, Hsp90 role in cell cycle regulation of normal cells appeared to be limited [8] compared to tumor cells [12]. After analyzing the cancer kinome, oncogenic signaling pathways including cell cycle dependent kinases (cdks) are identified as signatures of cancer [13]. Following that Hsp90 is identified as the major chaperone involved in the functions of several oncogenic kinases including cdks, pharmacological targeting of Hsp90 has emerged as a novel antitumor strategy [14,15]. Since mitotic kinases play significant role in cancer progression, Hsp90 involvement in mitotic control through checkpoint kinases require further studies.
Colcemid is a less toxic analogue of colchicine and commonly used anticancer agent that interferes with microtubule polymerization [16,17]. Colcemid fails to distinguish between normal cells from tumor cells, therefore, act against both the cells [18]. Geldanamycin (GA) belongs to benzoquinone ansamycin class of antibiotics that specifically binds to the N-terminal ATP-binding site of cancer chaperone, Hsp90 and interferes with its chaperone activity [19-21]. Therefore, compared to colcemid, GA reportedly exhibits tumor selectivity.
In this study, we demonstrate that colcemid combination treatment with GA result in enhanced cytotoxicity compared to individual treatments followed by mitotic arrest. The mitotic arrest further correlates with sustained nuclear accumulation of bubR1 kinase and metaphase block. A decreased response to G2/M cell cycle arrest by GA on bubR1 knockdown suggests Hsp90 involvement in the quality control of bubR1. Our findings display hidden dimensions of Hsp90 inhibitors in cancer treatment.
2. Materials and Methods
2.1. Cell Cultures and Drug Treatments
Human neuroblastoma (IMR-32), human cervical cancer (HeLa), and human lens epithelial (SRA01) cells were procured from American Type Culture Collection (ATCC) resource and grown in DMEM (Dulbecco’s Modified Essential Medium) containing 10% FBS (Fetal Bovine Serum) in the presence of penicillin (100 U/ml) and streptomycin (50 μg/ml) at 37˚C in a humidified incubator with 5% CO2 supply. Cells (2 × 10⁵) were grown in a 6-well culture dish (TPP, Switzerland) on 22 × 22 mm cover glasses (Fisher Scientific, USA) were treated with different drugs. The stock solutions of GA, colcemid and MG132 were prepared in dimethyl sulfoxide (DMSO) and the stock solution of LiCl was prepared in sterile double distilled water.
2.2. MTT-Cytotoxicity Assay
Cells (1 × 10⁴) were grown in a 96-well plate (TPP, Switzerland), treated with colcemid or GA or their combination for 24 h. At the end of each time interval, 20 µl of MTT solution (5 mg/ml) was added to each well and incubated at culture conditions for 3 h. The MTT crystals in each well were solubilized with 200 µl of DMSO, and the absorbance was measured at 560 and 670 nm.
2.3. Fluorescence Activated Cell Sorting (FACS)
Cells scraped into phosphate buffer saline (PBS, pH 7.4) were collected by centrifugation at 4000 rpm for 5 min at room temperature and fixed using 70% ethanol for 2 h. Cells were stained with 50 μg/ml propidium iodide (PI) containing 5 μg RNase A for 30 min in dark at room temperature. Acquisition was performed using FACS (FACSCalibur, Becton Dickenson, USA) using FL2 parameter, and data analyzed using Cell-Quest Pro v5.2 software.
2.4. Analysis of Cell Nuclei
Nuclear staining was performed with DAPI (1 μg/ml) after fixing cells in 4% paraformaldehyde for 15 min and permeabilizing with 0.2% Triton X-100 in PBS (140 mM NaCl, 2.7 mM KCl, 10 mM Na2HPO4 and 1.8 mM K2HPO4, pH 7.3) for 10 min and observed under the microscope (Axiovert 200 microscope (20× magnification; Carl Zeiss; Germany) attached to a 35 mm CCD camera.
2.5. RNA Isolation and Reverse Transcriptase Polymerase Chain Reaction (RT-PCR)
Total RNA was isolated by TRIzol (Sigma-Aldrich, USA) and the concentration was estimated using nanodrop 2000 (Thermo Scientific, USA) and RNA quality assessed by running on agarose gel. First strand cDNA was prepared from 1 μg total RNA in a reaction mixture provided in the cDNA synthesis kit (Invitrogen, USA). To check bubR1 expression using PCR, the following primers were used. Forward primer, 5’-TCTGGGGCTTGGGGAGTCA-3’ and reverse primer, 5’-GGGGTTGGCAGGCTTTTGG-3’. The PCR reaction was performed for GAPDH with the following primers, forward: 5’-TGAAGGTCGGTGTGAACGGATTTG-3’, reverse: 5’-TGATGGCATGGACTGTGGTCATGA-3’ (NCBI accession, NM_002046).
2.6. siRNA Design and Transfection
The siRNA for bubR1 (Accession No: NM_001211.5) was designed using BLOCK-iTTM RNAi Designer software from Life Technologies, Invitrogen. The custom synthesized bubR1 siRNA (3 nos) are, Oligo-1: 5’-GCAGAGAAGAGAGCAGAAA-3’, Oligo-2:, 5’-GCCTCTGCAGAGTTGTGTA-3’, Oligo-3: 5’-GCTTGCAGCAAGAAATGAAT-3’. Each bubR1 siRNA (2 μg/well) in a 12-well Nunc plate was used for transfection into IMR-32 cells using lipofectamine LTX plus reagent (Invitrogen, USA) as per manufacturer’s instructions.
2.7. Immunoblot Analysis
Cells washed with PBS were scraped into HEPES lysis buffer (10 mM HEPES pH 7.4, 10 mM NaCl, 0.1 mM EDTA, 0.1 mM EGTA, 0.1% Triton X-100, 0.1 mM DTT and 1× protease inhibitor cocktail). After incubation at 4˚C for 1 h with gentle agitation, cell extracts were clarified by centrifugation at 13000 rpm for 20 min at 4˚C (Eppendorf Table Top Centrifuge 5417R). Protein concentration was determined using Bradford reagent (BioRad, USA), 20 μg total cell lysate was run on 8% SDS-PAGE and transferred onto nitrocellulose membrane (Amersham Biosciences, USA). Antibodies, Hsp90α/β (SC-7947), Hsp90a (SC-8262), Hsp90β (SC-1057), bubR1 (SC-16195), phosphorylated GSK-3β (SC-33039), GSK3β (SC-7291), cdk1 (SC-747), cdk2 (SC-163), cdk6 (SC- 7180), PCNA (SC-7907), p53 (SC-6243), cyclin B (SC- 752), ERK1 (SC-93), ERK2 (SC-154), phosphorylated ERK1/2 (SC-101760), grp94 (SC-11402), cyclin D1 (SC-8396), and GAPDH (SC-25778) were purchased from Santa Cruz Biotechnology Inc. (USA). Antibodies to β-catenin (Cat No. 610154) were purchased from BD Transduction Laboratories (USA). Immunodetection was performed using horseradish peroxidase (HRPO) conjugated goat antimouse (SC-2005), goat antirabbit (SC- 2030), rabbit antigoat (SC-2922) IgG antibodies (Santa Cruz, USA), and the luminescence was detected by Roche chemiluminescence detection kit (Roche, USA).
2.8. Laser Scanning Confocal Imaging Microscopy
Cells were first fixed in 4% paraformaldehyde for 10 min, permeabilized with 0.2% Triton X-100 for 5 min, blocked with 2% BSA for 1 h. Cells were then incubated with primary antibodies, bubR1 (1:100 dilution in blocking buffer), aurk1, aurk2, plk1 and pericentrin (1:200 dilution in blocking buffer) for 1 h and subsequently incubated either with FITC conjugated IgG secondary antibodies. Nucleus was stained with DAPI (4’,6-diamidino- 2-phenylindole; 50 nM, VECTASHIELD, Vector Labs, USA) and cover glasses were sealed to glass slides and observed under the laser scanning confocal imaging microscope (100× magnification, Leica TCS SP5).
2.9. Data Analysis
Data shown are mean ± SD of three independent experiments. Statistical significance was calculated by student’s t-test. Significance values represented are, *, p < 0.05; **, p < 0.01; ***, p < 0.001.
3. Results
3.1. Colcemid and GA Combination Treatment Induces G2/M Cell Cycle Arrest in Tumor Cells, but not in Non-tumor Cells
To examine the effect of colcemid and GA on IMR-32, HeLa, and SRA01, cells were treated with different concentrations of colcemid (2.0, 4.0, 8.0, 10.0, 15.0, and 20.0 μM) and GA (0.5, 1.0, 2.0, 4.0, 6.0, and 8.0 μM) for 24 h and analyzed for cytotoxicity. There was a concentration dependent increase in dead cells with colcemid treatment in all the three cell types examined. However, GA treatment induced cytotoxicity was observed in a dose-dependent manner in IMR-32 (Figure 1(a)) and HeLa (Figure 1(b)) cells compared to SRA01 (Figure 1(c)) cells. Since the objective of the study is to sensitize tumor cells to low concentrations of drugs in combination, colcemid and GA at concentrations 10.0 μM and 2.0 μM were chosen respectively.
First, we examined the combination effect of drugs on cell cycle in comparison to individual treatments against IMR-32, HeLa, and SRA01 cells in a 24 h treatment. In IMR-32, the combination treatment has resulted in the accumulation of 67.4% (p < 0.001) G2/M cells while colcemid and GA treatments showed 71% (p < 0.001) and 44.8 (p < 0.01) G2/M cells respectively (Figure 1(d)). In HeLa, the combination treatment has resulted in the accumulation of 70% (p < 0.001) G2/M cells while colcemid and GA treatments showed 46% (p < 0.001) and 34% (p < 0.001) G2/M cells respectively (Figure 1(e)). In SRA01, the combination treatment did not show any significant effect on cell cycle, especially in comparison with IMR-32 and HeLa cells (Figure 1(f)). Consistently, both IMR-32 and HeLa exhibited similar response to the combination drug treatment.
3.2. Colcemid and GA Combination Treatment Induces Cytotoxicity in Tumor Cells on Prolonged Treatment
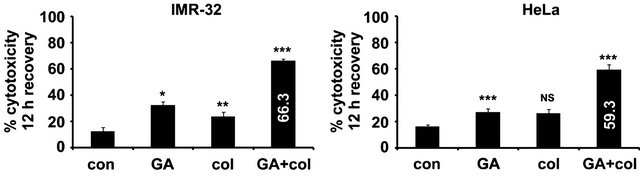
To examine whether combination treatment promote cytotoxicity on a prolonged treatment, tumor cells were continuously treated for 72 h and the percent cytotoxicity was measured. In IMR-32, prolonged treatment has increased the cytotoxicity both with colcemid (44.9%, p < 0.01) and GA (53.5%, p < 0.01), which is 34.9% and 48.5% increase respectively compared to 24 h treatment. In HeLa also prolonged treatment increased the cytotoxicity with colcemid (30%, p < 0.01) and GA (49%, p < 0.01), which is 20% and 29% increase respectively compared to 24 h treatment. Interestingly, the combination treatment showed enhanced cytotoxicity in IMR-32 (85%, p < 0.001) and HeLa (67.7%, p < 0.001) cells, which is 75% and 57% respectively compared to their 24 h treatments (Figure 2(a)). Since some of the chemotherapeutic drugs show reversible effects after their withdrawal, we examined the cytotoxic effects of drugs after 24 h treatments followed by 24 h recovery without any treatment. In IMR-32, we observed increased cytotoxicity with colcemid (24%, NS) and with GA (32.7%, p < 0.05), which is 19% and 22.7% increase respectively compared to 24 h treatment. In HeLa also we observed increased cytotoxicity
 (a)
(a)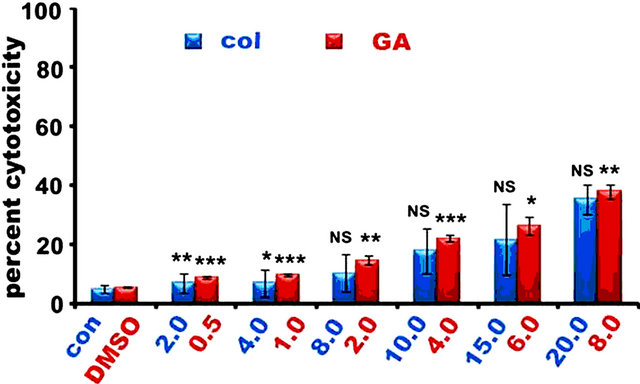 (b)
(b)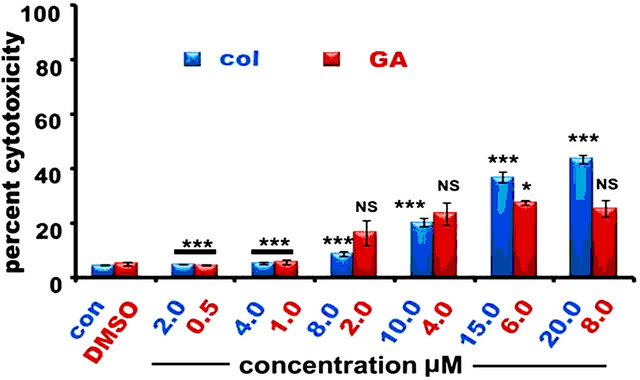 (c)
(c)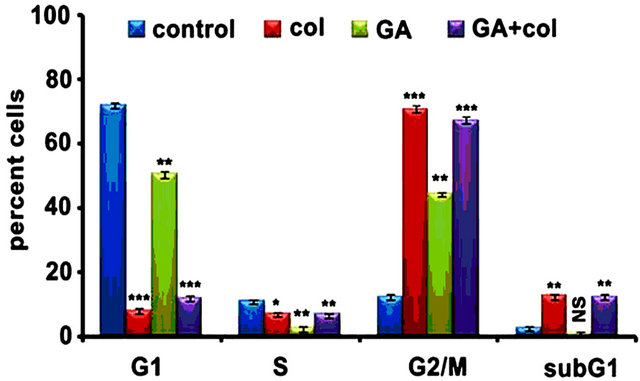 (d)
(d)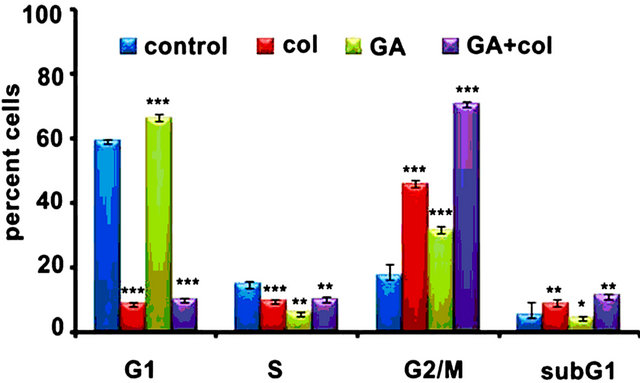 (e)
(e)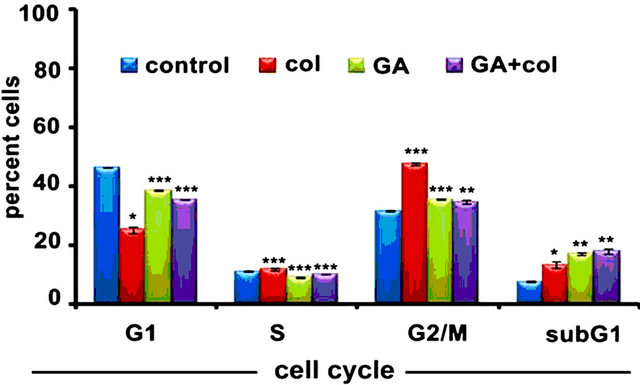 (f)
(f)
Figure 1. The colcemid and GA treatments induce mitotic arrest in tumor cells, but not in non-tumor cells. (a) Cells treated with 2.0, 4.0, 8.0, 10.0, 15.0, 20.0 μM concentrations of colcemid or 0.5, 1.0, 2.0, 4.0, 6.0, and 8.0 μM concentrations of GA for 24 h were analyzed for cytotoxicity. The control (con) and DMSO treated cells were used for the calculation of significance values from the drug treated cells; (b) Cells treated with colcemid, GA or their combinations for 24 h were analyzed by FACS for cell cycle stages. SubG1, indicate dead cell population, G1, S, and G2/M, indicate cells in different phases of cell cycle. Y-axis represents percent cells and X-axis represents phase of cell cycle. The values represented in (a) and (b) are mean ± SD from three independent experiments. Significance values represented are, *p < 0.05; **p < 0.01, ***p < 0.001.
with colcemid (26%, p < 0.01) and with GA (27%, p < 0.05), which is 16% and 22% increase respectively compared to 24 h treatment. To our surprise, we observed significant increase in cytotoxicity in the combination treatment for IMR-32 (59.33%, p < 0.001) and HeLa (66.3%, p < 0.001) cells, which is 49% and 56% increase respectively in comparison with 24 treatment (Figure 2(b)). These results suggest that tumor cells exhibit atypical response to the combination treatment. Although both IMR-32 and HeLa cells showed similar response to the combination treatments, after observing enhanced cytotoxicity in IMR-32 (85%) compared to HeLa (67.7%) on prolonged treatments, subsequent experiments were performed using IMR-32 cells.
 (a)
(a)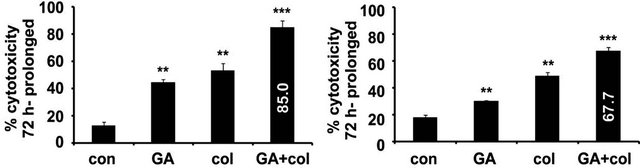 (b)
(b)
Figure 2. The colcemid and GA combination treatments exhibit a typical response in IMR-32 and HeLa cells. (a) Cells treated with colcemid, GA, or their combinations for 12 h were replaced with fresh medium without drugs, maintained under normal growth conditions for 12 h and analyzed for cytotoxicity. The control (con) cells were used for the calculation of significance values from the drug treated cells. (b) Cells treated with colcemid, GA, or their combinations for 72 h were analyzed for cytotoxicity. The control (con) cells were used for the calculation of significance values from the drug treated cells. The values represented in (a) and (b) are mean ± SD from three independent experiments. Significance values represented are, *p < 0.05; **p < 0.01, ***p < 0.001.
3.3. Combination Treatment Increases bubR1 kinase Levels in Tumor Cells
To examine whether the combination treatment interferes with biochemical pathways, cell lysates from IMR-32 cells after 24 h treatment were subjected to immunoblot analysis with antibodies to proliferative enzymes and cell cycle regulators. The combination treatment resulted in decreasing the levels of PCNA and cyclin E. Increased p53 levels correlating with decreased cyclin E and cdk1, cdk2, and cdk6, and their upstream kinase ERK1/2 activation suggest severed cell cycle machinery, especially the mitotic machinery. Concurrently, we observed a significant increase in the APC/C inhibitor kinase, bubR1. Individual drugs although showed varied biochemical response, the effect induced by the combination treatment was apparently significant suggesting severed cell mitosis. Further, decreased procaspase-3 levels in the combination treatment suggest mitotic damage lead to cell death activation (Figure 3(a)). These results were in agreement with G2/M cell cycle arrest in 24 treatment (Figure 1) and enhanced cytotoxicity in a 72 h treatment (Figure 2). Next, we examined for bubR1 expression in SRA01 cells and compared with HeLa cells. While a moderate, but significant increase in bubR1 levels was observed in HeLa cells in response to the combination treatment, SRA01 cells did not show any bubR1 expression (Figure 3(b)) suggesting tumor selective effects of combination treatment. After observing increased levels of p53 protein in our immunoblot experiments, we want to examine whether p53 increase relate to increased transcription. Also to examine whether increased p53 levels correlate with p21 transcription, RT-PCR analysis was performed in control and drugs treated cells. Although there is a complete decrease in p53 transcription in the GA and colcemid treatments, but not on recovery, combination treatment showed significant increase in its induced transcription. The increased p53 transcription, however, did not correlate with increased p21 levels suggesting its unconventional role in the combination treatment (Figrue 3(c)).
3.4. Combination Treatment Increases Nuclear Accumulation of bubR1 in Tumor Cells
Since bubR1 nuclear location decides the metaphase progression [22], its localization in 24 h combination treated IMR-32 cells were examined by immunofluorescence analysis. While individual drug treatments, colcemid and GA showed lack of bubR1 nuclear localization, the combination treatment showed significant increase in its nuclear localization (Figure 4(a)). The increase in bubR1 nuclear localization therefore suggests its possible interference in mitosis progression. Analysis of DAPI stained IMR-32 cell nuclei after 48 h colcemid, GA, and combination treatments showed defects in mitotic progression compared to control cells. The colcemid treatment showed unsuccessful metaphase to anaphase transition, which may be due to its anti-tubulin effects affecting the spindle assembly. Colcemid treated cells prevailed over mitotic arrest however, resulted in unequal segregation of sister chromatids in the anaphase and telophase transition of mitosis. GA treatment showed prolonged metaphase arrest suggesting delayed or inhibited metaphase to anaphase transition. Interestingly, the combination treatment showed loss of chromosomal architecture, which may be due to prolonged metaphase block by the GA, and thus, relate to the enhanced nuclear bubR1 levels (Figure 4(b)).

Figure 3. Colcemid and GA combination treatments, but not individual treatments induce cell cycle deregulation. (a) IMR-32 cells were treated with colcemid, GA, and their combination for 24 h. Cells after 12 treatments were subjected to recovery for 12 h without any drug were represented as col-R and GA-R. GAPDH is used as a loading control. The values under each band represent the arbitrary units measured using imageJ software. (b) HeLa and SRA01 cells treated with colcemid, GA, and in combination for 24 h. GAPDH is used as a loading control. The numbers mentioned under the each band represent the ratio of expression analyzed in image J software after normalizing the values for GAPDH expression. (c) IMR-32 cells were treated with GA, GA treatment followed by recovery (GA-R), colcemid (col), colcemid treatment followed by recovery (col-R), and the combination as explained in materials and methods. Total RNA was isolated, reverse transcribed to prepare cDNA and subjected to polymerase chain reaction (PCR) using specific primers to p53, p21, and GAPDH.
Figure 4. Colcemid and GA combination treatment promote bubR1 stabilization and interfere with metaphase progression. (a) IMR-32 cells after 24 h drug treatments were subjected to cytoimmunofluorescence using anti-bubR1 antibodies. The images were captured at 100× magnification and representation at a scale bar 100 μm. The nucleus was stained with DAPI. (b) Microscopy analysis of the nucleus. IMR-32 cells after 48 h drug treatments were stained with DAPI and analyzed under the microscope. The interphase nucleus represents non-mitotic cell. The images were captured at 100× magnification and representation is at a scale bar 100 μm.
3.5. Nuclear Accumulation of bubR1 is Associated with Mitotic Arrest
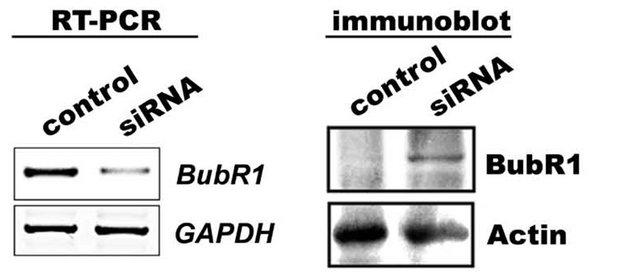
If bubR1 accumulation is considered to be the major cause for defect in metaphase to anaphase transition, siRNA knockdown of bubR1 should decrease G2/M cells. To investigate this, IMR-32 cells after post bubR1 siRNA transient transfection (24 h) were subjected to 24 h combination treatment and examined for bubR1 transcript levels as well as protein levels in RT-PCR and immunoblot analyses respectively. A decrease in bubR1 mRNA transcript has correlated with decreased bubR1 protein levels compared to Figure 3(a) suggest functional siRNA. When siRNA transfected cells were challenged with GA for 24 h, and analyzed in FACS, we observed a 50% decrease in G2/M cells compared to non-transfected controls (Figure 5(b)). These experiments established a correlation between bubR1 stability with functional Hsp90 and suggest Hsp90 involvement in bubR1 quality control. To investigate this correlation, IMR-32 cells were treated with combination drugs with and without MG132 for 24 h and the cell lysates were immunoblotted for bubR1 expression. An increase in bubR1 levels (1.4 folds) upon MG132 co-treatment in comparison to combination treatment suggests Hsp90-dependent proteasome-mediated degradation of bubR1.
3.6. Combination Treatment Compromises the Activation of Non-canonical wnt Signaling
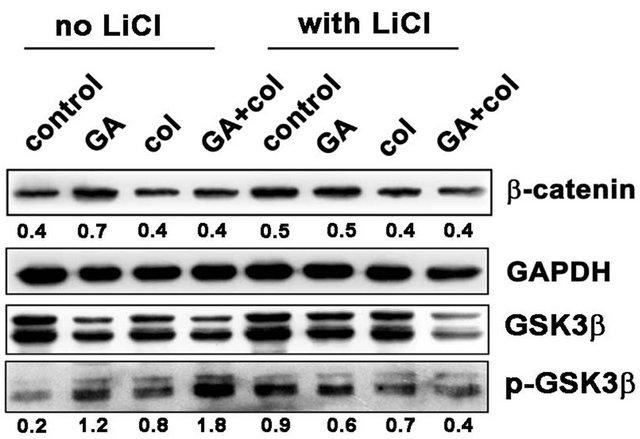
Malignant cells may activate the canonical pathway through gain-of-function mutations in β-catenin [23] or by noncanonical pathway through Wnt/receptor signaling [24]. Since β-catenin stable expression induces G2/M arrest that can stimulate cells to apoptosis [25], we have examined for β-catenin expression and its upstream regulator GSK3β activities and correlated with the cell proliferative marker cyclin D1. Further, β-catenin is implicated in cancer due to its ability to induce the transcription of c-myc and cyclin D1 [26]. Since β-catenin is present in mitotic cells and localized to centrosomes [27], we examined whether β-catenin expression is influenced by bubR1-mediated mitotic arrest. Primarily, we observed increased β-catenin levels in GA treatment compared to colcemid and its combination treatments (Figure 6(a)). Akt happens to be the primary regulator of GSK3β phosphorylation, where Hsp90 controls Akt activity in tumor cells [28]. As shown in Figure 6(a), LiCl inhibited GSK3β phosphorylation and thereby decreased the accumulation of β-catenin however, only in the combination treatment. Since β-catenin expression correlates with cyclin D1, we examined for cyclin D1 levels by immunoblot analysis and found a correlation between decreased β-catenin levels with decreased cyclin D1 levels. The inability of MG132 treatment in retaining β-catenin or cyclin D1 in the combination treatment suggested proteasome-independent, but Akt-GSK3β phosphorylation-dependent regulation (Figure 6(b)). These findings suggested that the combination treatment in addition to targeting mitosis, also targets the non-canonical wnt signaling.
 (a)
(a) (b)
(b)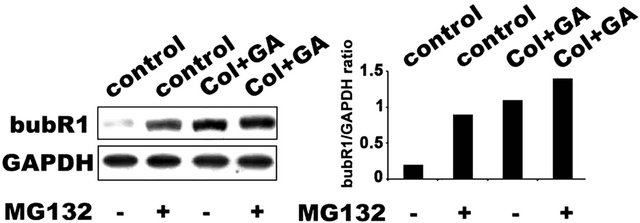 (c)
(c)
Figure 5. The Hsp90-dependent bubR1 kinase stabilization. (a) siRNA knockdown of bubR1 showing decrease in bubR1 mRNA and protein. GAPDH was used as a loading control. (b) IMR-32 cells transfected with bubR1 siRNA were further treated with colcemid, GA or their combination and analyzed by FACS. (c) IMR-32 cells co-treated with MG132 and combination treatment for 24 h were analyzed by bubR1 immunoblot analysis. GAPDH was used as a loading control. (d) Stabilization of bubR1 with Hsp90 inhibition and with proteasome inhibition. The ratio between bubR1 and GAPDH was calculated by ‘image J’ software and represented in the bar diagram.
 (a)
(a)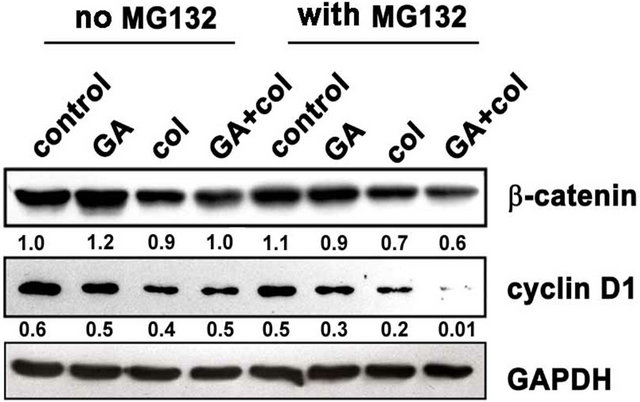 (b)
(b)
Figure 6. Among colcemid, GA, and their combination treatments show compromised non-canonical wnt signaling in the combination treatment. (a) Control and LiCl treated cells were combined with GA, colcemid and their combination treatments for 24 h and cell lysates were analyzed by immunoblot. A decrease in β-catenin in the combination treatment correlating with decreased GSK3β activity; (b) Control and MG132 co-treated cells were combined with combination treatments for 24 h and analyzed by immunoblot. The numbers mentioned under the each band represent the ratio of bubR1 expression analyzed in image J software after normalizing the values for GAPDH expression.
3.7. Prolonged Mitotic Arrest Associated with Defective Mitotic Kinase Functions
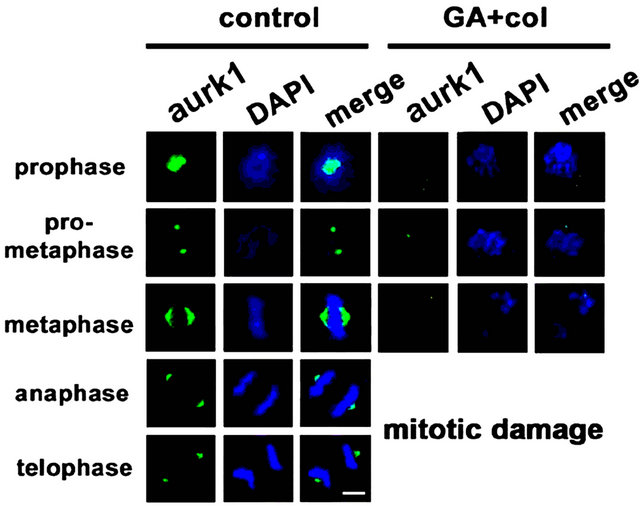
Considering that chromosomal defects can affect the downstream mitotic kinases, we examined the distribution of aurora kinases, aurk1 [29] and aurk2, and pololike kinase, plk1 by cytoimmunofluorescence [30]. The untreated cells showed polar distribution of aurk1 and its association with spindle poles. However, in the treatment, first there is a decrease in aurk1 expression levels, which is associated defective bipolar distribution (Figure 7(a)). In untreated cells, we observed aurk2 localizing to chromosome arms and as the mitosis progresses, it localized to the centromere and midbody. In case of combination treatment, along with a significant decrease in its expression, aurk2 was unable to localize to the centromere and midbody (Figure 7(b)). The plk1 is implicated in mitotic entry and exit, and also in cytokinesis, however, in association with aurk1 and aurk2 [30]. In untreated cells, plk1 is distributed to centromere during mitosis. Its inappropriate distribution in the treatment has correlated with lack of interaction with aurks and defective mitosis (Figure 7(c)). Centrosome is composed of centrioles and pericentriolar material (PCM), where pericentrin is a key component of PCM that acts as a microtubule organization center [31]. Untreated cells showed pericentrin enrichment and alignment with centrosome. In the treatment, both its enrichment and alignment with the centrosome were absent (Figure 7(d)). These experiments suggested that the early defects in metaphase are associated with a decrease, defective distribution, and functions of mitotic kinases.
4. Discussion
Considering that drugs that perturb mitosis [2,3] or central signal transduction [13] are effective anticancer agents, we have used anti-microtubule drug, colcemid combination treatment with Hsp90 inhibitor, GA [20, 32] to target tumor cell mitosis. We demonstrate that GA combination with colcemid interfere with tumor cell mitosis through bubR1 kinase. Although there was no significant cytotoxicity observed in 24 h treatment, a significant increase in G2/M cells was observed. Further, we observed significant metaphase arrest by 48 h and an increase in cytotoxicity on prolonged treatment such as 72 h. An enhancement in the cytotoxicity, especially in the combination treatment in tumor cells suggested tumor selective functions of combination treatment.
Withdrawal of drugs from the culture medium continued to show enhanced cytotoxicity in the combination treatment suggests delayed mitosis resulting in cytotoxicity. The mitosis interfering agents often induce polyploidy through chromosomal mis-segregation, which may be deleterious. However, in the present study, the combination treatment interfered with metaphase to anaphase transition, which is leading to cytotoxicity. By and large, cells that respond to chromosomal aberrations or DNA damage act through p53 by transactivating p21 [33]. Surprisingly, we did not find any correlation between p53 stabilization with p21 transactivation. Increased p53 levels, however, has correlated with decreased cyclin E, cdk1, cdk2, and cdk6, and their upstream kinase ERK1/2 activation suggested severed cell cycle machinery, especially the mitosis. Although endoreduplication is an alternate to enforced replication in the functional compromise of classical cell division [34], which lead to polyploidy [35,36], we did not observe increased nuclear content or polyploidy in our study. Activation of caspase-3 is another indication that these cells are subsequently are subjected to apoptosis.
In the absence of atypical DNA damage response, elevated bubR1 kinase levels suggest altered mitotic index
 (a)
(a)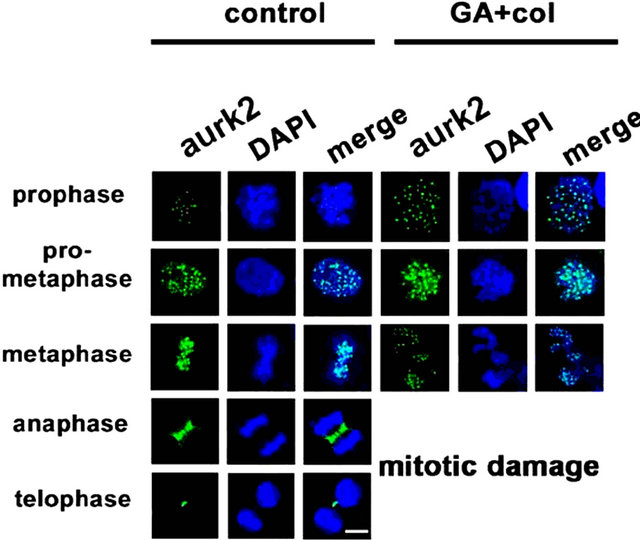 (b)
(b)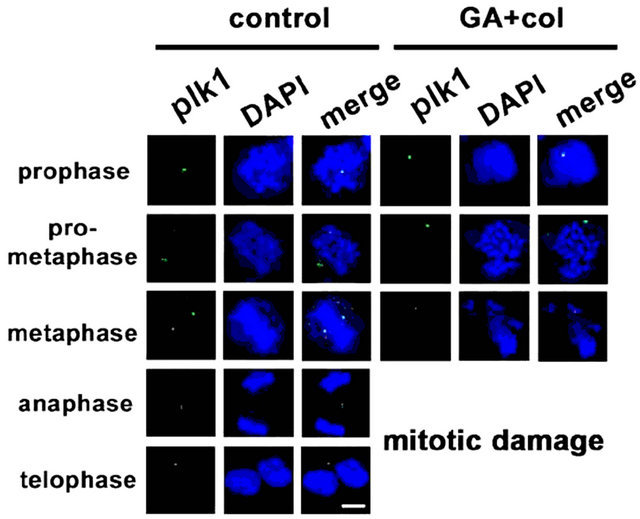 (c)
(c) (d)
(d)
Figure 7. The combination treatment induced mitotic arrest show defects in distribution and functions of mitotic kinases. Control and combination drug treated cells were analyzed for cytoimmunofluorescence using antibodies for (a) aurk1, (b) aurk2, (c) plk1, and (d) pericentrin in different phase of mitosis, prophase, pro-metaphase, metaphase, anaphase, and telophase. The distribution of kinases from untreated cell was compared with combination drug treated cells. The mitotic phases were captured under the laser scanning confocal microscope (100× magnification, scale bar 25 μm).
[4-6]. However, neither of drugs, colcemid nor GA either alone or in combination has elevated DNA damage response through p21. Therefore, it is evident from the data that the DNA segregation defects in association with stabilized bubR1 levels have severed mitotic progression. Lack of bubR1 in non-tumor cells therefore correlating with non-responsiveness to the combination treatment further suggest bubR1 role in the combination treatment response. A decrease in mitotic cells in response to GA in bubR1 siRNA transfection suggests Hsp90-dependent quality control of bubR1 in tumor cells. Hsp90 is involved in the proteasomal degradation of some clients that do not have survival advantage [37]. The Hsp90- mediated proteasomal degradation of bubR1 may therefore have survival advantage in tumor cells.
Aberrant regulation of wnt signalling has emerged as a rampant premise in cancer biology; however, except with GSK3β that controls β-catenin expression, Hsp90 interaction with other wnt signal regulators is not known [38]. Cancer stem cells (CSCs) may use wnt signaling pathways to evade pharmacological targeting since β-catenin stable expression induces G2/M arrest and apoptosis [25]. Our study with this pathway has provided information on atypical action of combination treatment on tumor cells. Since β-catenin promote re-growth of microtubules at the centrosomes [39], it’s over expression may reverse colcemid induced cellular effects. Since, GA combination has significantly affected the β-catenin expression levels the colcemid combination with GA appears to be more effective. Subsequent studies on other mitotic kinases such as aurks and plk1 along with pericentrin has suggested that prolonged metaphase arrest of cells in the combination treatment has significantly altered the distribution and functions of these downstream mitotic kinases, hence, the combination treatment induced effects are appeared to be irreversible.
In summary, we demonstrated that colcemid combination treatment of tumor cells with GA resulted in enhanced cytotoxicity in IMR-32 and HeLa, but not in non-tumor cells, SRA01. The combination treatments also revealed that the functional compromise of Hsp90 promotes bubR1 stabilization leading to metaphase arrest. Our findings display novel strategies to target mitosis in tumor cells using current cancer therapeutics.
5. Acknowledgments
The work was supported by Council of Scientific and Industrial Research-CSIR, Government of India. The authors thank Dr. K. R. Paithankar for bubR1 siRNA designing.
REFERENCES
- M. Malumbres and M. Barbacid, “Milestones in Cell Division: To Cycle or Not to Cycle: A Critical Decision in Cancer,” Nature Reviews in Cancer, Vol. 1, No. 3, 2001, pp. 222-231. doi:10.1038/35106065
- E. Manchado, M. Eguren and M. Malumbres, “The Anaphase-Promoting Complex/Cyclosome (APC/C): CellCycle-Dependent and -Independent Functions,” Biochemical Society Transactions, Vol. 38, No. 1, 2010, pp. 65-71. doi:10.1042/BST0380065
- V. Sudakin and T. J. Yen, “Targeting Mitosis for Anticancer-Therapy,” BioDrugs, Vol. 21, 2007, pp. 225-233.
- H. J. Shin, K. H. Baek and A. H. Jeon, “Dual Roles of Human BubR1, a Mitotic Checkpoint Kinase, in the Monitoring of Chromosomal Instability,” Cancer Cell, Vol. 4, No. 6, 2003, pp 483-497. doi:10.1016/S1535-6108(03)00302-7
- M. Petronczki, P. Lenart and J. M. Peters, “Polo on the Rise—From Mitotic Entry to Cytokinesis with Plk1,” Developmental Cell, Vol. 14, No. 5, 2008, pp. 646-659. doi:10.1016/j.devcel.2008.04.014
- M. Carmena and W. C. Earnshaw, “The Cellular Geography of Aurora Kinases,” Nature Reviews: Molecular Cell Biology, Vol. 4, No. 11, 2003, pp. 842-854. doi:10.1038/nrm1245
- G. K. Chan, S. A. Jablonski, V. Sudakin, et al., “Human BUBR1 is a Mitotic Checkpoint Kinase that Monitors CENP-E Functions at Kinetochores and Binds the Cyclosome/APC,” Journal of Cell Biology, Vol. 146, No. 5, 1999, pp. 941-954. doi:10.1083/jcb.146.5.941
- G. Rice, A. Laszlo, G. Li, et al., “Heat Shock Proteins within the Mammalian Cell Cycle: Relationship to Thermal Sensitivity, Thermal Tolerance, and Cell Cycle Progression,” Journal of Cell Physiology, Vol. 126, No. 2, 1986, pp. 291-297. doi:10.1002/jcp.1041260220
- H. Hang and M. H. Fox, “Expression of Hsp70 Induced in CHO Cells by 45.0 Degrees C hyperthermia Is Cell Cycle Associated and DNA Synthesis Dependent,” Cytometry, Vol. 19, No. 2, 1995, pp. 119-125. doi:10.1002/cyto.990190206
- O. Pinhasi-Kimhi, D. Michalovitz and A. Ben-Zeev, et al., “Specific Interaction between the p53 Cellular Tumour Antigen and Major Heat Shock Proteins,” Nature, Vol. 320, No. 6058, 1986, pp. 182-184. doi:10.1038/320182a0
- M. Nitta, H. Okamura, S. Aizawa, et al., “Heat Shock Induces Transient p53-Dependent Cell Cycle Arrest at G1/S,” Oncogene, Vol. 15, No. 5, 1997, pp. 561-568. doi:10.1038/sj.onc.1201210
- F. Burrows, H. Zhang and A. Kamal, “Hsp90 Activation and Cell Cycle Regulation,” Cell Cycle, Vol. 3, No. 12, 2004, pp. 1530-1536. doi:10.4161/cc.3.12.1277
- A. H. Bild, G. Yao, J. T. Chang, et al., “Oncogenic Pathway Signatures in Human Cancers as a Guide to Targeted Therapies,” Nature, Vol. 439, No. 7074, 2006, pp. 353- 357. doi:10.1038/nature04296
- A. S. Sreedhar, C. Soti and P. Csermely, “Inhibition of Hsp90: A New Strategy for Inhibiting Protein Kinases,” Biochimica et Biophysica Acta (BBA)—Proteins and Proteomics, Vol. 1697, No. 1-2, 2004, pp. 233-242. doi:10.1016/j.bbapap.2003.11.027
- W. B. Pratt and D. O. Toft, “Regulation of Signaling Protein Function and Trafficking by the hsp90/hsp70- Based Chaperone Machinery,” Experimental Biology and Medicine, Vol. 228, No. 2, 2003, pp. 111-133.
- M. A. Jordan and L. Wilson, “Microtubules as Targets for Anticancer Drugs,” Nature Cancer Reviews, Vol. 4, 2004, pp. 253-265. doi:10.1038/nrc1317
- C. L. Rieder and R. E. Palazzo, “Colcemid and the Mitotic Cycle,” Journal of Cell Science, Vol. 102, 1992, pp. 387-392.
- M. N. Jha, J. R. Bamburg and J. S. Bedford, “Cell Cycle Arrest by Colcemid Differs in Human Normal and Tumor Cells,” Cancer Research, Vol. 54, No. 18, 1994, pp. 5011- 5015.
- L. Whitesell, E. G. Mimnaugh, B. De Costa, et al., “Inhibition of Heat Shock Protein HSP90-pp60v-src Heteroprotein Complex Formation by Benzoquinone Ansamycins: Essential Role for Stress Proteins in Oncogenic Transformation,” Proceeding of National Academy of Sciences, USA, Vol. 91, No. 18, 1994, pp. 8324-8828. doi:10.1073/pnas.91.18.8324
- A. Kamal, L. Thao, J. Senintaffear, et al., “A High-Affinity Conformation of Hsp90 Confers Tumour Selectivity on Hsp90 Inhibitors,” Nature, Vol. 425, No. 6956, 2003, pp. 407-410. doi:10.1038/nature01913
- Y. Fukuyo, C. R. Hunt and N. Horikoshi, “Geldanamycin and Its Anti-Cancer Activities,” Cancer Letters, Vol. 290, No. 1, 2010, pp. 24-35. doi:10.1016/j.canlet.2009.07.010
- J. Nilsson, Yekezare M, J. Minshull, et al., “The APC/C Maintains the Spindle Assembly Checkpoint by Targeting Cdc20 for Destruction,” Nature Cell Biology, Vol. 10, No. 12, 2008, pp. 1411-1420. doi:10.1038/ncb1799
- R. H. Giles, J. H. van Es and H. Clevers, “Caught up in a Wnt Storm: Wnt Signaling in Cancer,” Biochimica et Biophysica Acta (BBA)—Reviews on Cancer, Vol. 1653, No. 1, 2003, pp. 1-24. doi.org/10.1016/S0304-419X(03)00005-2
- A. Bafico, G. Liu, L. Goldin L, et al., “An Autocrine Mechanism for Constitutive Wnt Pathway Activation in Human Cancer Cells,” Cancer Cell, Vol. 6, No. 5, 2004, pp. 497-506. doi:10.1016/j.ccr.2004.09.032
- D. Olmeda D, S. Castel, S. Vilaro, et al., “Beta-Catenin Regulation during the Cell Cycle: Implications in G2/M and Apoptosis,” Molecular Biology of Cell, Vol. 14, No. 7, 2003, pp. 2844-2860. doi:10.1091/mbc.E03-01-0865
- P. J. Morin, “Beta-Catenin Signaling and Cancer,” Bioessays, Vol. 21, No.12, 1999, pp. 1021-1030. doi:10.1002/(SICI)1521-1878(199912)22:1
- D. D. Kaplan, T. E. Meigs, P. Kelly, et al., “Identification of a Role for Beta-Catenin in the Establishment of a Bipolar Mitotic Spindle,” Journal of Biological Chemistry, Vol. 279, No. 12, 2004, pp. 10829-10832. doi:10.1074/jbc.C400035200
- A. Taiyab, U. K. Srinivas and A. S. Sreedhar, “17-(Allylamino)-17-Demethoxygeldanamycin Combination with Diferuloylmethane Selectively Targets Mitogen Kinase Pathway in a Human Neuroblastoma Cell Line,” Journal of Cancer Therapy, Vol. 1, No. 4, 2010, pp. 197-204. doi:10.4236/jct.2010.14031
- P. Salaun, Y. Rannou and C. Prigent, “Cdk1, Plks, Auroras, and Neks: The Mitotic Bodyguards,” Advances in Experimental Medicine and Biology, Vol. 617, 2008, pp. 41-56. doi:10.1007/978-0-387-69080-3_4
- N. Hegarat, E. Smith, G. Nayak, et al., “Aurora A and Aurora B jointly coordinate chromosome segregation and anaphase microtubule dynamics,” Journal of Cell Biology, Vol. 195, No. 7, 2011, pp. 1103-1113. doi:10.1083/jcb.201105058
- S. J. Doxey, P. Stein and L. Evans, “Pericentrin, a Highly Conserved Centrosome Protein Involved in Microtubule Organization,” Cell, Vol. 76, No. 4, 1994, pp. 639-650. doi:10.1016/0092-8674(94)90504-5
- R. Bagatell and L. Whitesell, “Altered Hsp90 Function in Cancer: A Unique Therapeutic Opportunity,” Molecular Cancer Therapeutics, Vol. 3, No. 8, 2004, pp. 1021-1030.
- K. F. Macleod, N. Sherry, G. Hannon, et al., “p53-Dependent and Independent Expression of p21 during Cell Growth, Differentiation, and DNA Damage,” Genes & Development, Vol. 9, No. 8, 1995, pp. 935-944. doi:10.1101/gad.9.8.935
- G. Reiterer, L. Chen, R. Tassef, et al., “RAF Associates with Phosphorylated Nuclear BubR1 during Endoreduplication Induced by JAK Inhibition,” Cell Cycle, Vol. 9, No. 16, 2010, pp. 3297-32304.
- B. A. Edgar and T. L. Orr-Weaver, “Endoreplication Cell Cycles: More for Less,” Cell, Vol. 105, No. 3, 2001, pp. 297-306. doi:10.1016/S0092-8674(01)00334-8
- S. Lee, P. Thebault, L. Freschi, et al., “Characterization of Spindle Checkpoint Kinase Mps1 Reveals Domain with Functional and Structural Similarities to Tetratricopeptide Repeat Motifs of Bub1 and BubR1 Checkpoint Kinases,” Journal of Biological Chemistry, Vol. 287, Vol. 8, 2012, pp. 5988-6001. doi:10.1074/jbc.M111.307355
- P. Csermely, T. Schnaider, C. Soti, et al., “The 90-kDa Molecular Chaperone Family: Structure, Function, and Clinical Applications: A Comprehensive Review,” Pharmacology and Therapeutics, Vol. 79, No. 2, 1998, pp. 129-168. doi:10.1016/S0163-7258(98)00013-8
- V. M. Banz, M. Medova, A. Keogh, et al., “Hsp90 Transcriptionally and Post-Translationally Regulates the Expression of NDRG1 and Maintains the Stability of Its Modifying Kinase GSK3beta,” Biochimica et Biophysica Acta (BBA)—Reviews on Cancer, Vol. 1793, No. 10, 2009, pp. 1597-1603. doi:10.1016/j.bbamcr.2009.08.002
- P. Huang, T. Senga and M. Hamaguchi, “A Novel Role of Phospho-Beta-Catenin in Microtubule Regrowth at Centrosome,” Oncogene, Vol. 26, No. 30, 2007, pp. 4357- 4371. doi:10.1038/sj.onc.1210217
Abbreviations
Hsp90: heat shock protein 90;
bubR1: budding uninhibited by benzimidazoles 1 homolog beta;
APC/C: anaphase promoting complex/cyclosome;
GA: geldanamycin;
ERK: extracellular-signal-regulated kinases;
aurk: aurora kinase;
plk: polo-like kinase;
siRNA: small interfering RNA;
GSK3β: glycogen synthase kinase 3 beta.
NOTES
*Authors contributed equally.
#Corresponding author.