Journal of Cancer Therapy
Vol. 3 No. 3 (2012) , Article ID: 19954 , 9 pages DOI:10.4236/jct.2012.33028
Phenylacetylglutaminate and Phenylacetate in Combination Upregulate VDUP1, Cause Cell Cycle Blockade and Apoptosis in U87 Glioblastoma Cells
![]()
1Department Cell and Molecular Biology, Burzynski Research Institute, Stafford, USA; 2Center for Functional Genomics, University at Albany, Rensselaer, USA.
Email: spatil@burzynskiresearch.com
Received March 27th, 2012; revised April 25th, 2012; accepted May 5th, 2012
Keywords: Glioblastoma; VDUP1; Phenylacetylglutaminate; Phenylacetate; Apoptosis; Drug Combination
ABSTRACT
Phenylacetylglutaminate (PG) and Phenylacetate (PN) are metabolites of Phenylbutyrate (PB) and are constituents of antineoplaston AS2-1. These are sodium salts of amino acid derivative and carboxylic acid that inhibit the growth of neoplastic cells without growth inhibitory effect in normal cells. The aim of this study was to identify molecular pathways involved in the anti-proliferative effect of antineoplastons. Using a total human genome microarray we have found that 1) Vitamin D3 upregulated protein (VDUP1) is significantly upregulated in response to PG and PN in the U87 glioblastoma cells; 2) Isobologram analysis shows that PG and PN act in an additive or synergistic manner to effectively suppress proliferation of U87 cells; 3) PG and PN cause cell cycle arrest, changes in expression of several cell cycle genes and suppress expression and activity of the G2/M checkpoint kinase, CHK1. The multiple cellular targets possibly make these compounds effective anti-proliferative agents. We propose that PG and PN in combination target important cellular pathways and upregulate VDUP1 leading to detachment-induced apoptosis in cancer cells.
1. Introduction
Phenylacetylglutaminate (PG) and Phenylacetate (PN) are metabolites of Phenylbutyrate (PB). Both PG and PN are naturally occurring in the human body as a result of metabolism of phenylalanine in the liver and kidneys [1]. The formulation of antineoplaston AS2-1 is a 4:1 mixture of synthetic PN and PG and A10 is a 4:1 mixture of PG and iso-PG. Antineoplastons A10 and AS2-1 have recently been granted FDA orphan drug designation for the treatment of all gliomas. Phase II trials indicate efficacy of antineoplastons in low-grade glioma, brain-stem glioma, high-grade glioma, including glioblastoma multiforme and primitive neuroectodermal tumors adenocarcinoma of the colon, and hepatocellular carcinoma [2,3]. Synthetic antineoplastons A10 and AS2-1 are now candidate drugs for Phase III trials [3]. Application of these two compounds in combination is novel and the molecular targets of PG have not been studied previously. Other studies have shown that PB and PN inhibit proliferation of human medulloblastoma cells [4]. PB is also indicated for the treatment of glioma and acute promyelocytic leukemia [4, 5]. PN has been examined independently in the past by other researchers as a potential anti-tumor agent in the treatment of prostate and thyroid cancer, glioma and hematological malignancies [5-9]. PN has been shown to cross the blood brain barrier [10]. PG on the other hand has been studied as a vehicle for nitrogen excretion in humans [11].
Studies using SKBR-3 breast cancer cells have shown that antineoplaston A10 downregulated expression of PKCa and inhibited cell proliferation due to arrest in G1 phase [12]. Antiproliferative activity of antineoplaston A10 and AS2-1 has also been reported in hepatocellular carcinoma, HepG2 and HLE cells [13,14].
Isobologram studies were introduced in the late 1920s [15,16] and are done to determine synergism, antagonism, or addition of effects of the drugs in combination [17]. An isobole is a graph of equally effective doses pairs for a specific effect level such as inhibitory concentration (IC50) [18].
Vitamin D upregulated protein (VDUP1) is a negative regulator of thioredoxin (Trx) and is also known as Thioredoxin interacting protein (TXNIP) [19]. Trx is an inhibitor of apoptosis and inhibits apoptosis signal regulating kinase-1 (ASK1) [20]. Increased levels of thioredoxin and reduced expression of VDUP1 has been found in many human cancers [19]. Up-regulation of VDUP1 has been shown to inhibit proliferation of tumor cells, identifying it as a novel tumor suppressor [20]. Overexpression of VDUP1 can occur due to various stresses such as serum starvation, H2O2, irradiation, heat shock as well as anti-cancer agents such as SAHA, anisomycin, and 5-fluorouracil [20,21].
It has been speculated that increased activation of DNA damage checkpoint pathways could play a role in the resistance of gliomas to chemoand radiation therapy [22,23]. Hence the search for chemotherapeutic agents that target such checkpoints has been ongoing. The G2/M checkpoint kinases Chk1 and Chk2 play an important role in tumorigenesis and are activated by kinases ATM and ATR [24]. Substrates of Chk1 and Chk2 include Cdc25A, Cdc25C and p53. Agents such as temozolomide cause G2/M arrest and activation of CHK1. This checkpoint activation prolongs the death of tumor cells and makes some cells resistant to treatment with temo-zolomide.
In this study we have attempted to identify the target pathways involved in the anti-proliferative/pro-apoptotic effect of PG and PN in combination. The results presented support the effectiveness of antineoplastons as anti-cancer therapy.
2. Materials and Methods
2.1. Preparation of PG and PN Solutions
Sodium salts of PG and PN were synthesized at Burzynski Research Institute. Stock solutions of these drugs were made in sodium-free MEM. In order to maintain the salt concentration in the medium at physiological levels, the salt from the drug was taken into account during media formulation.
2.2. Cell Culture
All human malignant cell lines were purchased from American Tissue Culture Collection (Rockville, MD). Cells were not used for more than 9 passages (3 months) post-resuscitation (Cell Line Verification Test Recommendations, ATCC Technical Bulletin No. 8 (2008)). U- 373 ATCC HTB-17, U87 ATCC-HTB-14, Daoy ATCC HTB-186, Bt-20 ATCC HTB-19 (F-12302), Hep G2 ATCC HB-8065. For all the experiments, U87 cells were maintained in complete modified Eagle’s medium (CMEM) at 37˚C, > 90% humidity, 5% CO2, for 3 days to allow cells to enter exponential growth phase. U87 cells were then trypsinized and re-plated at a density of 3000 cells/well in 96 well plates or 5000/cm2 in flasks based on each experiment for 3 days. After this period the culture medium was replaced with CMEM containing either 50 mM PG, 10 mM PN or a combination of 50 mMPG + 10mM PN. These concentrations were used in all the experiments.
2.3. Cell Proliferation Study
Cells were treated with PG, iso-PG or PN in concentrations indicated in the dose response curves for 3 days. The cells were washed with phosphate-buffered saline (PBS) and air-dried. Cellular protein was precipitated with 10% TCA in PBS for 1 hour at 4˚C. Plate was then rinsed 5 times with ddH2O and air dried for 2 hours. The dye sulforhodamine B (SRB) was applied at 0.4% for 30 minutes at room temperature. After an additional wash with 1% acetic acid, the plate was air-dried and unbuffered 10 mM Tris, pH 10.5 was added. Optical density was read at 540 nm. The data are shown as fractional survival (f) calculated by dividing the percent survival (optical density) in drug-treated wells by the percent survival (optical density) in the control wells.
2.4. Preparation of Drug Combinations in Fixed Ratios, Plotting of Isobole
A modified fixed ratio method was used to determine in vitro drug interactions in U87 cells [18]. PN and PG are used in combination in the formulation of antineoplaston AS2-1. In cell proliferation studies, we found that PN was 5 times more potent than PG. This potency ratio was used in combining both the drugs for isobologram studies. A series of dilutions of each drug were prepared so that the IC50 fell near the midpoint of the series. The highest concentrations of PG or PN were used to prepare fixed-ratio stock solutions at ratios of 5:0, 4:1, 3:2, 1:4 and 0:5. These solutions were then serially diluted in two-fold dilutions. Cells were treated for 3 days as described above. Cell proliferation was determined as above by SRB method. For each agent the ratio of 5:0 and 0:5 acted as single-agent (PG or PN) independent of the other and was used to plot dose response curves to obtain the individual IC50 by linear regression analysis each time the experiment was repeated. Solutions at ratios 4:1, 3:2, 2:3 and 1:4 gave dose response curves to find the IC50 of the drugs in combination. The IC50 of PG or PN was plotted on the horizontal and vertical axes and the line of additivity or isobole wasw drawn connecting the two IC50 levels. The experimental combinations of PG with PN were then analyzed in the same way to give the combination that caused isoeffect (IC50). This isoeffect value of the combination was plotted on the isobole. The combination of PG with PN was considered synergistic if the IC50 was plotted below; it was additive if plotted on, and antagonistic if plotted above the isobole.
2.5. Microarray Study
U87 cells were treated as before for 3 days with PG, PN or the combination. Total RNA was isolated from the cells in Trizol (Ambion) using standard protocols followed by RNeasy cleanup step (Qiagen). Biotin-labeled cRNA was synthesized from total RNA using standard procedures and was hybridized to the Affymetrix Human Genome U133 plus 2.0 arrays. Further quantitative data analysis to identify changes in gene expression patterns was done using GeneSpring v7.3 (Agilent). Briefly, the CEL files were normalized using MAS5 before being subjected to one way ANOVA (P < 0.05) and a Benjamini Hochberg False Discovery rate correction. The genes that were found to be statistically different were then filtered to create a list of genes differentially expressed at a 2- fold or greater level between controls and treated. These differentially expressed genes were subjected to functional cluster analysis using MAPPFinder in conjunction with GenMAPP (Gene Microarray Pathway Profiler) 2.0 and DAVID software.
2.6. Western Blot
After a 3 day treatment with PG, or PN, or the combination, floater cells were combined with the adherent cells that were collected by trypsinization. Cells were lysed in lysis buffer (20 mM Hepes pH 7.9, 100 mM KCl, 300 mM NaCl, 10 mM EDTA, 0.1% Nonidet P-40 plus protein inhibitor cocktail) for 1 - 3 hrs on ice and 20 ug of total protein was resolved on a 8% SDS-PAGE gel and transferred to nitrocellulose membrane. Blots were probed with either rabbit anti-VDUP1 0.1 ug/ml (Zymed laboratories, Invitrogen), anti-p21 0.5 ug/ml (Sigma), anti-p53 1 ug/ml (Sigma), or anti-GAPDH 0.5 ug/ml (Sigma) followed by secondary antibodies conjugated with alkaline phosphatase and developed with Pierce 1-step NBT/BCIP developing reagent. Band intensity was analyzed and quantified by GeneSnap software (Synoptics, Cambridge, UK).
2.7. Caspase Assay
Caspase 3 activity was determined using the colorimetric assay kit (Abcam). U87 cells were treated with PG, PN or the combination for 3 days after which floater and adherent cells were collected and counted. Equal number of cells were lysed in lysis buffer and pre-clarified by centrifugation (10000 × g) for 1min and used as per the kit to quantify Caspase 3 activity.
2.8. Measurement of DNA Synthesis by Thymidine Incorporation
U87 cells in log phase were plated in 96 well plates and the treatment carried out as previously described. The effect of each agent on DNA synthesis was estimated by the measurement of [methyl-3H] thymidine incorporation into TCA precipitable material after 2, 4, 24 and 36 hours. Thymidine was added at a concentration of 1 uCi/ml to the wells for a 2 h duration prior to each time point to avoid thymidine toxicity. Unincorporated [3H] thymidine, was removed by two washes with PBS supplemented with BSA (2 g/l). DNA was precipitated with 5% TCA (w/v) at 4˚C for 30 minutes. The precipitates were washed twice with 95% ethanol and dissolved in 1 ml of NaOH. Total counts were read in a liquid scintillation counter after neutralization with 1 ml of 1 M HCl. The incubations were performed in replicate and the mean values were used for the calculations.
2.9. Flow Cytometry/Apoptosis Assay
Apoptosis was measured using the Annexin V-FITC/ propidium iodide (PI) apoptosis kit (Sigma) according to the manufacturer’s instructions. Flow cytometry was used for detection of the membrane phospholipid, phosphotidylserine by Annexin V staining and for cell viability by PI exclusion. U87 cells were treated with 50 mM PG, 10 mM PN, 50 mM PG + 10 mM PN or cisplatin (Sigma) for 3 days. Adherent cells were trypsinized and pooled with floaters that were collected by centrifugation. The cells were resuspended in Annexin V binding buffer (150 mmol/L NaCl, 18 mmol/L CaCl2, 10 mmol/L HEPES, 5 mmol/L KCl, 1 mmol/L MgCl2). FITC conjugated Annexin V (1 ug/ml) and PI (50 ug/ml) were added to the cells and incubated for 30 minutes at room temperature. Analyses were performed on a FACScan (BD) and the data analyzed using CellQuest software (BD).
2.10. CHK1 Kinase Activity Assay
The K-lisa checkpoint activity kit (Calbiochem) was used as per instructions provided. Cells were treated with, 50 mM PG, 10 mM PN or a combination of 50 mM PG + 10 mM PN as described above. Cell lysate at 1 × 10⁶/ml of lysis buffer was prepared. Briefly the assay is an ELISA based activity assay that uses a biotinylated peptide substrate that is phosphorylated on the fourth serine by CHK1. Biotinylated substrate and cell lysate from U87 cells were incubated in the presence of ATP in wells of Streptavidin-coated 96 well plate. Detection of the phosphorylated substrate is done using the phosphoserine detection antibody followed by HRP-antibody conjugate and color development with TMB substrate. Absorbance was read at dual wavelength 450/540 nm.
2.11. Flow Cytometry for Cell Cycle Study
U87 cells were treated with 50 mM PG, 10 mM PN or the combination of 50 mM PG + 10mM PN for each time point. Cells were trypsinized pelleted by centrifugation, resuspended in 1 ml ice-cold PBS with 2% serum and fixed by adding 4 ml of ice-cold ethanol under gentle vortexing. Fixed cells were collected by centrifugation, resuspended in 1 ml PBS and treated with 20 ug of DNasefree RNase (Sigma) for 30 min at 37˚C. Cells were stained with PI (100 ug/ml) for 10 minutes at room temperature. DNA content was analyzed on a FACScan. Raw data were gated to remove doublets and cellular debris. The cell cycle histograms were analyzed with CellQuest software.
2.12. Statistical Tests
All data were computed as the mean ±SD. The Student ttest was used to determine statistical significance at a criterion of P < 0.05.
3. Results
3.1. PG and PN Show Antiproliferative Effect in Different Cell Lines
All cell lines tested showed sensitivity to both PG and PN at different levels as shown in Figure 1. The IC50 for PG in the brain tumor cell lines was 50 mM for U87 and over 60 mM for U373 and DAOY. However the IC50 for the breast cancer line BT-20 was 55 mM and for HepG2 it
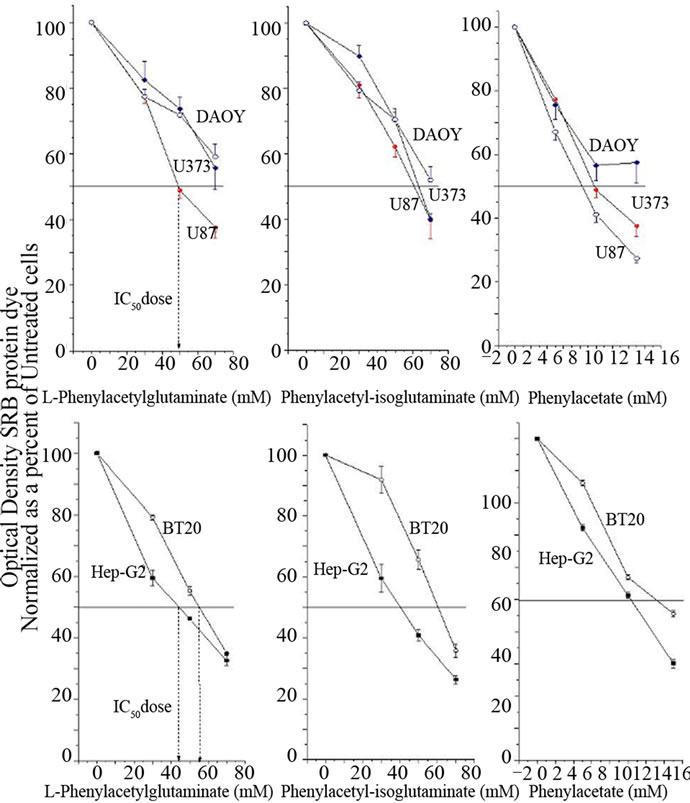
Figure 1. The cell lines, DAOY, U373, U87, BT-20 and Hep-G2 were treated with PG, iso-PG or PN at different concentrations for 3 days. Cell viability was determined by SRB dye. The bars mean ± SD of triplicate experiments compared to control untreated cells. The data is normalized and presented as a percent of control untreated cells.
was 45 mM PN on the other hand showed greater potency than PG with the IC50 falling between 9 mM and 11 mM, except in BT-20 where it was 14 mM. The data are shown as fractional survival, calculated by dividing the percent survival in drug-treated wells by the percent survival in the control well. For the remaining part of the paper we chose to use U87 cells as the model system.
3.2. PG and PN Act in a Synergistic or Additive Manner in Different Ratio Combinations
Isobologram analysis of PG and PN combinations show that the IC50 of the combinations lies below or on the line of additivity or isobole. This indicates that a combination of the two drugs is more effective than each drug used at the same concentration individually. In Figure 2 we have shown that the combination of PG and PN in the ratio 3:2 is additive as the IC50 falls on the isobole and the remaining combination at ratios 1:4, 2:3 and 4:1 are synergistic as the IC50 fall below the isobole.
3.3. Upregulation of VDUP1/TXNIP Protein in Cells Treated with PG and PN
Microarray analysis showed a remarkable up-regulation in the expression of VDUP1/TXNIP mRNA by 32 fold as compared to untreated cells as seen in Table 1. This was confirmed by qPCR (data not shown). Western blot analysis showed an increase in the level of VDUP1 protein in 48 and 72 hour exposure to PG and PN as seen in

Figure 2. Isobologram (solid line) was plotted using the IC50 of PG on the horizontal axis and the IC50 of PN on the vertical axis. The ratios for the combination were 4:1, 3:2, 2:3 and 1:4 to generate the dose response curves and the IC50 for the combinations. The 95% confidence intervals (dotted line) for the isobologram was calculated using the mean IC50 values from the single-agent dose response curves for PG or PN.
Figure 3. The expression of VDUP1 was significantly more enhanced by the treatment with the combination of PG and PN.
3.4. Genes of the Cell Cycle and the Checkpoint Kinase Chk1 Are Suppressed
Table 1 shows a summary of relevant microarray data from a total human genome analysis in U87 cells. Several genes of each phase of the cell cycle were suppressed. This provided some indication of a cell cycle de-regulation in response to PG and PN. The data from the microarray was the basis for the remaining experiments presented in this study. In Figure 4, the activity of the G2/M checkpoint kinase Chk1 was significantly suppressed by the treatment with PG and PN. The activity of the checkpoint kinase Chk2 was not affected (data not shown).

Table 1. Summary of relevant microarray data showing changes in expression of genes in U87 cells treated with the combination 50 mM PG + 10 mM PN for 3 days. For each gene, the expression of the untreated control sample is normalized to 1.0. Genes selected from cells treated with PG + PN, that have normalized data value that are greater or less than those in untreated cells by a factor of 2 fold. Upward arrow indicates genes that are upregulated. The bold-faced changes indicate those that have been confirmed by an independent method.
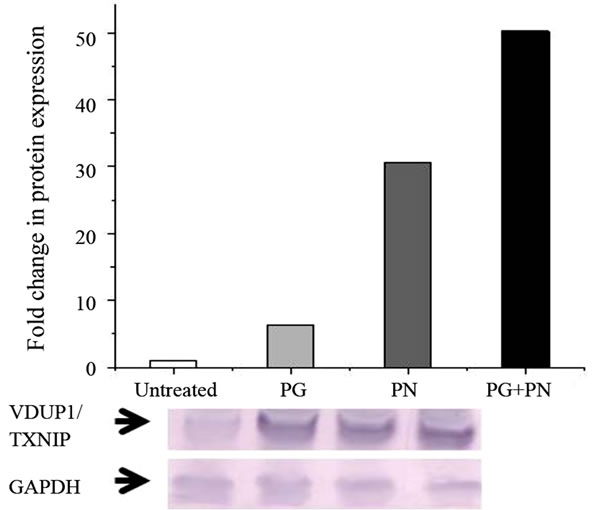
Figure 3. U87 cells treated with 50mM PG, 10 mM PN or the combination of 50 mM PG + 10mM PN for 3 days show an up-regulation in the pro-apoptotic protein VDUP1/ TXNIP as shown by Western blot. Anti-GAPDH antibody was used to show equal loading.
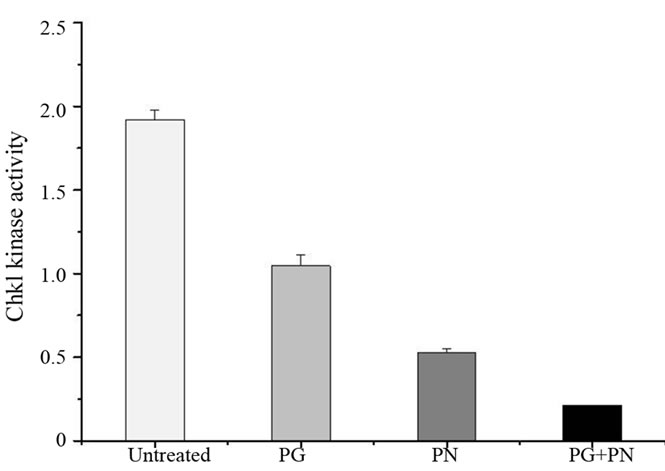
Figure 4. The activity of the G2/M checkpoint kinase was determined in U87 cells using the K-lisa checkpoint assay kit. The combination of 50 mM PG + 10 mM PN for 3 days was most effective in blocking the kinase activity of Chk1 as compared to treatment with 50 mM PG or 10mM PN seperately.
3.5. DNA Synthesis Is Disrupted by PG and PN
Figure 5(a) shows [3H] thymidine incorporation into DNA to understand the mechanism of growth suppression in U87 cells due to PG and PN. Suppression of thymidine incorporation occurred within 2 hours after exposure to PG and PN, indicating a blockade of DNA synthesis. In Figure 5(b), flow-cytometry analysis showed that exposure of U87 cells to PG and PN caused an accumulation of cells in the Go/G1 stage with a concomitant reduction of cells in S and G2/M phases over a period of 72 hours, indicating a blockade G0/G1 stage. Maximum effect was noted in the combination treatment with PG and PN.
 (a)
(a)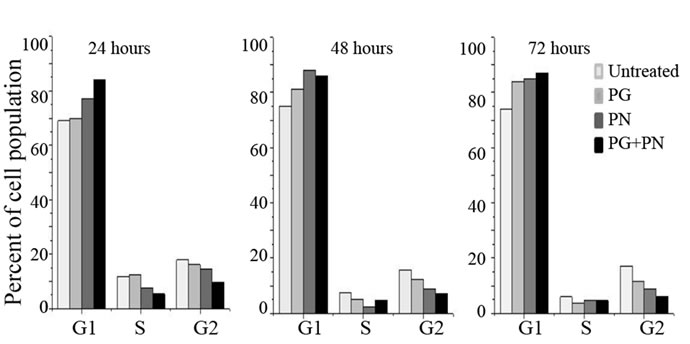 (b)
(b)
Figure 5. U87 cells were treated with 50 mM PG, 10mM PN or 50mM PG + 10 mM PN for 3 days. (a) For the 2 hour treatment the [3H] thymidine was applied in the treatment medium at time zero. For the extended time points, [3H] thymidine was added to the medium 2 hours prior to harvesting. This was done to avoid toxicity due to radiolabeled thymidine. Mean values of replicates are plotted; (b) After 3 day treatment U87 cells were fixed and stained with propidium iodide for flow-cytometry to assess the percentage of the cell population in the G1, S, or G2 phase of the cell cycle stage. An accumulation of cells in G0/G1 is seen in treated cells.
3.6. PG and PN Cause Apoptosis in U87 Cells
Figure 6(a) shows flow cytometry data in U87 cells treated with PG, PN, or both. Here cisplatin, a known inducer of apoptosis was used as a positive control. In Figure 6(b) the synergistic effect of PG and PN in combination as evident from the higher level of Caspase 3 activity induced. In Table 1, an up-regulation in the expression of pro-apoptotic genes TP53 (2.25 fold) and p21 (2.26 fold) was seen. This was confirmed by qPCR (data not shown). Figure 6(c) shows by Western blot that levels of both proteins, p53 and p21 are increased upon treatment with PG and PN.
4. Discussion
Malignant gliomas still remain difficult to treat largely because of the location and complexity of the tumor due to associated genetic mosaicism. Most gliomas arise due
 (a)
(a) (b)
(b)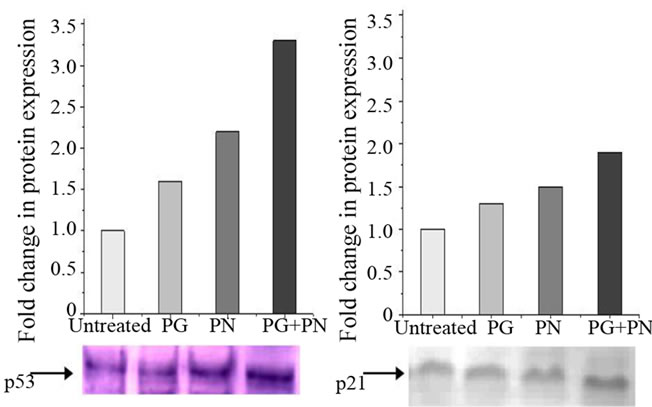 (c)
(c)
Figure 6. Detection of apoptosis in U87 cells treated with 50 mM PG, 10 mM PN or combination 50 mM PG + 10 mM PN for 3 days. (a) Flow-cytometry performed after staining the fixed cells with Annexin V conjugate and Propidium iodide (PI). The upper right quadrant shows late apoptotic cells (AnnxV+/PI+); upper left quadrant shows non-apoptotic dead cells(AnnxV–/PI+) lower right quadrant shows early apoptotic cells (AnnxV+/PI–); lower left quadrant shows viable cells (AnnxV–/PI–); (b) Caspase activity was determined using a colorimetric assay kit. The floater cells were collected by centrifugation and pooled with the adherent cells for the assay; (c) Western blot analysis using anti p53 and anti-p21 antibodies confirms the up-regulation in expression as seen in the microarray data.
to defects or mutations in genes of many different pathways making it almost impossible to develop any targeted therapy. Also the rapid proliferation of tumor cells and the presence of the blood brain barrier make these tumors resistant to many anticancer drugs. Antineoplastons have been used in clinical trials for several years to treat many types of brain tumors. Phenylacetate and Phenylacetate are used in combination in the formulation of antineoplaston AS2-1. In our cell proliferation assays we found that PN was five times more potent than PG. This potency ratio was used in combining both the drugs for isobologram studies. Most of the fixed ratio combinations in our isobologram studies indicate an additive effect while some combinations indicate a synergistic effect. Phenylacetate is a histone deacetylase inhibitor (HDACi) which has been investigated for anticancer properties [25]. Its application is limited to low doses due to toxicity. We show for the first time a synergistic effect of using PG, which is non-toxic, with PN in combination as an effective method to target glioblastoma cells in culture.
The loss of VDUP1/TXNIP expression in many different types of cancers has made it a candidate tumor suppressor gene [22]. It has been shown that VDUP1 is a negative regulator of Thioredoxin (TRX) which is often overexpressed in many different cancers [19]. VDUP1 is necessary for the activity of the tumor suppressor gene PTEN which by inhibiting AKT, plays an important role in blocking proliferation in cancer cells. The present study indicated a strong up-regulation in the expression of VDUP1 mRNA in U87 cells treated with PG and PN. U87 cells have a mutation in the PTEN gene do not express it. In the future, we propose to study the effect of VDUP1 upregulation in PTEN+ brain tumor cell lines to understand this regulation. We have further shown by Western Blot that the VDUP1 protein is also up-regulated.
VDUP1 has been shown to be involved in cell cycle regulation and is upregulated in cell-cycle arrested cells [26]. An interesting finding is that we observed a decrease in DNA synthesis in U87 cells, within 2 hours of exposure to PG and PN. We also observed a steady accumulation of cells in the G1 phase of the cell cycle and a decrease in number of cells in the S and G2 stage. We note a detachment process occurring much earlier, before the onset of apoptosis. This phenomenon of anoikis has been well reported as an early pre-requisite to apoptosis [27,28]. This is the first time that VDUP1 has been identified as a molecular target of PG and PN used in combination. These finding are critical in the understanding of the mechanism of action of antineoplaston AS2-1.
The four known checkpoint kinases in the DNA checkpoint signal transduction are ATM, ATR, CHK1 and
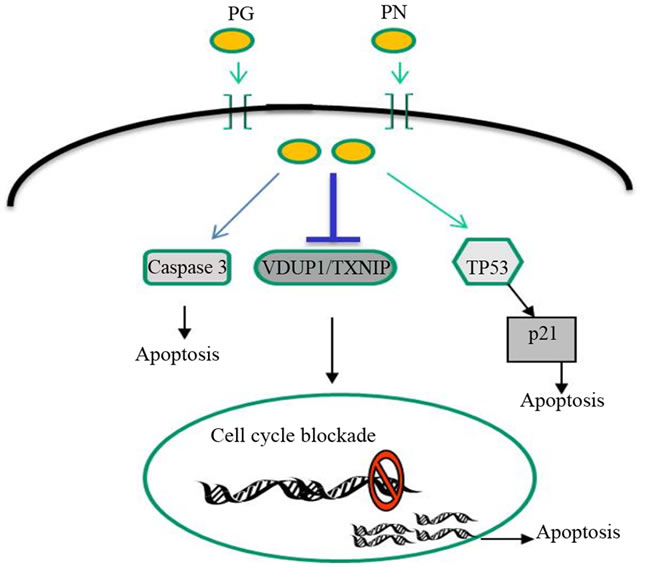
Figure 7. Phenylacetylglutaminate (PG) and phenylacetate (PN) act in combination to upregulate VDUP1/TXNIP. A cell cycle blockade in also initiated along with increase in expression of apoptosis inducers p53 and p21.
CHK2. Among these, CHK1 and CHK2 have been recently identified as potential targets in the search for new cancer therapies [29]. Checkpoints in the cell cycle promote cell survival by allowing the cell time to repair damage. However these checkpoints also cause resistance to cancer treatments that target tumor cell DNA replication. CHK1 is a serine/threonine kinase regulator of the G2/M phase checkpoint [30,31]. It has been shown that activetion of cell death program by direct activation of TP53, depletion of Cdc2 or overexpression of p21 or p16 caused suppression of CHK1 activity. This inhibition of CHK1 was seen to be associated with inefficient G2/M phase checkpoint activation thus further sensitizing the cells to the genotoxic stress [32,33]. Here we have shown that PG and PN significantly upregulated the expression of p53 and p21 as well as suppressed the activity of the CHK1 kinase. Microarray data revealed that PG and PN in combination act by targeting several genes in the cell cycle, including all six genes of the minichromosome maintenance complex. In Figure 7, we propose that PG and PN in combination as in the formulation, antineoplaston AS2-1, target cellular pathways at multiple levels such as the cell cycle, upregulate pro-apoptotic molecules, VDUP1, p53, p21 and induce apoptotic pathways by Caspase activation.
5. Acknowledgements
This study was supported by and carried out at the Burzynski research Institute (BRI), Houston TX, USA. The Microarray assay was supported by BRI and carried out at Center for Functional Genomics, University of Albany, NY, USA.
REFERENCES
- S. C. Piscitelli, A. Thibault, W. D. Figg, A. Tompkins, D. Headlee, R. Lieberman, D. Samid and C. E. Myers, “Disposition of Phenylbutyrate and Its Metabolites, Phenylacetate and Phenylacetylglutamine,” Journal of Clinical Pharmacology , Vol. 35, 1995, pp. 368-373.
- S. R. Burzynski, “Treatments for Astrocytic Tumors in Children: Current and Emerging Strategies,” Paediatr Drugs, Vol. 8, No. 3, 2006, pp. 67-178.
- S. R. Burzynski, “Recent Clinical Trials in Diffuse Intrinsic Brainstem Glioma,” Cancer Therapy, Vol. 5, No. 5, 2007, pp. 379-390.
- X. Li, S. Parikh, Q. Shu, H. Jung, C. Chow, L. Perlaky, et al., “Phenylbutyrate and Phenylacetate Induce Differentiation and Inhibit Proliferation of Human Medulloblastoma Cells,” Clinical Cancer Research, Vol. 10, 2004, pp. 1150-1159. doi:10.1158/1078-0432.CCR-0747-3
- T. Iannitti and B. Palmieri, “Clinical and Experimental Applications of Sodium Phenylbutyrate,” Drugs in Research and Development, Vol. 11, No. 3, 2011, pp. 227- 249.
- D. Samid, W. R. Hudgins, S. Shack, L. Liu, P. Prasanna and C. E. Myers, “Phenylacetate and Phenylbutyrate as Novel, Nontoxic Differentiation Inducers,” Advances in Experimental Medical Biology, Vol. 400, 1997, pp. 501- 505.
- D. Samid, Z. Ram and W. R. Hudgins, et al., “Selective Activity of Phenylacetate against Malignant Gliomas Resemblance to Fetal Brain Damage in Phenylketonuria,” Cancer Research, Vol. 54, No. 4, 1994, pp. 891-895.
- W. R. Hudgins, S. Shack, C. E. Myers and D. Samid, “Cytostatic Activity of Phenylacetate and Derivatives against Tumor Cells; Correlation with Lipophilicity and Inhibition of Protein Prenylation,” Biochemical Pharmacology, Vol. 50, No. 8, 1995, pp. 1273-1279. doi:10.1016/0006-2952(95)02013-3
- A. Thibault, D. Samid and M. R. Cooper, “Phase I Study of Phenylacetate Administered Twice Daily to Patients with Cancer,” Cancer, Vol. 75, No. 12, 1995, pp. 2932- 2938. doi:10.1002/1097-0142(19950615)75:12<2932::AID-CNCR2820751221>3.0.CO;2-P
- M. Sandler, C. R. Ruthven, B. L. Goodwin, A. Lees and G. M. Stern, “Phenylacetic Acid in Human Body Fluids: High Correlation between Plasma and Cerebrospinal Fluid Concentration Values,” Journal of Neurological Neurosurgery and Psychiatry, Vol. 45, No. 4, 1982, pp. 366- 368. doi:10.1136/jnnp.45.4.366
- S. W. Brusilow, “Phenylacetylglutamine May Replace Urea as a Vehicle for Waste Nitrogen Excretion,” Pediatric Research, Vol. 29, No. 2, 1991, pp. 147-150. doi:10.1203/00006450-199102000-00009
- T. Fujii, A. M. Nakamura, G. Yokoyama, M. Yamaguchi, K. Tayama, K. Miwa, et al., “Arrest by Pkc Alpha and MAPK Pathway in SKBR-3 Breast Cancer Cells,” Oncology Reports, Vol. 14, No. 2, pp. 489-494.
- H. Tsuda, A. Iemura, M. Sata, M. Uchida, K. Yamana and H. Hara, “Inhibitory Effect of Antineoplaston A10 and AS2-1 on Human Hepatocellular Carcinoma,” Kurume Medical Journal, Vol. 43, No. 2, 1996, pp. 137-147. doi:10.2739/kurumemedj.43.137
- X.-J. Qu, S.-X. Cui, Z.-G. Tian, X. Li, M.-H. Chen, W.-F. Xu, et al., “Induction of Apoptosis in Human Hepatocellular Carcinoma Cells by Synthetic Antineoplaston A10,” Anticancer Research, Vol. 27, No. 4B, 2007, pp. 2427- 2431.
- S. Loewe and M. Die, “Versuch Einer Allgemeinen Pharmakologie der Arzneikombinationen,” Journal of Molecular Medicine, Vol. 6, No. 23, 1927, pp. 1077-1085. doi:10.1007/BF01890305
- S. Loewe, “Problems on the Practice of the Quantitative Evaluation of Drug Combinations,” Arzneimittelforschung, Vol. 11, 1961, pp. 899-902.
- R. J. Tallarida, “Drug synergism: Its Detection and Applications,” Journal of Pharmacological Experimental Therapy, Vol. 298, No. 3, 2001, pp. 865-872.
- K. Seifert and S. L. Croft, “In Vitro and in Vivo Interactions between Miltefosine and Other Antileishmanial Drugs,” Antimicrobial Agents in Chemotherapy, Vol. 50, No. 1, 2006, pp. 73-79. doi:10.1128/AAC.50.1.73-79.2006
- A. Nishiyama, M. Matsui, S. Iwata, K. Hirota, H. Masutani and H. Nakamura, “Identification of ThioredoxinBinding Protein-2/Vitamin D(3) Upregulated Protein 1 as a Negative Regulator of Thioredoxin Function and Expression,” Journal of Biological Chemistry, Vol. 274, No. 31, 1999, pp. 21645-21650. doi:10.1074/jbc.274.31.21645
- M. Saitoh, H. Nishitoh, M. Fujii, K. Takeda, K. Tobiume, Y. Sawada, et al., “Mammalian Thioredoxin Is a Direct Inhibitor of Apoptosis Signal-Regulating Kinase (ASK) 1,” The EMBO Journal, Vol. 17, No. 9, 1998, pp. 2596- 2606. doi:10.1093/emboj/17.9.2596
- P. A. Marks, “Thioredoxin in Cancer-Role of Histone Deacetylase Inhibitors,” Seminars in Cancer Biology, Vol. 16, No. 6, 2006, pp. 436-443. doi:10.1016/j.semcancer.2006.09.005
- Y. Hirose, M. S. Berger and R. O. Pieper, “Abrogation of the Chk1-Mediated G2 Checkpoint Pathway Potentiates Temozolomide-Induced Toxicity in a P53-Independent Manner in Human Glioblastoma Cells,” Cancer Research, Vol. 61, No. 15, 2001, pp. 5843-5849.
- R. G. Shao, C. X. Cao and Y. Pommier, “Abrogation of Chk1-Mediated S/G2 Checkpoint by UCN-01 Enhances Ara-C-Induced Cytotoxicity in Human Colon Cancer Cells,” Acta Pharmacologica Sinica, Vol. 25, No. 6, 2004, pp. 756-762.
- B. Furnari, N. Rhind and P. Russell, “Cdc25 Mitotic Inducer Targeted by Chk1 DNA Damage Checkpoint Kinase,” Science, Vol. 277, No. 5331, 1997, pp. 1495-1497. doi:10.1126/science.277.5331.1495
- M. Jung, “Inhibitors of Histone Deacetylase as New Anticancer Agents,” Current Medicinal Chemistry, Vol. 8, No. 12, 2001, pp. 1505-1511.
- S. H. Han, J. H. Jeon, H. R. Ju, et al. “VDUP1 Upregulated by TGF-Beta1 and 1,25-Dihydorxyvitamin D3 Inhibits Tumor Cell Growth by Blocking Cell-Cycle Progression,” Oncogene, Vol. 22, No. 26, 2003, pp. 4035- 4046. doi:10.1038/sj.onc.1206610
- A. P. Gilmore, “Anoikis,” Cell Death and Differentiation, Vol. 12, No. 52, 2005, pp. 1473-1477. doi:10.1038/sj.cdd.4401723
- A. J. Valentijn, N. Zouq and A. P. Gilmore, “Anoikis,” Biochemical Society Transactions, Vol. 32, No. 3, 2004, pp. 421-425. doi:10.1042/BST0320421
- B. B. Zhou, H. J. Anderson and M. Roberge, “Targeting DNA Checkpoint Kinases in Cancer Therapy,” Cancer Biology and Therapy, Vol. 2, No. 4, 2003, pp. 16-22.
- Y. Sanchez, C. Wong, R. S. Thoma, R. Richman, Z. Wu, S. Elledge, et al., “Conservation of the Chk1 Checkpoint Pathway in Mammals: Linkage of DNA Damage to Cdk Regulation Through Cdc25,” Science, Vol. 277, No. 5331, 1997, pp. 1497-1501. doi:10.1126/science.277.5331.1497
- Y. Sanchez, J. Bachant, H. Wang, F. Hu, D. Liu, M. Tetzlaff, et al., “Control of the DNA Damage Checkpoint by Chk1 and Rad53 Protein Kinases through Distinct Mechanisms,” Science, Vol. 286, No. 5442, 1999, pp. 1166- 1171. doi:10.1126/science.286.5442.1166
- V. L. Gabai, C. O’Callaghan-Sunol, L. Meng, M. Y. Sherman and J. Yaglom, “Triggering Senescence Programs Suppresses Chk1 Kinase and Sensitizes Cells to Genotoxic Stresses,” Cancer Research, Vol. 68, No. 6, 2008, pp. 1834-1842. doi:10.1158/0008-5472.CAN-07-5656
- Y. Tang, W. Liu, J. Zhou, Q. Gao and J. Wu, “Apoptotic Sensitivity to Irradiation Increased after Transfection of Chk1 Antisense Chain to HL-60 Cell Line,” Journal of Huazhong University of Science and Technology Medical Science, Vol. 25, No. 5, 2005, pp. 513-515. doi:10.1007/BF02896003