Journal of Geographic Information System
Vol.09 No.02(2017), Article ID:75958,15 pages
10.4236/jgis.2017.92009
Study and Analysis of Chennai Flood 2015 Using GIS and Multicriteria Technique
Muthusamy Seenirajan1, Muthusamy Natarajan2, Ramasamy Thangaraj3, Murugesan Bagyaraj4
1Civil Engineering, Excel Engineering College, Namakkal, India
2Civil Engineering, Karpagam University, Coimbatore, India
3Civil Engineering, Nehru Institute of Technology, Coimbatore, India
4Gis Analyst Aadhi Boomi Mining Envirotech pvt. Ltd, Salem, India

Copyright © 2017 by authors and Scientific Research Publishing Inc.
This work is licensed under the Creative Commons Attribution International License (CC BY 4.0).
http://creativecommons.org/licenses/by/4.0/


Received: September 19, 2016; Accepted: April 27, 2017; Published: April 30, 2017
ABSTRACT
Terrain characteristics of the land and meteorological properties of the region are the main natural factors for flood. The recent flood in Chennai was unexpected and not triggered by the above factors. Sometimes floods occur when the watershed size is considerably small which leads to the over flow of water inland may due to the encroachment and the urban development of the city. Temporarily used backwater effects in sewers and local drainage channels and creation of unsanitary conditions may cause flooding. Chennai flood was basically claimed to occur due to improper drainage system and underlying strata which was found to be landfill over the ponds and lakes. The Coouam River which flows through the centre of main city was found silting due to the improper drainage facilities and encroachment by the local peoples who causes flood. For the analysis of potentially affected areas Geographical Information System (GIS) integrated with Multicriteria Decision Analysis (MCDA) were employed. Ranking and displaying the potentially risky areas, the spatial Multicriteria analysis was used. It has been revealed that all most all the area’s having populations are likely to be exposed to flood hazard. At the end of study, a map of flood risk areas was generated and studied with a view to assisting decision makers on the consequences posed by the disaster.
Keywords:
Geographical Information System, Multi-Criteria Decision Analysis, Flood Risk, Flood Potential Map

1. Introduction
South India experienced heavy rains during the month of November and December, 2015 due to the formation of depression over southwest Bay of Bengal and owing to a strong El Niño. Heavy widespread incessant rainfall activity led to waterlogging and flood like condition in parts of Karnataka, coastal Andhra Pradesh and Tamil Nadu. Tamil Nadu was one of the worst affected states where rainfall in all but two of the 34 districts in the state has exceeded the normally observed levels, while five districts have been pounded by over twice the average rainfall received between October and the end of November, 2015. Chennai in particular was one of the worst hit districts in the state which received almost 1200 mm of rain in November, which is nearly 300 per cent above the normal observation of 407.4 mm. While rainfall in the city broke the nearly century-old record for November, the record for the highest rainfall received in a single day in December was also rewritten. On December 1 - 2, 2015, the Indian city of Chennai received more rainfall in 24 hours than it had seen on any day since 1901. The previous record for rainfall in a single day in December dates back to 1901 when the city received 261.6 mm of rainfall in a span of 24 hours. On December 1, 2015, the city received around 290 mm of rain in a single day causing catastrophic flood disaster. The deluge followed a month of persistent monsoon rains that were already well above normal for the Indian state of Tamil Nadu.
Tamil Nadu, especially Chennai city was terribly hit by the flood during November-December 2015 which claimed more than 400 lives and caused enormous damages, both domestically and economically. Mainly the districts nearby the coast of Chennai, Kanchipuram and Tiruvallur were the most affected. This has given a challenge to the scientific community in developing a comprehensive understanding of the event. Floods are probably the most recurring, wide spread, disastrous and frequent natural hazards of the world [1] . There has been a great confusion and many questions were raised in the minds of people due to the immediate havoc caused by the flood in Chennai. The possible causes for the flood have been identified like heavy rainfall, improper drainage system to drain out the runoff water, soil character, watershed of the river etc, In view of potential extreme climate events, we assert that there is an urgent need to have high resolution data in order to deepen research about the risk in the Chennai city [2] .
But the cause for the Chennai flood is quite different than other usual floods. It was found out that Chennai flood was due to the high intensity rainfall caused by the unfavourable atmospheric condition, rainfall distributed spatially and temporally, quantity of flow occurred in the rivers namely Kosasthalaiyar river, Cooum river and Adyar river.
The operation of the two reservoirs in the upstream of the city were the Chembarambakkam reservoir and the Poondi reservoir, The amount of flow generated in the city is due to rainfall over the city alone, manner of the storm water drainage system responds, areas where the city were inundated, change of topographical features in the city over the years exacerbate the flooding. By global warming and due to the environmental changes the seasonal rainfall fails and causes extreme climatical changes results in cyclone effects causes flood.
Flood is one of the common hydrological phenomena which is to a large extent unpredictable and uncontrollable [3] . More than 1/3rd of the world’s land area is flood prone affecting some 82% of the world’s population [4] . As per UNDP [5] approximately 170,000 deaths were associated with floods worldwide between 1980 and 2000 [6] .
1.1. Area Selected for Study
Chennai, capital of Tamil Nadu, one of the south most states of India had been selected for the case study on flood. Basically the two coastal districts of Chennai, namely Kanchipuram and Tiruvallur are badly affected by the November-December 2016 flood. These two districts are located at the northeast part of Chennai city (Figure 1). Kanchipuram’s latitudinal location is between 12˚20'N to 13˚00'N and longitudinal location is 79˚40'E to 80˚20'E. Kanchipuram district occupies the total area of 4433 Sq. km., and Tiruvallur at 80.0088˚E and 13.2544˚N which is located near by the Chennai city. Terrain characteristics of land and meteorological properties were not considered to be the main factors for causing flood disaster in Chennai. There have been tricky and unexpected reasons that caused flood in Chennai. These causes will be discussed in detail
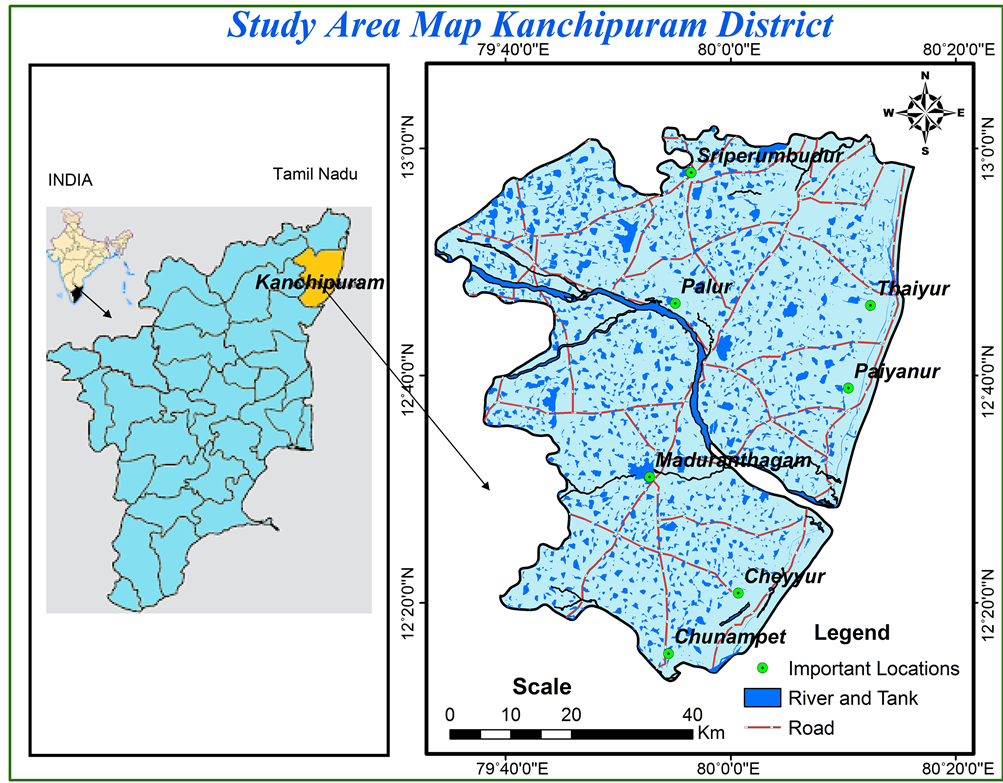
Figure 1. The study area map.
below. The normal temperature of ranges from 26 to 35 celsius in Kanchipuram district and it receives an average rainfall of 1200 mm. Similarly, the average normal rainfall of Tiruvallur district is 1104 mm.
1.2. Materials and Methods
For present work Geo-coded Indian Remote Sensing (Cartosate-1 SRTM) satellite image of April 2005 and topo sheets at 1:50,000 scales collected from Survey of India, used to prepared contour and Drainage Map. Global positioning system (GPS) was used for carrying out field surveys were conducted in Kanchiipuram District flood affected areas. Geological map collected from GSI, Soil map prepared from Soil survey of India and the area rainfall collected in Public Work Department (PWD) Chennai. All the data collect and prepare different thematic map using GIS software finally integrated all maps and give the output for flood hazard zone. The detailed methodology flow chart given in Figure 2.
1.3. Data Source
The principle supporting the data for this study was provided by the NASA which was satellite-based estimation showing rainfall over the south-eastern India on December 1 - 2, accumulating in 30 minutes interval. The integrated Multi-satellite retrievals for GPM (IMERG), a product of Global Precipitation Measurement mission is used to fetch the rainfall precipitation data. On the maps (Figure 3) below represent rainfall total approaching 400 millimetres (16 inches) during the 48 hours period. These are the two regions in Tamil Nadu which received the heaviest rainfall and experienced the maximum damages due to November-December 2015 flood. According to HAL pierce, a scientist on the
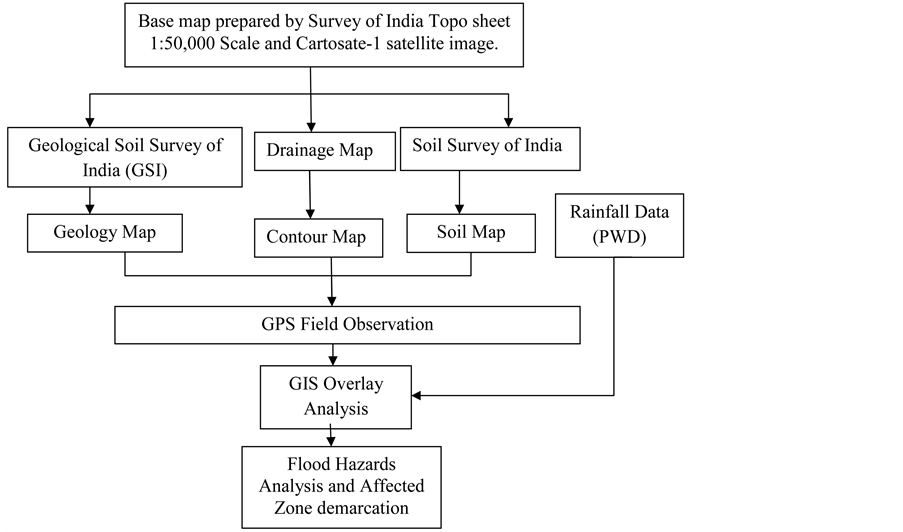
Figure 2. Detailed methodology flow chart.

Figure 3. Accumulated rainfalls between November 29 to December 2 over Chennai (Sources NASA).
GPM team at NASA, areas just off the south-eastern coast received the maximum total rainfall that exceeded 500 mm (20 inches).
1.3.1. Geographical and Meteorological Reasons
Between the month of October and December of each year, an enormous area of south India, including Tamil Nadu, receives up to 30percent of its annual rainfall from the northeast monsoon. The northeast monsoon is due to the annual gradual retreat of monsoonal rains from north-eastern India. Unlike during the northeast monsoon, rainfall during the monsoon is sporadic, but the rainfall during November-December 2015 was typically more than the normal rainfall by 90 percent.
The coastal districts of Andra Pradesh usually bear a burnt of heavy rains that occur during the northeast monsoon along with Puducherry and eastern Tamil Nadu which becomes prone to flooding with numbers of swelling rivers and wetlands. Between the years from 1943 to 2005 Chennai city had experienced five major floods alone causing particularly severe damage in the year of 1943 and 2005. In addition, illegally and unplanned urban development has caused many wetlands and natural sinks being built over artificially. Along with that, poorly designed drainage systems and aging civil infrastructures, has resulted in an increase frequency of flooding.
1.3.2. Annual Rainfall
Chennai receives the average annual rainfall of about 140 cm (55 in). Starting from mid-October to mid-December the city receives the heaviest rainfall from the northeast monsoon winds. Sporadically the city experiences cyclones formed in the Bay of Bengal. The highest annual rainfall recorded is 257 cm (101 in) in 2005. The highest rainfall of 72.4 mm was recorded in Tiruvelveli-Tamil Nadu. Tamil Nadu received an average annual rainfall of 1304.1 mm during the year 2005-06. The rainfall was excess in 26 districts and normal in 4 districts as shown by the rainfall records during 2005 and 2006 as compared to the normal annual rainfall. However, the highest recorded rainfall of 2005-06 in Chennai had been beaten by the recent 2015 flood.
GIS system navigated by the NASA was used to view over the south-eastern part of India, Chennai. According to the record, continuing from Tuesday till Wednesday more quantity of moisture started to accumulate over the region of Chennai. These have a serene for heavy precipitation and high chances of flood.
In our work an automated procedure was used to identify the flood plain extent and to determine its depths. But this automated procedure is different from the mentioned above in the way that water levels are obtained. We do not create a water surface level in a raster format and then compare that water surface level with the DTM to delineate flood plains. Rather, the floodplains are directly delineated from the high-resolution, digital terrain model (DTM), LIDAR 20-ft digital elevation model (DEM) was used as simplified, but practical approach, which was developed based on the actual mechanism of flooding.
1.4. Drainage System
The City is drained by 2 rivers the Adyar and the Cooum Rivers, besides a number of major and minor drains through Buckingham Canal into Sea via Ennore Creek and Kovalam Creek. Cooum runs through the heart of the city whereas Adyar wends its way through the southern part of the city before entering into the sea. Though the river Adyar can be traced to a point near Guduvancheri village, it assumes the appearance of a stream only after it receives the surplus water from the Chembarambakkam tank as wells as the drainage of the areas in the south-west of Chennai. Cooum River starts from Kesavaram Anicut in Kesavaram village built across Kortaliyar River. The surplus from Cooum tank joins this course at about 8 kms. lower down and this point is actually the head of Cooum River which is located at 48 kms. west of Chennai. The drainage map of the study area is shown in Figure 4.
As the water level crossed the normal limits in residential areas of Kanchipuram and Tiruvallur districts, the drainage system measurably failed to pass the water. (Figure 4) shows the drainage system of Chennai.
The drainage system was blocked due to excessive dumping of garbage and as well as the failure of administration to ensure periodic desilting. Hence water couldn’t find way to flow. The failure of drainage system in Chennai and other parts of Tamil Nadu, especially Kanchipuram and Tiruvallur, made the situation

Figure 4. Drainage map of the study area.
worst. Besides that, encroachment was seen on Cooum River, Adyar River and Buckingham Canal, which serves as the main rain water drain for the city. These encroachments were not slump dwellings but concrete directly affecting flow of canal.
In addition to that, the lack of wetland, which acts as a sponge, soaking of rainwater, played vital role in floods. According to a report of leading daily, over 5500 hectares of wetlands in those two districts have been evolved into commercial lands and only 10 percent of the original wetlands remained. Hence, rainwater runoff has nowhere to go and settles instead on to road, causing flooding. This severe flood disaster was caused due to mismanagement and violation of protocols during urban planning.
1.5. Types of Soils
Chennai’s soil is mostly clay, sandstone and shale. Areas found along the coasts and the river banks are sandy in nature and in these areas, run water percolates quickly thoroughly the soil. Few parts of Chennai also comprises hard rock surface. The ground water table in Chennai is 4 - 5 m below the ground surface.
Among many soil test apparatus few have been employed to test the soil in Chennai, especially soil moisture test, triaxial soil testing instruments are the few among many which determined the types of soils available in Chennai. The soil map shown in Figure 5.
1.6. Geology of the Study Area
The geological formations are beach sands of quaternary and recent period, Cuddalore sandstone of Mio-pliocene age, shals and sandstone of Upper Gondwannas and charnockits of Archaean era. The detailed geology information shown in Figure 6.
1.7. Slope and Size of Watershed
There are numbers of watershed in Chennai alone. Some of the well known water shed are Velachery, Adyar, Virugambakkam and few other canals. Watersheds range from 10.5 km to 50.99 km and it bears a slope of 1 in 20 which indicates that if the volume of water rises suddenly in the river basin then there will be high chances of flood occurrence due to overflow.

Figure 5. Soil map of the study area.

Figure 6. Geology map of the study area.
1.8. Spatial Analysis
Rainfall is a continuous phenomenon that affects the whole region, not just the locations of the weather stations. Based on the observed rainfall at the monitoring stations and their locations, we can interpolate and deduce the approximate rainfall across the whole region. We use the Interpolate Points tool from the GIS’s spatial analysis service for this study.
1.8.1. Pair Wise Comparison Method for Chennai Flood
This method is usually used for the comparison of two criteria at a time. Conversion of subjective assessments of relative importance into linear sets of weights is taken into consideration in this method. This method estimates the weight of the following criteria:
C1 = Geology
C2 = Rainfall (precipitation);
C3 = Drainage network;
C4 = Soil type.
The square pair-wise comparison matrix is presented in Table 1. Each factor was weighted according to the estimated significance for the flood potential project which was to generate the criterion values for each evaluation unit. Table 2 shows the normalized matrix. At the same time, the individual observed record, which never agreed perfectly with the degree of consistency achieved in the ratings were randomly generated. The random indices for the matrices are listed in Table 3. According to the rule thumb, CR less than or equal to 0.1 indicates an acceptable reciprocal matrix, whereas a ratio over 0.1 symbolises that the matrix should be revised.

Table 1. Pair wise comparison matrix for flood risk parameters.
Table 2. Normalize matrix.
Table 3. Random indices for matrices of various sizes (n).
2. Result and Discussion
2.1. Multi Criteria Analysis
Applied and integrated with the spatial data, the causative factors of a phenomenon under concern of Multicriteria analysis, is described. In this study, the risky areas were first produced by numerically overlaying soil, drainage network, geology, rainfall layers and size of the watershed. The selection of these criteria was based on the expert’s opinion and availability of data. Boolean overlay was employed to carry out this overlay. Logical operators such as intersection and union combined all criteria for analysis.
In the second phase, ranking method was used, where every criterion under consideration was ranked in the order of the decision maker’s preference. Each factor was weighed according to the estimated significance for causing flooding. Factor of rank 1 is the least important and factor of rank 8 is of the most importance. In the third phase, determination of the weight of each criterion was done by pair wise comparison method which was developed to create flood hazard map.
2.2. Flood Risk Map
Evaluation of each unit based on ranking method was generated using the criterion maps combined by logical operations and criterion values. Figure 7 shows

Figure 7. Flood Hazard map.
the flood risk map created based on GIS and Multicriteria method. Using pair wise comparison the normalized criterion weights were calculated as 0.198, 0.387, 0.275 and 0.14 respectively for basin slope, annual rainfall, drainage network of the river basin and soil type. The study carried out based on this method showed a consistency ratio (CR) value of 0.0, which fell much below the threshold value of 0.1 which indicates a high level of consistency. Therefore, the weights are acceptable.
2.3. Flood Map Validation
The flood potential map which resulted from multi criteria analysis was compared with the original flood map of 2005/2006 obtained from DID in Chennai for the purpose of validation. The original flood potential map (Figure 7) which was classified based on flood vulnerability:
1) 4 for the most prone to flooding;
2) 3 for the moderately prone to flooding;
3) 2 for the least prone to flooding;
All the features which had been designed in grid code values of feature map from the raster pixel values are show in the map below. Correspondingly individual polygon has one grid value (i.e., 1, 2, and 3) based on the cell value at the same location in the raster. This step helped to design four polygon features with each polygon having different flood suitability level. The flood classes which was obtained was converted into external shale file (*.shp) and the external image was compared with the original flood map.
The final extracted flood map which contained the data and features of original and potential flood maps had been analysed and affected villages list out Table 4. The above respective three classes indicate the most prone to flooding area, moderately prone to flooding and least prone to flooding. The final flooding hazard area with village overlay map shown in Figure 7 and Figure 8.
3. Conclusions
From the field experience and also interaction with local population it has been observed that the urbanization and encroachments of river banks, marshy, low-lying areas especially Adyar River has aggravated the flooding problem. The narrow and constrained river with no flood plains left could not carry the discharges and water simply occupied the adjoining low-lying areas.
A study carried out by Chandan et al. (2014) on analysis of land use change pattern in past 4 decades shows that the total urban area has been increased by more than 20 times mainly from the conversion of grazing, agricultural and open areas to urban impervious surface. They have observed that Vegetation cover has dramatically decreased from 70.47% in 1991 to 35.53% in 2013, whereas the non-vegetation i.e. built up, paved areas etc. have increased 29.53% in 1991 to 64.47% in 2013.
Management of reservoirs, revival of wetlands which act as a “sponge” to absorb the excess water and resizing of the storm water drains keeping in account
Table 4. Most affected zones/places by Chennai flood.
the present and projected population should be taken as mitigative measures.
Based on 2015 floods experience flood hazard plain zoning needs to be done for future expansion of the city and assessing the threat to habitation living in various municipal zones for better preparedness.
4. Recommendations
After the flood the sense of fear had entered into the mind of people. This forced the experts and scientists to reason out the causes and factors of the flood. After that the suitable and valid remedies should be fetched. Some of them are recommended below:
1) Better understanding of the weather
It is always better to understand the weather condition in advance and the data collected should be of great accuracy so that there won’t be any havoc created afterwards. By doing so, people can act on the disastrous action easily.
2) Water wiring of cities
Every small water bodies should be taken into consideration along with the large and well known rivers, reservoirs and canals. Only y doing so we would not missed out any small bit of information and thus we could edify the problems.
3) Maintenance of watershed and drainage systems

Figure 8. Flood Hazard map with village overlay.
Watershed should be maintained very well. Although it seems of less important, watershed plays a vital role in controlling the overflow of water. Similarly, drainage system should be checked and kept clear of obstacles. All the channels of drains should be connected properly and the outlet should be properly maintained.
4) Improvements of civil infrastructure and wetlands
Most of the underlying ground soil of Chennai is the refill of ponds and lakes. These soils act as a poor filter for the rainwater. Thus, all the rain water gets collected on the surface which causes floods. This can be avoided by improving the soil permeability and building proper civil infrastructure will allow the water to pass through proper channels.
5) Human activities
One of the factors which contributes to flood or any other natural disasters is human’s selfish activities. Burning of harmful gases and fuels, raising the numbers of industries, clearing the forest cover for constructions purposes etc. have dramatically changed the climatic conditions over the decades. Therefore, human needs to reduce their wants and try to live in harmony using the nature wisely.
Cite this paper
Seenirajan, M., Natarajan, M., Thangaraj, R. and Bagyaraj, M. (2017) Study and Analysis of Chennai Flood 2015 Using GIS and Multicriteria Technique. Journal of Geographic Information System, 9, 126-140. https://doi.org/10.4236/jgis.2017.92009
References
- 1. Sathish, S., Nagendra, H.N. and Ravi, G. (2012) Application of Remote Sensing and GIS for Flood Risk Analysis: A Case Study of Krishna and Tungabadra River Valley. Internal Journal of Social science & Interdisciplinary Research, 1, 50-61.
- 2. Idelbert Dagbegnon Behanzin (2015) GIS-Based Mapping of Flood Vulnerability and Risk in the Benin Niger River Valley. International journal of Geomatics and Geosciences, 6, 1653-1669.
- 3. Dhar, O.N. and Nandargi, S. (2003) Hydrometeorological Aspects of Floods. Natural Hazards, 28, 1-33.
https://doi.org/10.1023/A:1021199714487 - 4. Dilley, M., Chen, R.S., Deichmann, U., Lerner-Lam, A.L., Arnold, M., Agwe, J., Buys, P., Kjekstad, O., Lyon, B. and Yetman, G. (2005) Natural Disaster Hotspots: A Global Risk Analysis. Washington, D.C: International Bank for Reconstruction and Development/the World Bank and Columbia University. Washington, DC.
- 5. U.N.D.P. (2004) United Nations Development Programme, Bureau for Crisis Prevention and Recovery. New York, USA. p. 146.
- 6. Machado-Mosquera, S. and Ahmad, S. (2007) Flood Hazard Assessment of Atrato River in Colombia. Water Resources Management, 21, 591-609.
https://doi.org/10.1007/s11269-006-9032-4