Journal of Geographic Information System
Vol.4 No.4(2012), Article ID:22150,13 pages DOI:10.4236/jgis.2012.44037
3D Analysis and Investigation of Traffic Noise Impact from Hemmat Highway Located in Tehran on Buildings and Surrounding Areas
1Department of Environment and Energy, Science and Research Branch, Islamic Azad University, Tehran, Iran
2Surveying Department, National Cartographic Center, Tehran, Iran
Email: hamid_rr2000@yahoo.com
Received May 27, 2012; revised June 28, 2012; accepted July 20, 2012
Keywords: Noise pollution; Traffic noise model; 3D city model; Three-dimensional modeling of noise
ABSTRACT
This study analyzes and investigates the impact of traffic noise on high rise buildings and surrounding areas by the side of Hemmat Highway that links west of Tehran to the east. In this study, a 3D traffic noise simulation model is applied on a GIS system. Visualized noise levels are formulated by the proposed model for noise mapping on all surfaces of the buildings and surrounding ground in a 3D platform. The investigation shows that there is a high traffic noise impact on the foreground and front facades of buildings, rendering these areas unsuitable for residential purposes. The ground area by the sides of buildings and the building side panels receive a lower noise impact. Most of these areas are still not acceptable for residential and even commercial use, only the back yards and back panels, have the lowest traffic noise impact. It also shows that the building height is not an effective factor for reducing motorway noise on the upper part of the building. Finally, construction cantilever barriers with a height of seven meters, close to the outer edge of the highway was presented as an effective way to reduce noise within the allowable range of noise pollution for commercial and residential purposes.
1. Introduction
After Second World War and industrial revolution in Europe, technology has improved and advanced with a great rate. Technological advances have made human life easier and more comfortable in general; however, they have had their own disadvantages as well. One of the disadvantages of such processes is the rise of environmental problems. These problems consist of pollution caused by industrial advances [1]. In general, they are put in five categories: air pollution, water pollution, soil pollution, thermal pollution, and noise pollution. Noise pollution in urban areas and large cities has adverse harms on human health and wellbeing, from insignificant annoyance, such as disturbance to sleeping, reading, speech communication, concentration of mental work, etc., to serve physiological and psychological damages [2]. Among all of the sources responsible for noise pollution, such as traffic noise, industrial noise, and activity noise, traffic related sources are from great environmental concern and increasing level of discomfort in urban areas with high traffic concentration [3].
Traffic noise is among the extensively most studied fields of noise pollution and therefore, several studies have been made on different aspects of traffic noise [4]. Some researches have been conducted to determine and predict noise propagation level in different countries around the globe. These have led to development of various models for recent propose. Kumar and Kuffer (2008) presented a three-dimensional noise model of Delf, the main weakness of their model was neglecting the background noise, sound barriers, weather condition, reflection of noise from buildings and other obstacles in the field [5,6]. Pamanikabud and Tansatcha (2010) used Geographic information system for analysis of highway traffic noise with development of two programs named FHWA and CoRTN. Hojat and Rajabi (2008) used NMPB (the noise model of European Union) for modeling noise pollution by using three-dimensional city models [7], Rahmani and his colleagues (2012) presented an optimal model for predicting noise from traffic by using the genetic algorithm in Mashhad [8]. Most of these have been in the form of digital calculation of noise levels in certain locations, a process which cannot provide a full view of the study area [9]. In order to find a better solution to solve this problem, having a noise map that can provide complete information about the effects of noise pollution in all directions seems necessary [10]. This can be done through constructing 3D noise models.
In this study, a motorway traffic noise model based on local traffic conditions in Tehran, was initially proposed for the analysis and estimation of traffic noise levels that occur at every location of the studied site. 3D visualized noise mapping is then applied to build a sharp and clear traffic noise contour map of all sides of the building panels together with the surrounding ground surface. Finally, the noise impact on the building and ground surfaces, as shown in 3D format, is then investigated in detail for all sides of the study area.
2. Material and Methods
2.1. Scope and Area of Study
Hemmat is the main highway connecting east to the west in Tehran, so most of the time there is a lot of traffic in this highway. By considering this fact that the biggest source of noise pollution in large cities like Tehran is traffic, Hemmat highway was selected as the study area. Other reason for choosing this highway is the possibility of designing sound walls due to the proper distance from houses to the highway. Designing sound walls at the edge of the highway is the most effective strategy to control noise pollution in this area (Figure 1).
2.2. Traffic Noise Model
The major source of noise in urban areas is transportation, including road transport, planes and trains. Noise levels from road vehicles (including motorcycles, light cars, medium and heavy trucks) have a major portion in the production of noise pollution in urban areas. Other sources of noise in urban areas consist of industrial activities, constructional activities and equipment, each one has a certain share in the production of environmental noise pollution [11].
In many countries, road traffic is the most widespread source of noise and it is the most prevalent cause of
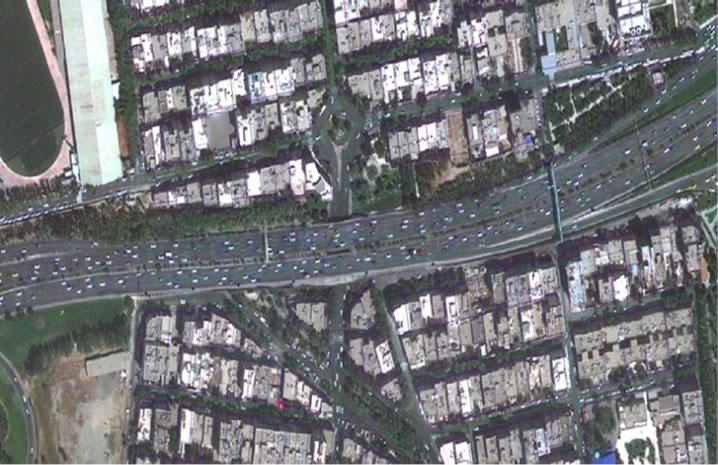
Figure 1. Scope and area of study.
annoyance and interference [12]. Traffic noise is generated from the engine and from frictional contact between the vehicle and the ground and air [13]. Noise generated from traffic depends on traffic volume, the speed of vehicles, the portion of heavy vehicles and the nature of road surface. The road traffic noise level is the aggregation of individual vehicle noise, which is the basic unit for traffic noise source. Each vehicle generates different tones of noise from its sources such as engine, contact tyre and road, exhaust, fan, air intake.
The problem of noise pollution has been a subject of great interest over the last few years. A considerable amount of work has been carried out with the aim of developing models to predict noise levels generated by road traffic. Noise prediction is necessary where a future situation cannot be measured. It is also because measuring noise in the field is practically difficult, since numerous observation points are needed to obtain a complete picture of the noise situation and it is not a cost effective method [14]. Noise prediction is based upon relatively straightforward equations and principles. Prediction of noise levels is in the case when it is not possible to measure at the receiver. Noise levels can be predicted based on the traffic flow rate, the speed of vehicles, the proportion of heavy vehicles and the nature of road surface. In some situations noise prediction can be more accurate than measurement, since only the contribution of the process is predicted [15].
Proposed Traffic Noise Model
Traffic noise models have been developed in many countries for use in the analysis and prediction of noise generated by traffic on highways [16]. The different vehicle types that are used and operated on the highways of each country cause difference in traffic noise level generated by those vehicles [17]. Therefore, many countries have had to build their own traffic noise simulation models for the effective analysis and prediction of noise generated by their country’s particular vehicular and traffic conditions.
Accordingly, because there was no standard model for predicting noise in Iran, existing models in the world were studied. These models consist of Harmonized methods suggested by EU, Dutch noise calculation methods, TNM by FHWA in the US, CoRTN and PRTN by the Department of Environment in the United Kingdom, RLS-90 by the Germany, MITHRA by a French firm, StL-86 by the Swiss Federal Office for Environmental Protection [18-20]. The Harmonized methods are used for prediction of environmental noise levels caused by roads and railway traffic. These methods are only valid for regional climate in Europe [21]. In Netherlands, the noise calculation takes place in specially developed computer models based on extensive measurement done in the year 1970s and 1980s [22]. The noise computation methods are designed to give an accurate traffic noise levels and can be implemented for any area for noise simulation. These methods are categorized in different groups with diverse purposes. 1-Standard Calculation Method 1 (SCM1) is generally used for simple situations and with few calculation parameters. In this method the reflections and obstruction of sound between the buildings is not considered. The SCM1 is normally used for preliminary assessment of noise impact. It can be easily implemented for any condition and can have quick result for assessment. 2-Standard Calculation Method 2 (SCM2) considers all the factors affecting noise levels including reflection and obstruction of sound between buildings. It's disadvantage is that it requires high computation and also it is a time consuming approach. On the other hand, the standards for noise mapping including 1-Standard Noise Mapping Method 1 (SMM1) is based on the SCM1 in addition to a factor of blocking of noise due to buildings called SKM is taken into account for noise calculation. 2-Standard Noise Mapping Method 2 (SMM2) is based on the SCM2 methods [23].
Finally, by considering natural, physical and traffic conditions of this highway, studying existing models in the world and dialogue with the dBvision’s noise expert Mr. Henk de Klujijver on December 15, 2011, a model was proposed for the study area “Equation (1)”. The proposed model due to high flexibility in adopting different parameters is able to run in different environments.
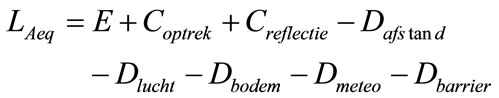 (1)
(1)
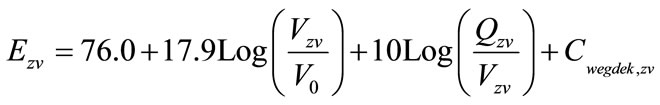
 is noise level on the calculation point (Aeq means average or equivalent noise level).
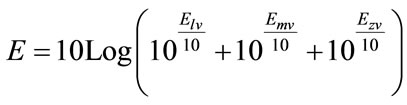
 is the emission level of noise calculated for the day (7:00 - 19:00), evening (19:00 - 23:00) and night (23:00 - 7:00). Then, a correction of +5 dB for the evening and +10 dB for the night was used to give a higher level of protection for the evening and night “Equation (2)”.
 (2)
(2)
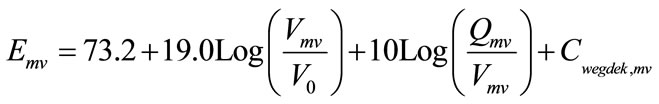
 is the noise emission of light cars calculated for day, evening and night “Equation (3)”.
 is the noise emission of medium heavy trucks (trucks with a single rear axle plus busses) calculated for day, evening and night “Equation (4)”.
 is the noise emission of heavy trucks (trucks with more than one rear axle and trailer trucks) calculated for day, evening and night “Equation (5)”.
 (3)
(3)
 (4)
(4)
 (5)
(5)
 ,
,  ,
,  are respectively the speed of light, medium and heavy vehicles.
 is the reference speed: 80 km/h for light vehicles and 70 km/h for light trucks (+busses) and heavy trucks.
 ,
,  ,
,  are respectively the quantity of light, medium and heavy vehicles during day, evening and night.
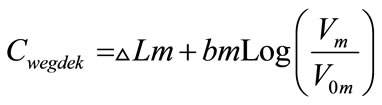
 is the correction for the noise emission depending on the road surface (“wegdek” means “road surface”) “Equation (6)”.
 (6)
(6)
Different types of road surfaces have different values of  and
and . For the reference road surface (a normal asphalt road) the ID is 1. The values for
  and
and  are mentioned as below. The result is
  = 0.
= 0.
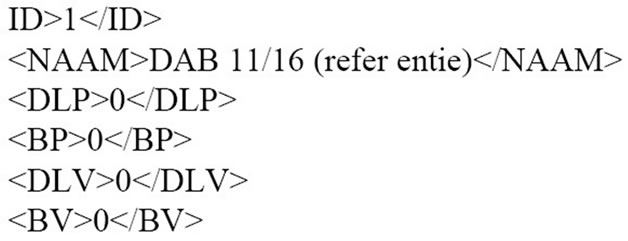
DLP is  for light traffic.
BP is  for light traffic.
DLV is  for light trucks (+busses) and heavy trucks.
BV is  for light trucks (+busses) and heavy trucks For a brick road the ID is 10. The result is
  = 4, which means the emission is 4 dB higher than the asphalt road.
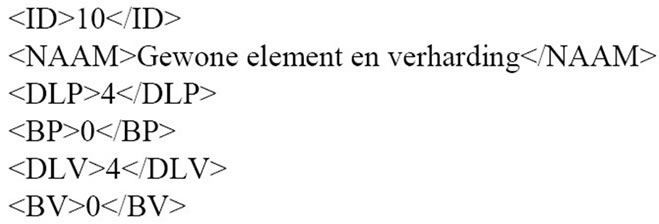
The other road surfaces (other ID’s) are mostly special types which are developed to reduce the noise emission.
 is the extra emission for vehicles accelerating and breaking at crossings.
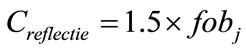
 is the extra noise emission because of reflections of buildings and noise barriers on the other side of the road “Equation (7)”.
 (7)
(7)
 is the part on the other side of the road which reflects the noise (value between 0 and 1). Only the objects within a reasonable distance are taken into account.
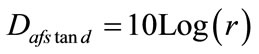
 is the reduction (D for damping) of the noise depending on distance “Equation (8)”.
 (8)
(8)
 is the shortest distance between the road and the calculation point (in meters).
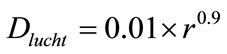
 is the reduction of noise because of absorption in the air “Equation (9)”.
 (9)
(9)
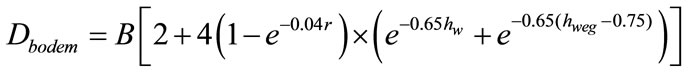
 is the reduction of noise caused by absorption of the ground “Equation (10)”.
 (10)
(10)
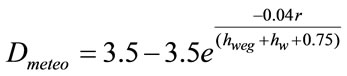
 is the part between the middle of the road and the calculation point which is considered to absorb noise (the value is between 0 and 1). Road surfaces and water reflect noise, other surfaces like grass-land absorb noise.
 is the height of the calculation point in reference to the ground level at the calculation point (in meters).
 is the height of the road in reference to the ground level next to the road (in meters).
 is the reduction of noise because of the weather condition mostly due to the wind direction “Equation (11)”.
 (11)
(11)
 is the reduction of noise because of noise barriers or buildings between the road and the calculation point.
The parameters of the proposed traffic noise model presented in (Figure 2).
2.3. Data Used and Validation of Traffic Noise Model
Data required for the proposed model includes statistical information on traffic (number and speed of light, medium and heavy vehicles) obtained from the Online traffic diagrams of Tehran Traffic Control Center (Figures 3 and 4) and also information about the physical condition of the highway (Tables 1-4). On one hand, the accuracy of input data due to having direct impact on the results, must be validated qualitatively and quantitatively. On the other hand, because this study investigates noise impact in a 3D format that includes horizontal and vertical planes, the validation for the traffic noise model of this motorway must be done by using two newly collected data sets: one for the horizontal plane of the ground surface and another for the vertical planes of the building panels.
Validation of the Proposed Traffic Noise Model
In this research, the proposed traffic noise model was used to model the effects of noise from the traffic. As mentioned in the previous section, first the accuracy of the collected data should be validated qualitatively and quantitatively and then validation of model on both vertical and horizontal planes should be done. To do this, a calibrated Sound Level Meter (BrüeKjer2230) was used for direct measurement in the field (Figure 5). The first model validation is to check the accuracy of traffic noise prediction on the surrounding ground surface (horizontal plane), using a total data of 71 points randomly collected from different locations on the surrounding ground surface in the vicinity of the motorway. The sound level meter is set at the height of 1.20 m from ground surface. The locations of measuring point on this horizontal plane are random along this motorway line with the distance ranging from 2 m to 27 m from near side edge of the
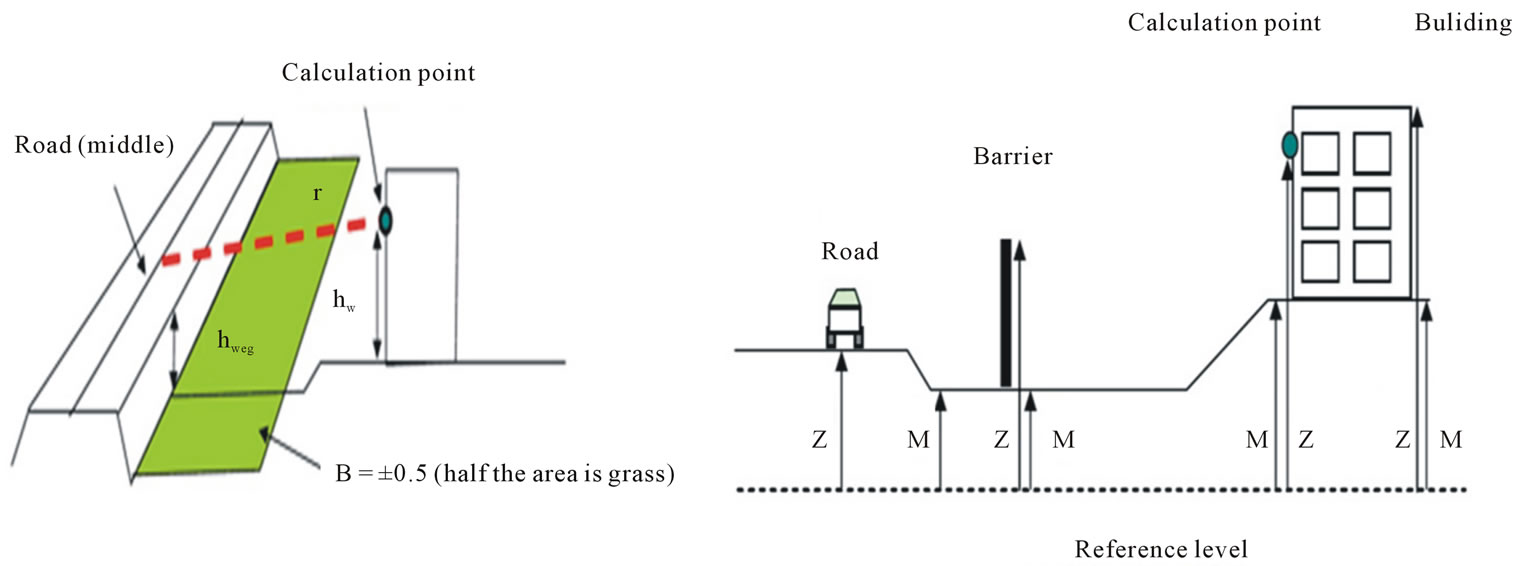
Figure 2. The parameters of the proposed traffic noise model.
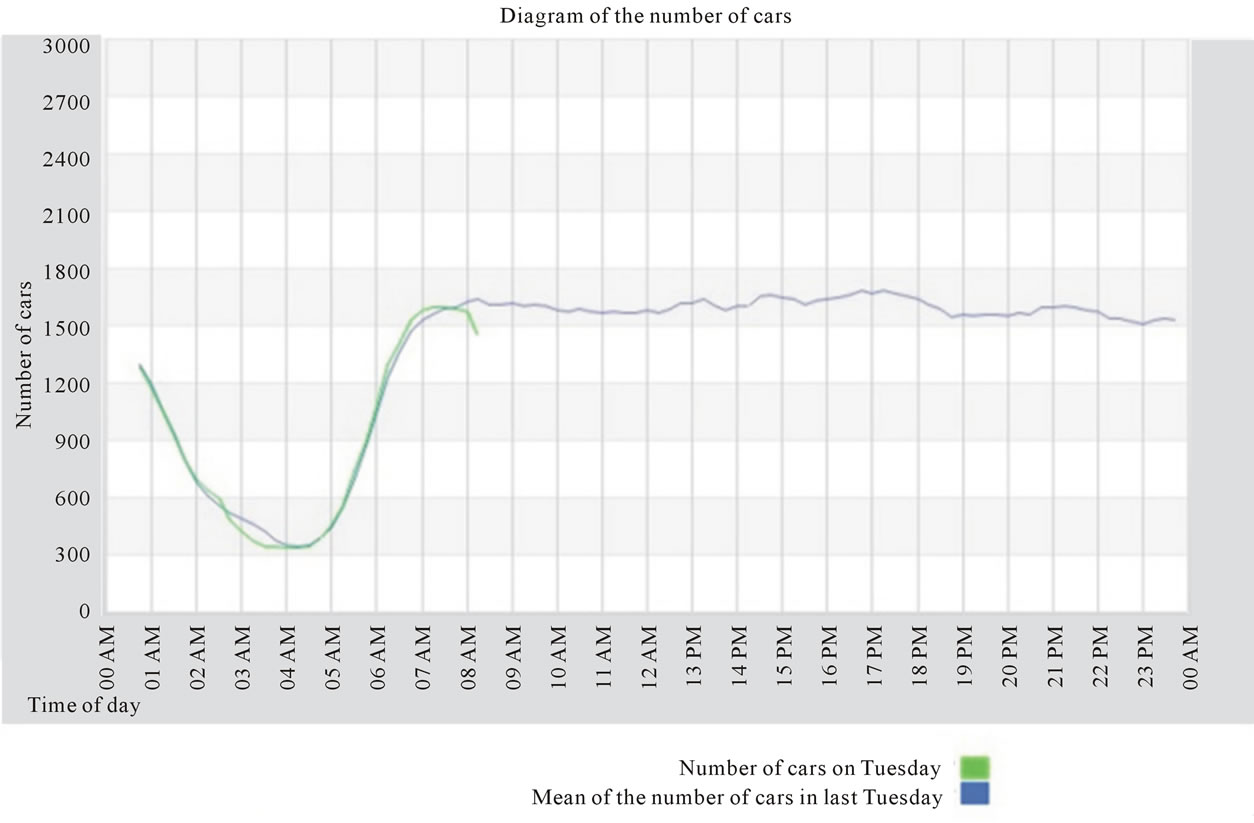
Figure 3. Online diagram of the number of cars (source: www.tehrantraffic.com).
Figure 4. Online diagram of the speed of cars (source: www.tehrantraffic.com).
frontage road. All of the data on traffic characteristics and physical condition of motorway together with the true path distance between receiver and noise source are input data for the model in order to calculate the predicted values of traffic noise on that particular receiver point. A paired t-test technique with a significance level α = 0.05 is applied to this validation test to compare the predicted noise levels with the measured ones. This statistical test showed that the model can provide a significance result in predicting motorway noise on the surrounding ground surface with Sig. 2-tailed = 0.516. The statistical results of this test are shown in Table 5.
The second validation is to test the accuracy of the model in predicting motorway traffic noise levels on the
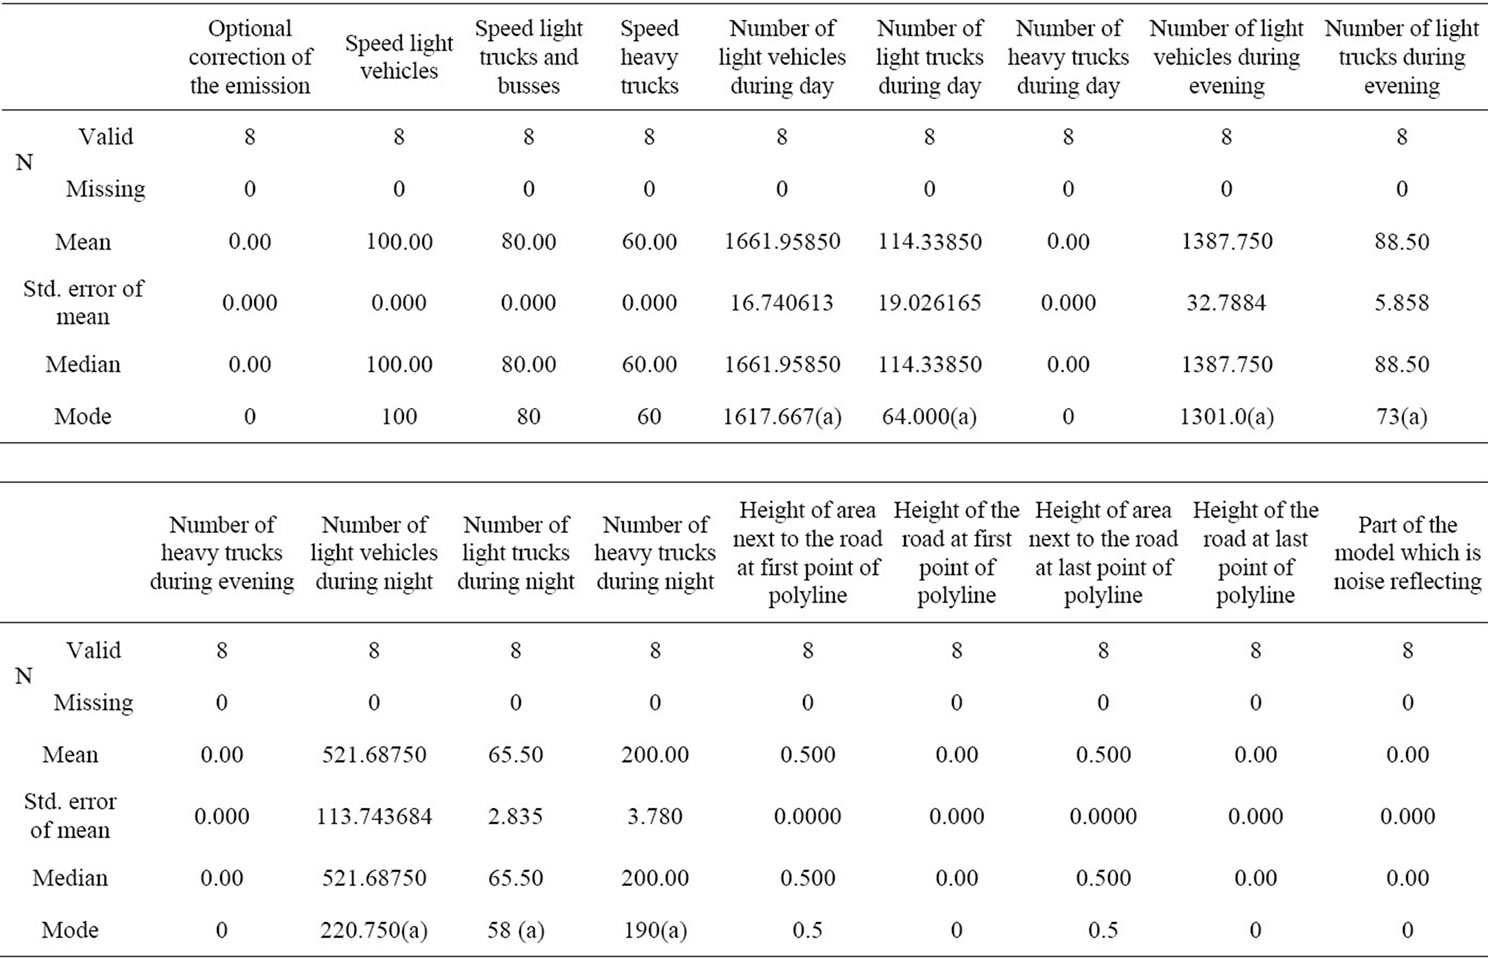
Table 1. Statistical information of traffic and physical condition of the highway.
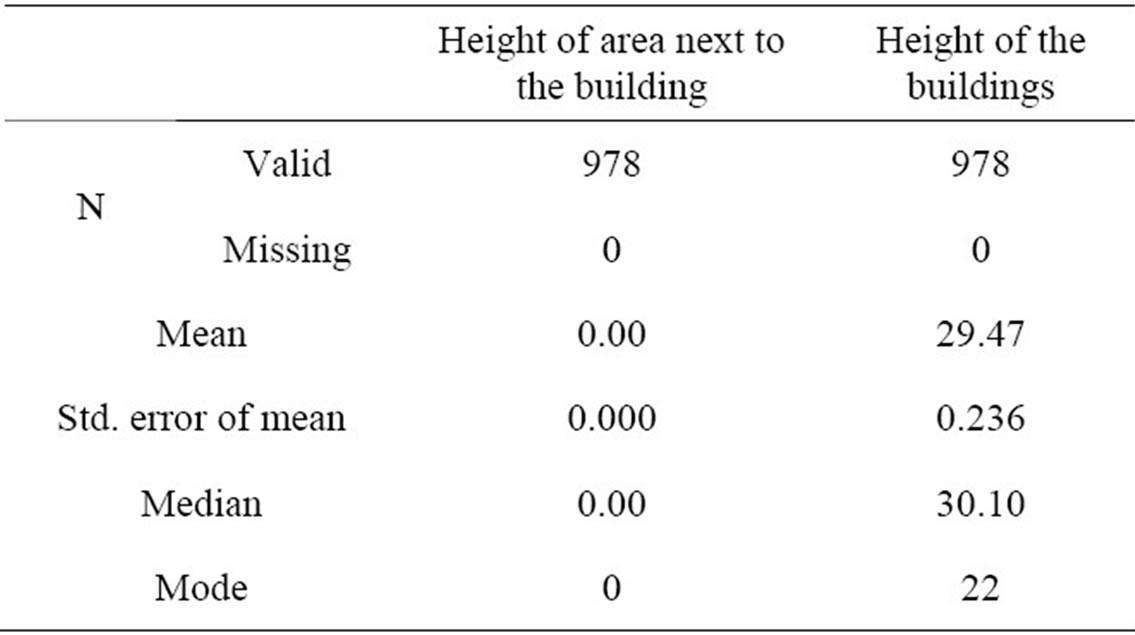
Table 2. Physical information of existing barriers in the field.
panel surfaces of high-rise building (vertical plane) along the motorway corridor. This is done by using another 121 points randomly collected from the buildings and advertising billboards at the different locations and heights around the motorway. The horizontal distance of these locations are ranged between 5 m to 25 m from the near side edge of the near side frontage road, and the vertical heights of these locations are ranged between 3 m and 39 m from the ground surface. All of the data on traffic characteristics and physical condition of motorway together with the true path distance between receiver and noise source are input data for the model in order to calculate the predicted values of traffic noise on that particular receiver point. The validation test is given to test the accuracy of these measured and predicted noise values in the vertical plane with the paired t-test technique. The results from this test with a significance level α = 0.05 show the significance of the model in predicting traffic noise on the vertical planes of nearby high-rise building panels with the sig. 2-tailed = 0.896. The results of the paired t-test of vertical plane data are shown in Table 6.

Table 3. Physical information of existing buildings in the field.
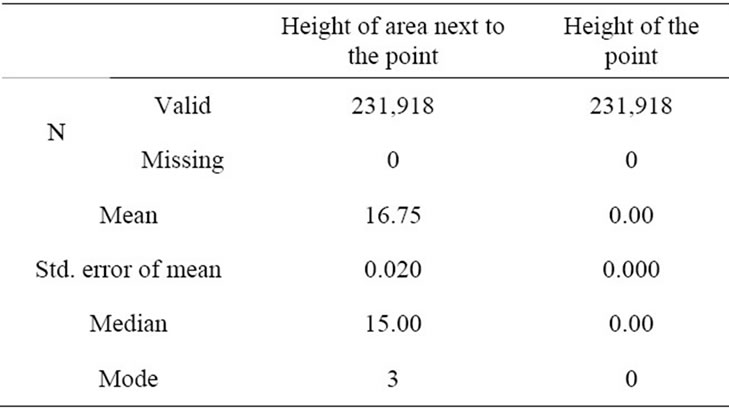
Table 4. Physical information of observation points.
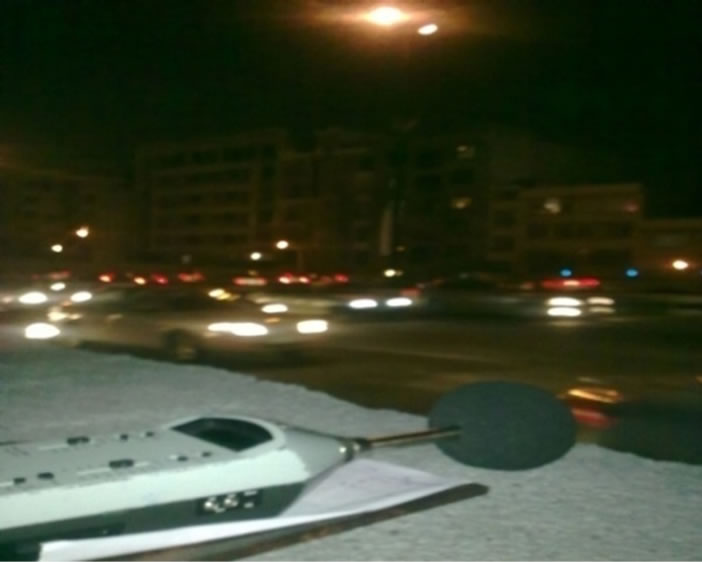
Figure 5. Direct measurement in the field by using a calibrated Sound Level Meter (BrüeKjer2230).
2.4. 3D Modeling of Noise by Using 3D City Model
The 2D noise maps are developed with the information of noise levels of one particular height. But actually, noise transmits in all directions and the impact of noise is in all directions. Information of noise of one particular height will not be enough to reduce or control noise pollution. Therefore, these maps would not be appropriate for noise assessment process [24]. In order to have a better solution for these problems, it is necessary to have a noise map that can provide complete information of noise effect in all directions. This would be possible with the presented 3D noise model. 3D analysis and investigation of traffic noise impact from highway on buildings and surrounding areas would be possible by taking these steps: constructing three-dimensional model of the study area, creating 3D observation points surrounding buildings, calculating noise levels at each of these points, interpolating noise levels with a variety of methods (linear, cubic, nearest neighbor, Biharmonic) by scripting in MATLAB programming environment and finally combining the three-dimensional city model and three-dimensional model of noise pollution in the GIS environment (Figure 6).
Construction of three-dimensional city model can take place by using semi-automatic or fully automatic algorithms, terrestrial or aerial laser scanning and GPS in accordance with the required model [25]. In this study, three-dimensional model of the study area was created by using ArcGIS software and collected data relating to building heights and natural ground level. The most important data in this three-dimensional model that must be dealt with in detail include observation points, buildings, highway, sound barriers and vacant lands which depending on soil type, a noise absorption coefficient is considered in the model for them (Figure 7).
The most important phase in three-dimensional noise modeling is to create and distribute points around the buildings, which noise levels are calculated in. Density and number of these points will affect the accuracy of final results. In this study, the quantity of 231,918 observation points with uniform spacing in both horizontal and vertical direction distributed. The points were selected in the horizontal plane 3 m above natural ground level, at 2 m intervals perpendicular to the lateral edge of the highway, and 5 m in the direction parallel to the highway and in the vertical plane at 5 m intervals with a 10 cm vertical offset perpendicular to the front facade of the buildings.
The reason for considering offset in vertical points is to prevent possible errors in deployed interpolation equations, due to having points with same X, Y in different heights. In order to obtain a more complete acoustical status of study area, observation points also selected in the back and upper parts of buildings. The reason for this issue is the necessity of knowing the behavior of noise in quiet environments (behind buildings and open lands) to design appropriate applications in these environments. Observation points were automatically created with VBA scripting (Figure 7).
After calculating noise at each of the points by the proposed noise model. 3D noise model was created by fitting surfaces on the cloud of observation points. To
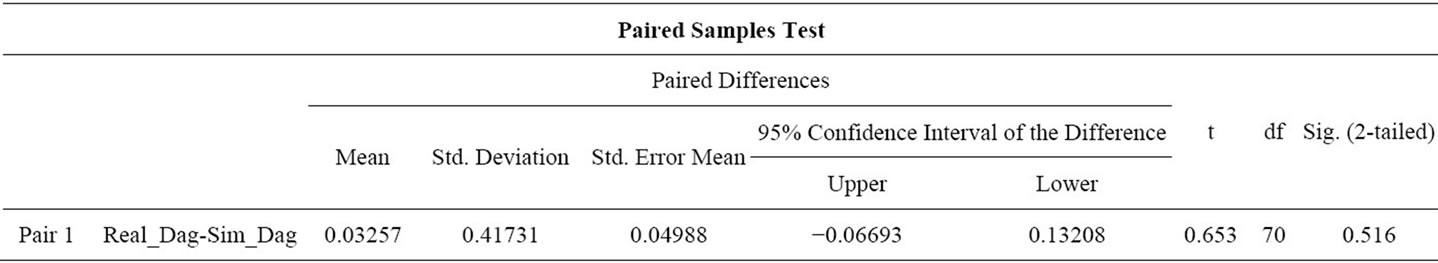
Table 5. Results of statistical paired t-test of predicted and measured traffic noise on horizontal planes at α = 0.05.

Table 6. Results of statistical paired t-test of predicted and measured traffic noise on vertical planes at α = 0.05.
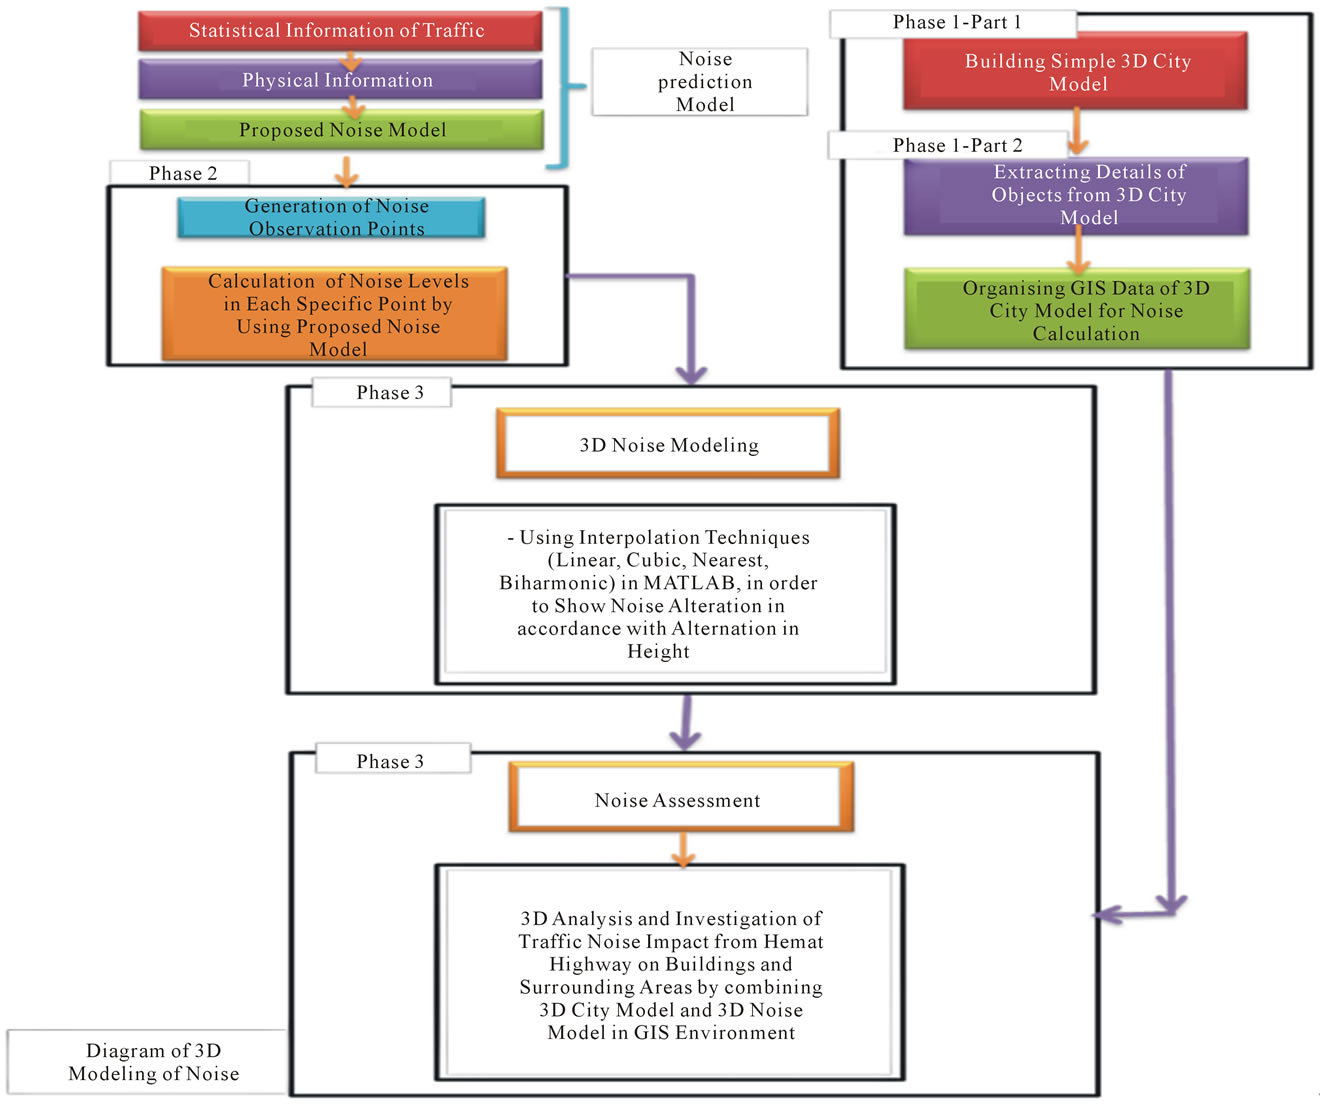
Figure 6. Diagram of 3D visualization of motorway noise.
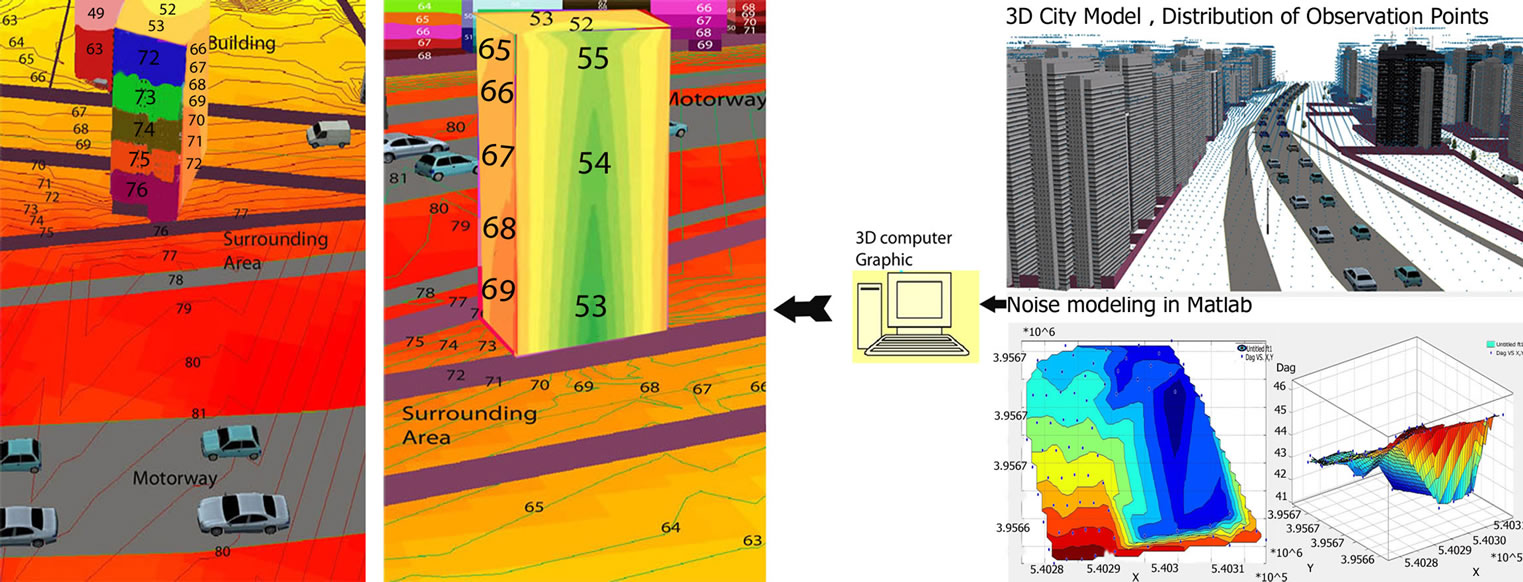
Figure 7. Different phases for 3D noise modeling.
reach this, different interpolation techniques such as linear, cubic, nearest neighbor, Biharmonic were used in MATLAB environment. By calculating the ME and RMSE for each of these interpolation methods and comparing them with each other, biharmonic and linear methods with the lowest RMSE chosen as the appropriate methods for interpolating noise data in this study, Therefore, only the linear Interpolation was used within the day period (Figure 7).
To sum up, in this study, an evaluation is firstly given to validate the traffic noise model that was proposed for this motorway, in order to see whether it can be used effectively in simulating traffic noise from this motorway. This validated motorway noise model is then input into the GIS platform of the ArcGIS program via script programming for estimation of noise levels on all surfaces of building and ground at uniform grid points that are assigned into this study area in 3D format. Visualized noise mapping is then applied to build color-enhanced noise contours on all of the 3D study surfaces. Traffic noise impact from this motorway on all sides of the building panels and the ground surface around the building can then be investigated in detail.
3. Results and Discussions
In order to effectively evaluate the effect of noise from the traffic, the simulated noise model was combined with three-dimensional city model. Visualized traffic noise mapping is developed on the 3D GIS base in order to transform this invisible impact into a visible one in the form of color-enhanced noise contours on the ground and building surfaces. The grid point system for traffic noise estimation as given in this research can provide clear and sharp images of color-enhanced images on the studied surface, even when enlarged for detailed investigation. The noise impact investigation on each side of the building surface is performed based on this building surface’s noise mapping as follows:
On the front panel, or front facade of the building, traffic noise decreases as the height of the building increases. This is due to the increased length of the noise path from the motorway to that location on the building surface. From the Figure 7, the highest traffic noise level of 76 dBA occurs at the ground level of this front surface, and the lowest noise level of 72 dBA appears at the top edge of this front surface. Based on the results of this study, this high rise building, especially its front facade, is not suitable to be used for residential purposes, since the noise from the nearby motorway creates a high traffic noise impact on the front panel, ranging from 72 to 76 dBA. This is greater than the allowable noise standard of 55 dBA for the residential areas. Certain types of noise protection are needed in order to make the building acceptable for commercial and even residential use.
On the side panels, traffic noise levels decreases as the observed locations move farther from the motorway. The noise levels also decrease with the increase in the height of these locations. As shown in the Figure 7, the highest traffic noise level f 72 dBA occurs at the lowest front corner of the two side panels that are closest to the motorway. And the lowest noise level of 66 dBA appears at the back corner of the top edge of these two side panels. On the rooftop, traffic noise decreases due to the increase in the length of the noise path from the motorway. As shown in the Figure 7, the lowest noise level of 52 dBA occurs at the back edge of the roof.
On the back panel, this side of building is the surface that receives the lowest noise impact from the motorway, since it is the location that has the highest degree of shielding from the building itself, for both the vertical path difference and the horizontal shielding angle. Therefore, it is the safest panel of this building from the impact of motorway traffic noise. The lowest noise location on this back surface is shown to be the middle of the lowest edge of the back side of the building, with a noise level of 52 dBA. The loudest noise level 53 dBA, appears at the edge of both sides of this panel, which have the least shielding effect from the building.
The investigation results of noise impact from the motorway at this study area show that motorway traffic creates a high noise impact on the surrounding ground area and nearby high-rise building. In the foreground area of this building, from the motorway right-of-way to the building line, the lowest noise level of 76 dBA appears at the baseline of the building facade. This noise level is much higher than the Iranian standard highway noise limits of 55 dBA for residential areas and 60 dBA for business or commercial areas. This means that it is harmful to the health of people who live or work in this foreground area without any kind of motorway noise protection such as construction of noise barriers or installation of sealed glass windows and doors. The noise conditions on the ground areas by the sides of a building near the motorway are better than in the foreground. The shielding effect from the building causes a decrease of noise levels in these areas. But it is still not regarded as safe for residential areas, since the lowest noise level of 72 dBA in the area at the back corner of the building is still higher than the standard level for residential usage. The area on the back side of the building is the safest place for residential use, since it is shielded by the high-rise building which blocks the noise from the motorway.
One of the most effective methods for noise attenuation in this area is the use of noise barriers. These barriers are resistive structures reducing the noise levels by creating obstruction along the path of noise between the receptor and noise-producing source [26]. For designing noise barriers, several factors including the shape, material, height, length and location of installation should be considered. In order to have the most attenuation in noise levels, considering the power of noise in the source and also having the ability of testing different types and conditions for noise walls in a simulated environment seems to be necessary. This is one of the capabilities of the proposed three-dimensional model. In this research, the effect of employing various sound barriers to reduce noise levels from Hemmat Highway was studied by modeling in a simulated environment. Initially, the effects of barrier height and distance from the highway to reduce noise were analyzed (Figure 8). The first three barriers (a), (b), (c) are of height 3m and located at a distance of 2 m, 6 m, 9 m from the edge of road respectively. The next three barriers (d), (e), (f) are of different height of 3 m, 5 m, 7 m respectively and located at equal distance of 2m from the edge of road. Comparing the first three barriers (Table 7), the barrier (a) is found to be more effective in reducing noise levels both in horizontal and vertical direction than other barriers (b), (c), thus it can be concluded that the barriers located close to the road are more effective than the barriers located far from roads. Comparing the second three barriers (Table 7), it is found that the barrier (f) with the height of 7m is more effective than other barriers with the height of 3m and 5m. It implies that, as the height of the barrier is increased, the effect of barrier in vertical direction also increases. However, cost plays an important role while deciding the height of barrier. The most noise reduction was seen in a barrier of 7 m height located at a distance of 2 m from the edge of road, the rate of attenuation for this type of barrier was 7dBA for adjacent areas, 12 dB for the first floor, 9 dBA for the second and third floors and less than this value for the fourth and the other floors.
On the other hand, different types of sound walls, including vertical, cantilever, semi-enclosure, enclosure barriers (g, h, i, j) with a height of 7 m in a distance of 2 m from the outer edge of the highway were studied. Thus, enclosure, semi-enclosure and cantilever barriers were found more effective in noise reduction respectively (Figure 9), Which makes the surrounding areas, front and lateral sides of buildings suitable not only for commercial use but also for residential use. By considering the fact that the cost of installing enclosure and semienclosure barriers are much more than the cost for
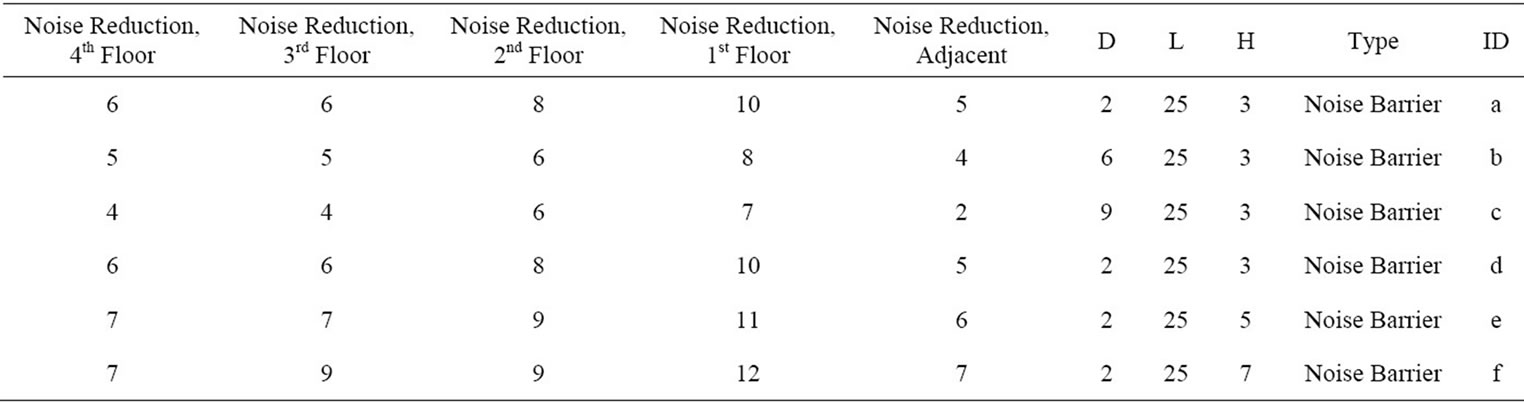
Table 7. The role of the height of barriers and distance from road in noise attenuation.
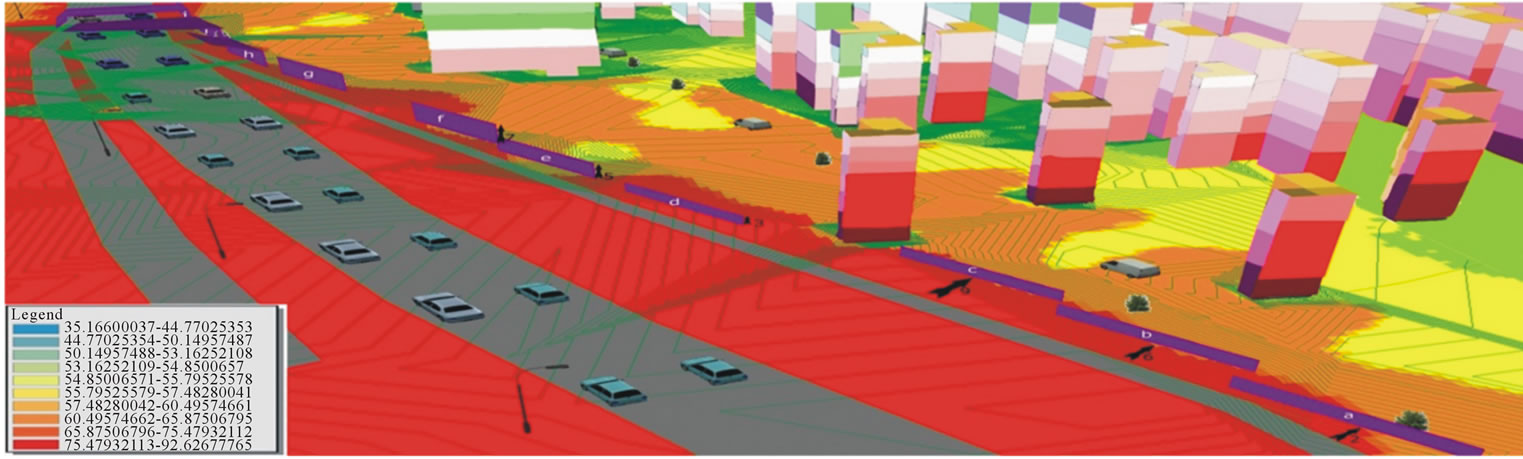
Figure 8. The role of the height of barriers and distance from road in noise attenuation.
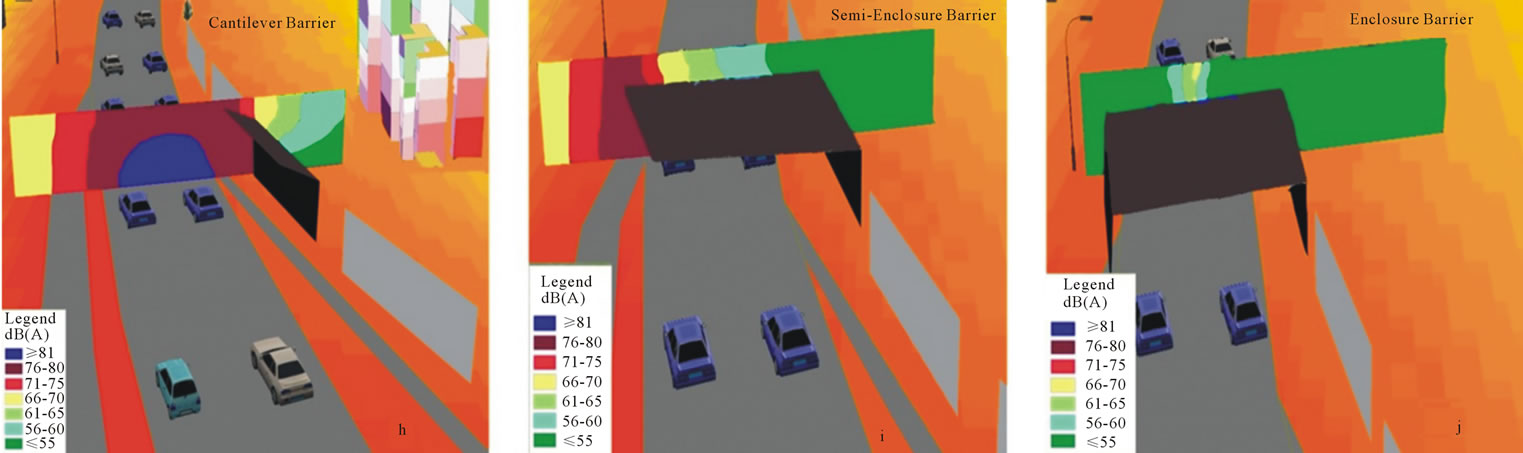
Figure 9. The role of different types of noise barriers in noise attenuation.
installing cantilever barrier and considering the physical and natural conditions of study area, installing a cantilever barrier of 7 m height with a distance of 2 m from the edge of road would be the best choice for this area. By installing this type of barrier the noise levels would be in the range of acceptable standards for residential and commercial uses, therefore, we would have a safe place for life and work.
4. Conclusions
Traditional methods for providing results of noise assessment could not be considered as an appropriate approach for analysis and investigation of functional alternatives to examine the types of noise reduction strategies. Hence, having a flexible model, which enables users to review and evaluate alternatives in a simulated environment, seems necessary. This approach enables faster and better understanding of noise impact around the study area and also investigating the effect of different parameters in noise reduction. In this study, the assessment was done by combining the proposed model of traffic noise and three-dimensional model of the study area in GIS environment. Initially, the noise prediction model was presented with regard to our study area, it was then evaluated by measuring some control points in the field. In the next stage, with construction of three-dimensional model of the study area, distribution of observation points, calculation of noise in each specific point within day time, three-dimensional modeling of noise was implemented in GIS environment. Traffic noise impact from this motorway on all sides of the building panels and the ground surface around the building can then be investigated in detail.
The investigation results of noise impact from the motorway at this study area show that the front facades of buildings receive the highest noise impact in comparison to all other building panels. The highest noise levels occur in the bottom front and by moving toward the upper edge the noise level decreases to the lowest noise level 72 dBA at the highest edge. This shows that the front facades of buildings are unsafe for residential use, unless we use specific types of noise control approaches in this area. In this research, because the highest point of the building with a height of 27 meters on the ninth floor has noise level of 72 dBA (means only 4 dBA reducing in the noise level compared with noise level of 76 dBA on the ground), the height of buildings is not recognized as an effective parameter to reduce noise from the highway. Based on the results of this research, this high rise building, especially its front façade and even its side panels, are not suitable to be used for residential and also commercial purposes, since the noise from nearby motorway creates a high traffic noise impact greater than allowable noise standard on these facades. Backside and upside of buildings due to having noise levels less than the standard level are entirely appropriate for the residential uses. Certain types of protection are needed in order to make the building acceptable for residential and commercial use. For the most harmonious usage of the building and surrounding area, sound barriers of different heights, with different distances from the edge of the highway were investigated. The highest attenuation in noise levels was seen by installing a sound wall with seven meters height located in two meters from the outer edge of the highway. By considering the natural condition of the study area and even economical aspects, installing cantilever barriers could be an effective approach for noise attenuation in this area.
REFERENCES
- M. Arana and A. Garcia, “A Social Survey on the Effects of Environmental Noise on the Residents of Pamplona,” Applied Acoustics, Vol. 53, No. 4, 1998, pp. 245-253. doi:10.1016/S0003-682X(97)00067-4
- G. Belojevic, B. Jakovlevic and O. Aleksic, “Subjective Reactions for Traffic Noise with Regard to Some Personality Traits,” Environmental International, Vol. 23, No. 2, 1997, pp. 221-224. doi:10.1016/S0160-4120(97)00008-1
- M. El-Fadel, S. Shazbak, M. H. Baaj and E. Saliby, “Parametric Sensitivity Analysis of Noise Impact of Multihighways in Urban Areas,” Environmental Impact Assessment, Vol. 22, No. 2, 2002, pp. 145-162. doi:10.1016/S0195-9255(01)00101-9
- J. C. Seong, T. H. Park, J. H. Ko, S. I. Chang, M. Kim, J. B. Holt and M. R. Mehdi, “Modeling of Road Traffic Noise and Estimated Human Exposure in Fulton County, Georgia, USA,” Environment International, Vol. 37, No. 1, 2011, pp. 1336-1341. doi:10.1016/j.envint.2011.05.019
- D. Butler, “Noise Management: Sound and Vision,” Nature, Vol. 427, No. 6974, 2004, pp. 480-482. doi:10.1038/427480a
- V. K. Kurakula and M. Kuffer, “3D Noise Modeling for Urban Environmental Planning and Management,” REAL CORP, Vol. 432, No. 1, 2008, pp. 517-523.
- S. A Hojat and M. A. Rajabi, “Modeling of Noise Pollution by Using 3D City Model in GIS Environment,” M.Sc. Thesis, GIS Department, Faculty of Geodesy & Geomatics Engineering, Tehran University, Tehran, 2008.
- S. Rahmani, S. M. Mousavi and M. J. Kamali, “Modeling of Road-Traffic Noise with the Use of Genetic Algorithm,” Applied Soft Computing, Vol. 11, No. 1, 2011, pp. 1008-1013. doi:10.1016/j.asoc.2010.01.022
- P. Pamanikabud and M. Tansatcha, “3D Analysis and Investigation of Traffic Noise Impact from a New Motorway on Building and Surrounding Area,” Applied Acoustics, Vol. 71, No. 1, 2010, pp. 1185-1193. doi:10.1016/j.apacoust.2010.08.003
- T. M. Barry and J. A. Reagan, “FHWA Highway Traffic Noise Prediction Model,” Computers, Environment and Urban Systems, Vol. 27, No. 1, 2003, pp. 85-102.
- R. Silvia, H. Ricardo and C. J. Luis, “Evaluation and Prediction of Noise Pollution Levels in Urban Areas of Cdiz (Spain),” Acoustical Society of America Journal, Vol. 114, No. 1, 2003, pp. 2439-2439.
- Bruel and Kjaer, “Environmental Noise,” 2002. http://www.bksv.com/pdf/Environmental%20Noise%20Booklet.pdf
- World Health Organization, “Guidelines for Community Noise,” 1999. http://www.ruidos.org/Noise/WHO_Noise_guidelines_contents.html
- H. Kluijver and J. Stoter, “Noise Mapping and GIS: Optimising Quality and Efficiency of Noise Effect Studies,” Computers, Environment and Urban Systems, Vol. 27, No. 1, 2003, pp. 85-102. doi:10.1016/S0198-9715(01)00038-2
- Environment Agency, “Horizontal Guidance for Noise,” 2002. www.environmentagency gov.uk/commondata/acrobat/h3_pt2__june_2004__v3_353249.pdf
- M. G. S. Rao, P. R. Rao, K. S Dev and K. V. Rao, “A Model for Computing Environmental Noise Levels Due to Motor Vehicle Traffic in Visakhapatnam City,” Applied Acoustics, Vol. 27, No. 2, 1989, pp. 129-136. doi:10.1016/0003-682X(89)90005-4
- P. Pamanikabud and P. Vivitjinda, “Noise Prediction for Highways in Thailand,” Transportation Research Part D: Transport and Environment, Vol. 7, No. 6, 2002, pp. 441- 449. doi:10.1016/S1361-9209(02)00012-3
- E. Murphy and E. A. King, “Strategic Environmental Noise Mapping: Methodological Issues Concerning the Implementation of the EU Environmental Noise Directive and Their Policy Implications,” Environment International, Vol. 36, No. 1, 2010, pp. 290-298. doi:10.1016/j.envint.2009.11.006
- C. A Steele, “Critical Review of Some Traffic Noise Prediction Models,” Applied Acoustics, Vol. 62, No. 1, 2001, pp. 271-287. doi:10.1016/S0003-682X(00)00030-X
- G. R. Watts, “Harmonoise Prediction Model for Road Traffic Noise,” 2005. http://www.imagine-project.org/
- AEA Technology Rail BV, “Harmonised Accurate and Reliable Methods for the EU Directive on the Assessment and Management of Environmental Noise,” 2005. http://www.imagineprojectorg/bestanden/D13p1_WP1.2_manual_HAR12TR-040112-SNCF10.pdf
- Ministerie van Volkshuisvesting, Ruimtelijke Ordening en Milieu, “Handleiding Meten en Rekenen Industrielawaai (Calculation and Measurement Methods Industry Noise),” Ministry of Housing, Spatial Development and the Environment, Philipsburg, 1999.
- V. Kurakula, A. K. Skidmore, H. Kluijver, J. Stoter, K. Dabrowska-Zielinska and M. Kuffer, “A GIS-Based Approach for 3D Noise Modelling Using 3D City Models,” M.Sc. Thesis, International Institute for Geo-Information Science and Earth Observation (ITC), Enschede, 2008.
- C. W. Law, C. K. Lee, A. S. W. Lui, M. K. L. Maurice Yeung and K. C. Lam, “Advancement of Three-Dimensional Noise Mapping in Hong Kong,” Applied Acoustics, Vol. 72, No. 1, 2011, pp. 534-543. doi:10.1016/j.apacoust.2011.02.003
- C. Brenner, “Building Reconstruction from Images and Laser Scanning,” International Journal of Applied Earth Observation and Geoinformation, Vol. 6, No. 3-4, 2005, pp. 187-198.
- S. Zabani, N. Bidhindi, H. Keshavarzi and H. Mehravaran, “Providing Acceptable Noise Levels and Designing Noise Barriers for Hemat Highway,” M.Sc. Thesis, Faculty of Environment Engineering, Tehran University, Tehran, 2008.