Journal of Geographic Information System
Vol.4 No.3(2012), Article ID:19595,8 pages DOI:10.4236/jgis.2012.4327
Land Transformation Analysis Using Remote Sensing and GIS Techniques (A Case Study)
Department of Geography, Aligarh Muslim University, Aligarh, India
Email: Prince4321@gmail.com
Received February 18, 2012; revised March 9, 2012; accepted March 19, 2012
Keywords: Human Population; Urban Land Use/Cover; Land Transformation; GIS
ABSTRACT
The increasing population and economic activities are putting pressure on the available land resources. Human population and their use of land have transformed the terrestrial biosphere into anthropogenic biomes (anthromes). The present study analyses the urban land use/cover change and land transformation in Srinagar city which is located in the valley of the hill state of Jammu and Kashmir. A change detection analysis was performed to determine the nature, extent and rate of land use/cover change and transformation over 30 years of time period. The results show that the city has expanded significantly at the cost of non built-up land which has decreased in its area. Significantly there was not only the expansion of city area but also there were interchange of land between different land use/cover classes in the study area.
1. Introduction
Land is the basic natural resource that provides habitat and sustenance for living organisms, and a major source of economic activities [1]. On the basis of the utility of the land, it can be classified into two classes i.e., “Land use” and “Land cover”. Land use is the total of all arrangements, activities and inputs that people undertake in a certain land cover type. It involves both the order in which the biophysical attributes of the land are manipulated and the purpose for which the land is used [2]. In contrast, Land cover is the observed physical and biological cover of the earth’s land as vegetation, rocks, water body or man-made features [3]. It deals with, for example, the quantity and type of surface vegetation, water, and earth materials [4].
Historically humans have been modifying land to obtain the essentials for their survival, but the accelerated rate of exploitation has brought unprecedented changes in ecosystems and environmental processes at local, regional and global scales. The prime aim of these land use/land cover changes including land conversion from one type to another and land-use management is to satisfy mankind’s immediate demands i.e., the need to provide food, fiber, water, and shelter [5,6]. Global croplands, pastures, plantations, and urban areas have expanded in recent decades, accompanied by large increases in energy, water, and fertilizer consumption, along with considerable losses of biodiversity [7].
Land use and its changes generally require the integration of natural and social scientific methods e.g., expert knowledge, interviews with land managers etc., to determine which human activities are occurring in different parts of the landscape [8]. However, the two are always used in association; this partly reflects the collection of data by satellite imagery from which it is difficult to distinguish many activities but also reflects the internally inter-dependent nature of activity and reveals an unclear distinction between them [9].
Contemporarily urbanization is taking place all over the globe but the rate is very fast in the developing countries as compared to the developed ones. In 1800 AD, only 3% of the world’s population lived in urban centres but this figure reached to 14% in 1900 and presently 50% of the world’s population is living in urban areas. The population growth in the cities is an unavoidable phenomenon. But cities with rapid growth (mostly in developing countries) grow without planning and relationship between urban form (the built environment) and nature generates an unending source of physical and environmental degradation [10]. During the past 50 years urban population in India has increased by more than six times [11]. Similarly, the population of the state of Jammu and Kashmir has also increased. Srinagar city, the study area, which is also the summer capital and the largest urban centre in the Jammu and Kashmir, also recorded 5 times increase in its urban population during the past 50 years [12].
While studying the changes brought down by the growing population, the environmental concerns of human population including climate change, biodiversity depletion and pollution of water, soil and air are taken in to consideration [13]. Understanding this urban systems and addressing questions regarding changes in the spatio temporal patterns of urban form are of paramount importance in urban research. Land use information can be used to develop solutions for natural resource management issues. Remote sensing, although challenged by the spatial and spectral heterogeneity of urban environments, seems to be a suitable source of reliable information about the multiple facets of urban environment [14,15]. GIS can generate a two or three dimensional images of an area, using GIS images as models, making precise measurements, gathering data, and testing ideas with the help of computer [16].
The present study focuses the rate and pattern of land use/land cover change for 1980 and 2010 in Srinagar city using remote sensing and GIS techniques. The study further evaluates the land transformation during the study period.
2. Study Area
The present study is done on Srinagar city which lies between 33˚59'14''N and 34˚12'37''N latitude and 74˚41'06''E and 74˚57'27''E longitude. The city is located on both sides of the River Jhelum, locally called Vyeth in Kashmir (Figure 1), spreads between the plains of vale of Kashmir. It represents one of the, ecologically fragile, economically developing, tectonically unstable and one of the densely populated mountain ecosystems on the planet.
The general relief of the study area is 1580 m above mean sea level. The general terrain is moderate and represents hill topography. From time to time, the city was ruled by various rulers, belonging to different religions, regions and dynasties, shaping its land use according to their desires. Mughals in the 16th century designed the city as per their requirements and its imprints are found today also.
Presently, it is summer capital of the state of Jammu and Kashmir and has grown with time and gained primacy in terms of functions associated with politics, administration, commerce, economic development and tourism etc. The population of Srinagar city in 1951 was 255,679 which increased up to 952,324 in 2001, recording a growth of +51.06 per cent (the provisional population for 2011 is about 1.25 million). With the onset of urbanization, the city witnessed economic development changing its land use pattern.
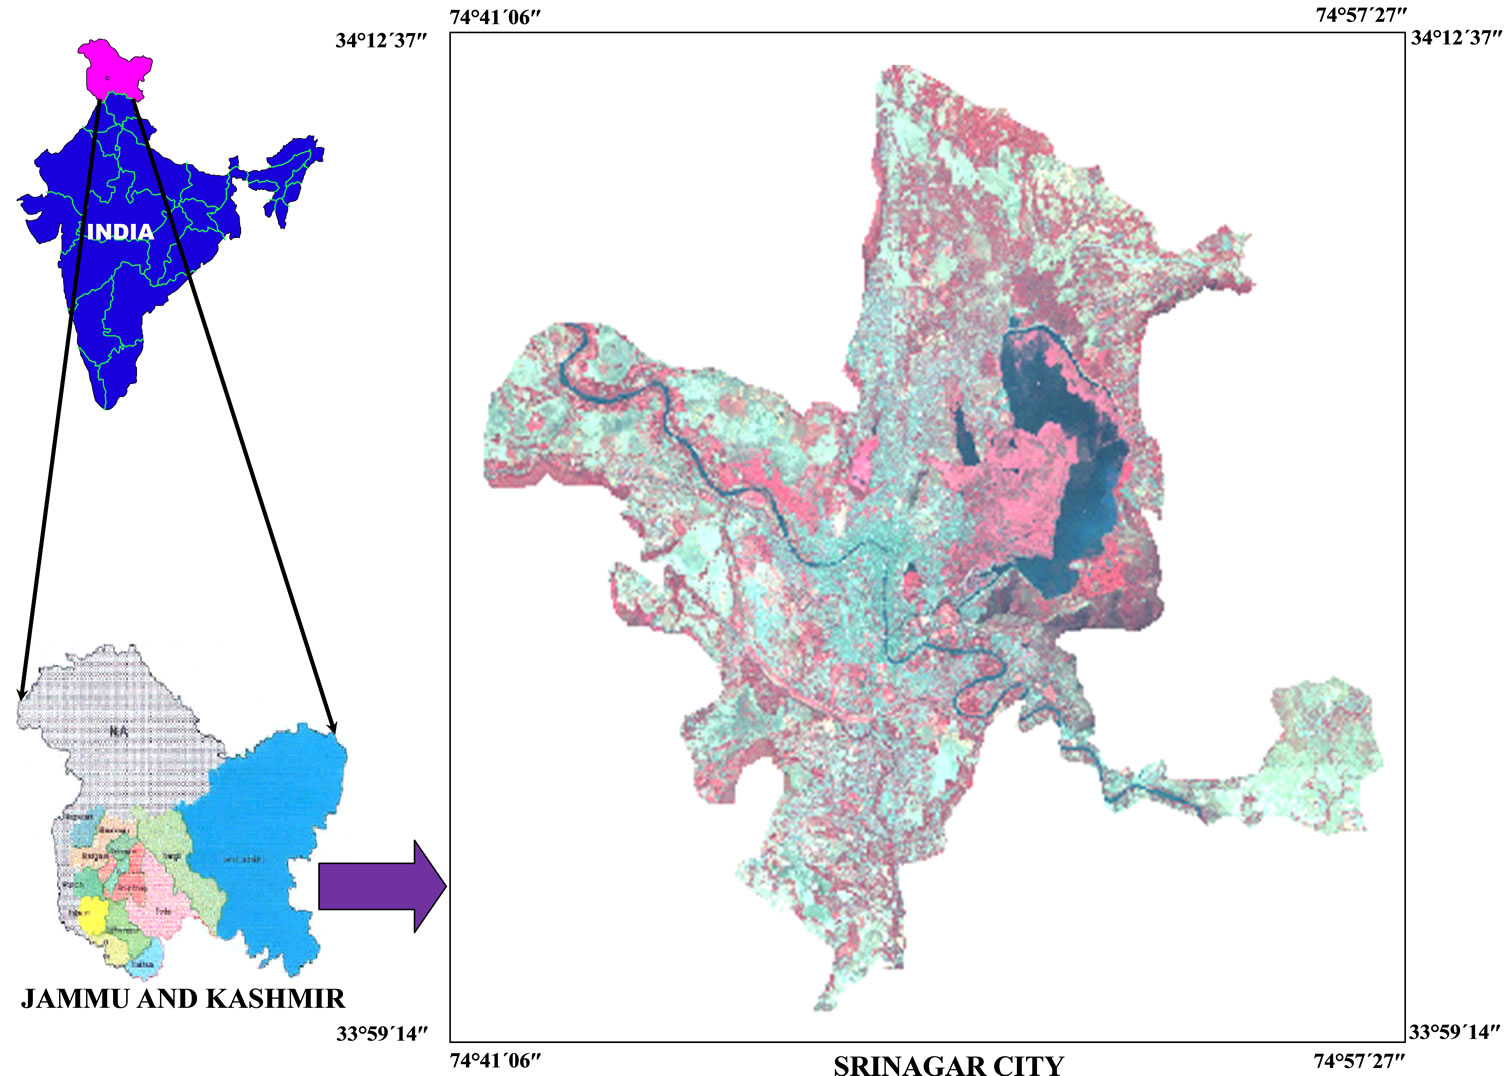
Figure 1. Location map of Srinagar city.
3. Data and Methods
The study is mainly based on secondary sources of data, the data used for the preparation of Land use/land cover of the study area is Town planning map of Srinagar city 1980 on 1:15,000 scale. Similarly, the land use/land cover for the later date was carried out using IRS-1D LISS III + PAN 2010 merged satellite imagery (Table 1).
Both the images were first geo-corrected and geo-referenced in Earth Resource Data Analysis System (ERDAS) Imagine 9.0 software, assigning Universal Transverse Mercator with World Geocoded system (UTM WGS 84) projection parameters. Further for assistance in the process of interpretation SOI toposheet was also georeferenced and was given similar projection and datum. The area of interest (Municipal limits of Srinagar city) was extracted by sub-setting of the town planning map. Satellite imagery was stacked into different bands to produce a false color composite; the area of interest was extracted by sub-setting of the image. These images were digitized in GIS environment using ArcGIS 9.3 and ArcView 3.2a software in the form of polygons representing different land use land cover categories. The data was classified into 9 land use/land cover classes spread over a total area of 234.46 Km2 of the Srinagar city (which incidentally is also the Municipal limits). The trend and pattern of urban expansion was calculated and every polygon representing the particular class was quantified and displayed in respective maps. It was followed by superimposing of two time period land use/cover maps to carry out land transformation analysis.
Statistical Analysis and Test
Statistical test i.e., a paired t-test was applied in this research work to study the relationship between the land use/land cover situation between 1980 and 2010. This

Table 1. Details of satellite data used in the study.
t-test is a parametric test and it is used to find the difference between two sets of data.
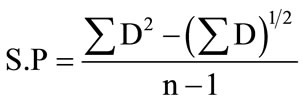
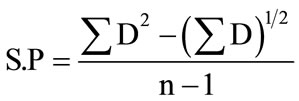
Using this formula; 
where
where t = Critical point;
D = Difference between the two sets of data;
S.P = Variance of the sum of the difference;
n = Number of observations.
4. Results and Discussion
Remote sensing and GIS techniques were used for the present study as these sources are found to be an appropriate source of urban data to investigate such studies [16,17].
The analysis of these two date data enabled to map total 9 land use/land cover classes spread over 234.46 Km2 of study area (which is the local area). These classes include, Built-up, Parks/Gardens & Playgrounds, Vacant, Agriculture, Plantation/Orchards, Forest, Barren, Marshy and Water body (Figures 2 and 3). The statistics derived of different land use/cover classes is given in Tables 2 and 3 and their detailed explanation is as follows:
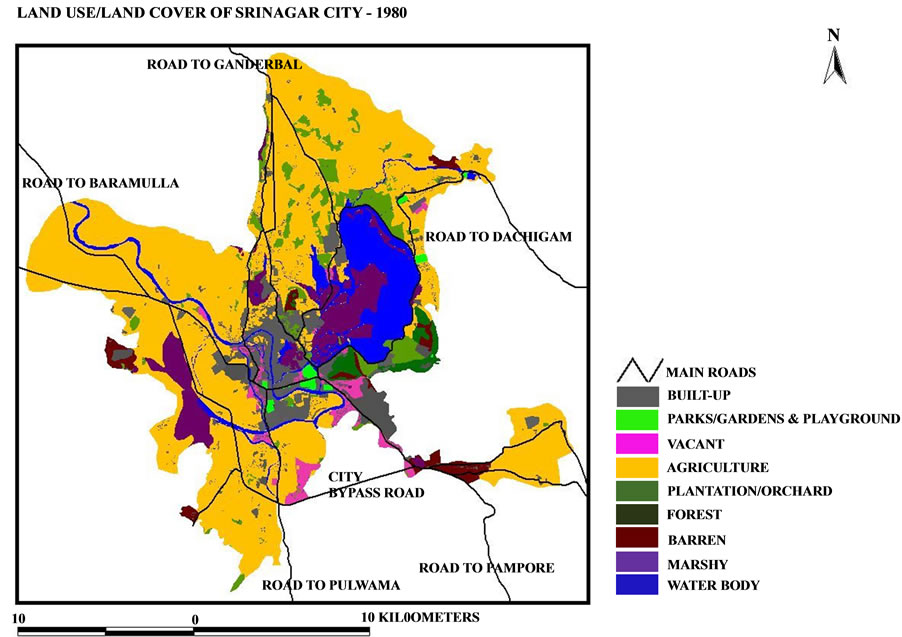
Figure 2. Land Use/Land Cover of Srinagar city-1980.
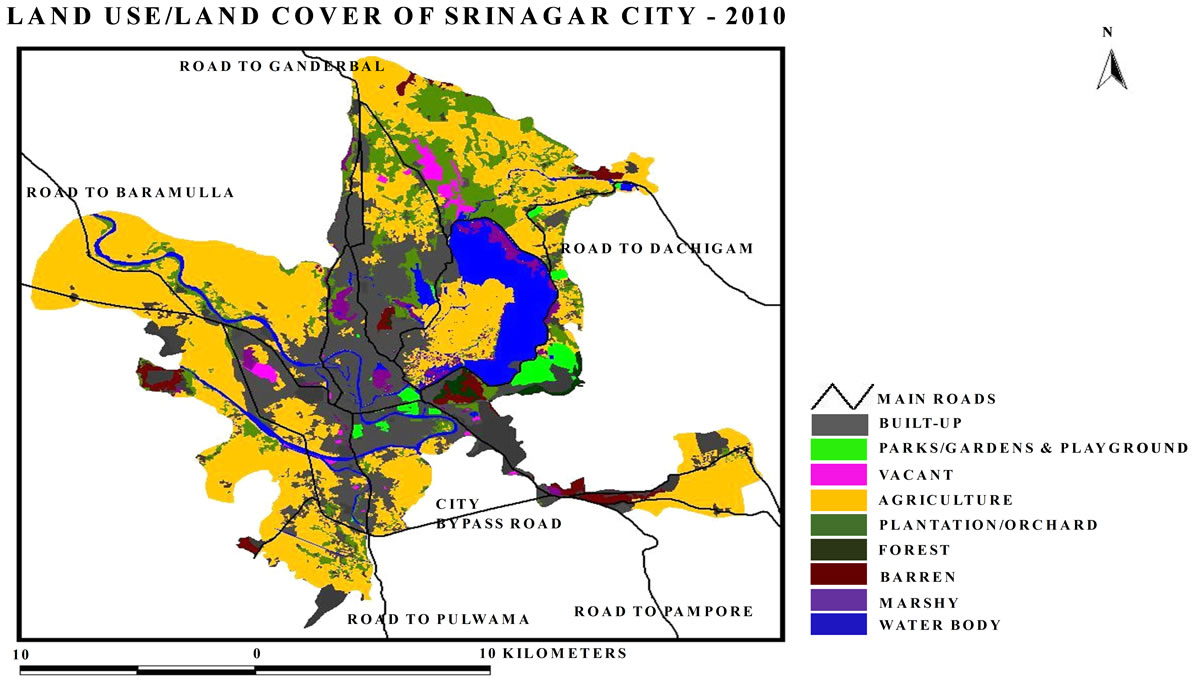
Figure 3. Land use/land cover of Srinagar city-2010.
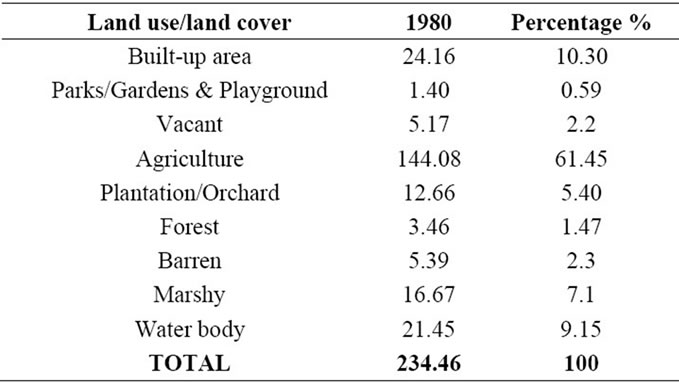
Table 2. Land use/land cover of 1980.
Built-up area: In the present study, built-up classes include residential, scattered settlement, commercial, industrial, restricted, educational, governmental, hospital and religious categories. Built-up area has increased from 24.16 Km2 (10.30% of the total area) in 1980 to 62.51 Km2 (26.66% of the total study area) in 2010 (increase of 158 percent). The general trend of settlement distribution was observed in north and south direction only because the area lying to its east is occupied by water body and western part was mostly marshy area (Figure 4). The expansion of the built-up area has swallowed significant proportion of agricultural and forest land as well as water bodies and marshy areas (Figure 5).
Parks/Gardens & Play grounds: This category includes various parks/gardens and playgrounds which are the areas of recreational activities and they form an important part of the city’s culture. In the year 1980 total land area under this class was 1.40 Km2 (0.59% of the total study area) which increased to 3.72 Km2 (1.59% of the total study area) in 2010. Despite decrease in non built-up area the total area under this class has increased by 2.32 Km2.
Vacant: Vacant land includes the land belonging mostly to locals who have left crop cultivation, most of which is speculative land holding. This class also includes the abandoned government land. In the year 1980, the total land area under this category was 5.17 Km2 (2.2% of the total study area), which decreased to 2.55 Km2 (1.08% of the total study area) in 2010 (i.e., decreased by 2.62 hectares).
Agriculture: Agricultural class includes mostly Paddy land, Floating/vegetable gardens (Radh) and Saffron Karewa fields. In the year 1980 the total area under agricultural land use was 144.08 Km2 (61.45% of the total study area) which decreased to 109.49 Km2 (46.7% of the total study area) in 2010. Therefore 34.59 Km2 of agricultural land has been lost during the period of 30 years in the study area.
Plantation/Orchard: This class includes Willow plantation, Apple, Cherry, Almond, Walnut orchards, distributed all over city except the core area. In the year 1980 the total area under this class was 12.66 Km2 (5.40% of the total study area) which increased to 26.22 hectares (11.18% of the total study area) in 2010. This class has increased by 13.55 Km2 during the study period.
Forest: Forest class includes the vegetation cover in the hilly areas of the city. In the year 1980, the total area under this class was 3.46 Km2 (1.47% of the total study area) which decreased to 1.53 Km2 (0.65% of the total study area) in 2010, decreased by 1.93 Km2.
Barren: Barren class includes the bare exposed rocks, along with some quarrying sites. In the year 1980 the total area under this class was 5.39 Km2 (2.3% of the total study area) which decreased to 4.80 Km2 (2.05% of the total study area), losing 5.9 Km2.
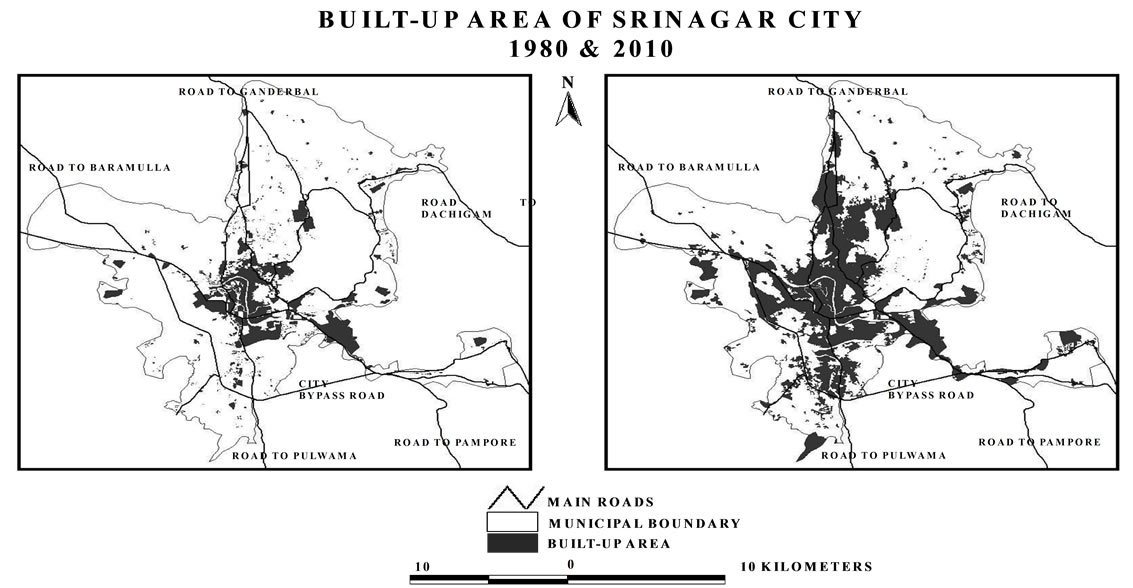
Figure 4. Built-up area of Srinagar city 1980 & 2010.

Figure 5. Non built-up area of Srinagar city 1980 & 2010.

Table 3. Land use/land cover of 2010.
Marshy: Marshy class includes the wet lands in and around the water bodies of the city. In the year 1980 the total area under this category was 16.67 Km2 (7.1% of the total study area) which decreased to 4.68 Km2 (2% of the total study area) in 2010. Among all the land use/land cover classes, marshy class is the prominent victim of urban expansion in Srinagar city, losing 11.98 Km2 during the study period.
Water body: Water body includes the rivers, lakes and water reservoirs of the city. In the year 1980, the total area mapped under this category was 21.45 Km2 (9.15% of the total study area) which decreased to 18.95 Km2 (8.08% of the total study area) in 2010. The anthropogenic pressure over the water bodies have resulted in decrease of more than 2.50 Km2 during the study period.
Statistical Results
Table 4 was computed to obtain (∑D); the summation of the differences between two sets of data (∑D2); square the summation of the differences between the two sets of data which will be used in calculating to determine the calculated t.
Calculations: (Substituting into the formula where n = 2 (1980 and 2010).
∑D = 108.44
∑D2 = 3017.123
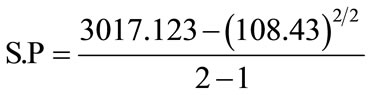
S.P = 2908.69 Therefore the calculated t = 2908.69 Using the tableThe degree of freedom = n – k where n= Number of observations k = Number of variables Hence, n = 2 And k = 1 The degree of freedom = 2 – 1 = 1 Using 1% significant level Therefore, 1/100 ÷ 2 = 0.005 Using the table with degree of freedom which is = 1 and checking at 0.005 significant level.
The tabulated = 63.66 Therefore calculated t (2908.69) is > tabulated t (63.66), hence we reject the null hypothesis, since calculated value (of t) is more than the tabulated or critical value of t. Therefore, in the result interpretation it is concluded that there is significant change in land use/land cover pattern between 1980 and 2010.
5. Land Transformation
Land Transformation is the process where changes in land use/cover are observed at different time periods and
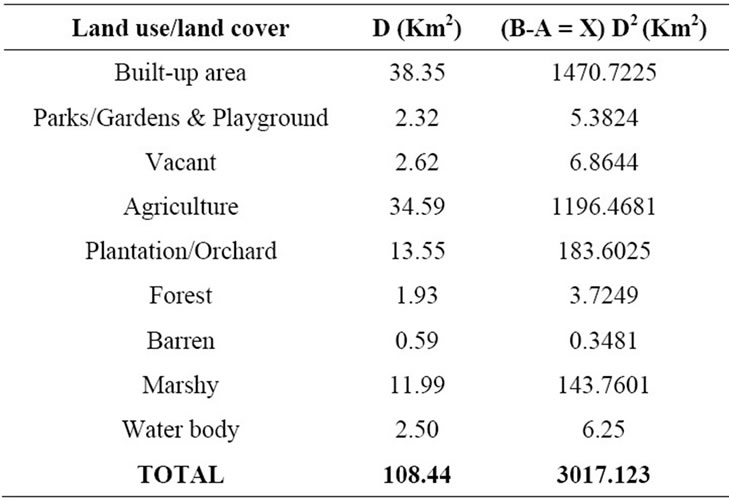
Table 4. Computed statistics for land use/land cover 1980 & 2010.
it is one of the important fields of human induced environmental transformation. Land is in a continuous state of transformation as a result of various natural and manmade processes. Apart from land use/cover change, Srinagar city experienced significant interchange of land between different classes during the study period which is because of economic and social transformation leading to the land transformations.
Table 5, and Figure 6, shows the interchange of various land use classes of the city. The development and expansion of the city has led to increase in demand for various built up land e.g., residential, commercial, industrial etc., purposes.
Significant land transformation was witnessed among built-up area, vacant, plantation/orchards, agriculture and water bodies/marshy lands. Built-up area increased by 38.35 Km2, capturing land mainly from agriculture, vacant, plantation/orchards and marshy area. Parks/Gardens and play grounds increased by 2.32 Km2, gaining area from plantation and forest area. Plantation/orchards land lost 6.89 Km2, this loss was gain for built-up, parks and orchards, and vacant area. Vacant lost its 2.62 Km2 to builtup area for residential and commercial development and also for agriculture and horticulture area expansion. Agriculture lost 34.69 Km2 of land for residential, comercial, industrial, recreational (parks and gardens) and horticulture (plantation/orchards) developments. Marshy area and water bodies lost 14.49 Km2 area mainly to agriculture, plantation/orchards, residential and governmental land use.
6. Causes of Land Use/Cover Change and Transformation
There are two fundamental steps in any study of land use change i.e., detecting change in landscape, and attributeing that change to some set of causal factors. Table 6 shows increases and decreases in different land use/cover classes between 1980 and 2010.
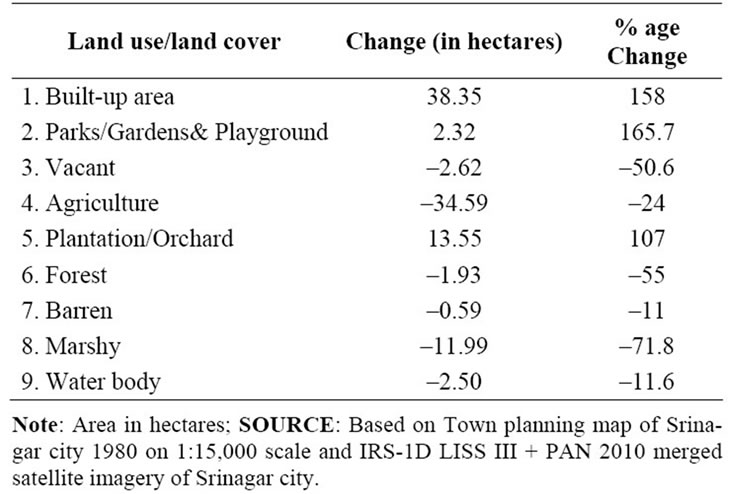
Table 5. Land use/land cover changes 1980 and 2010.

Figure 6. Land transformation in Srinagar city 1980-2010.
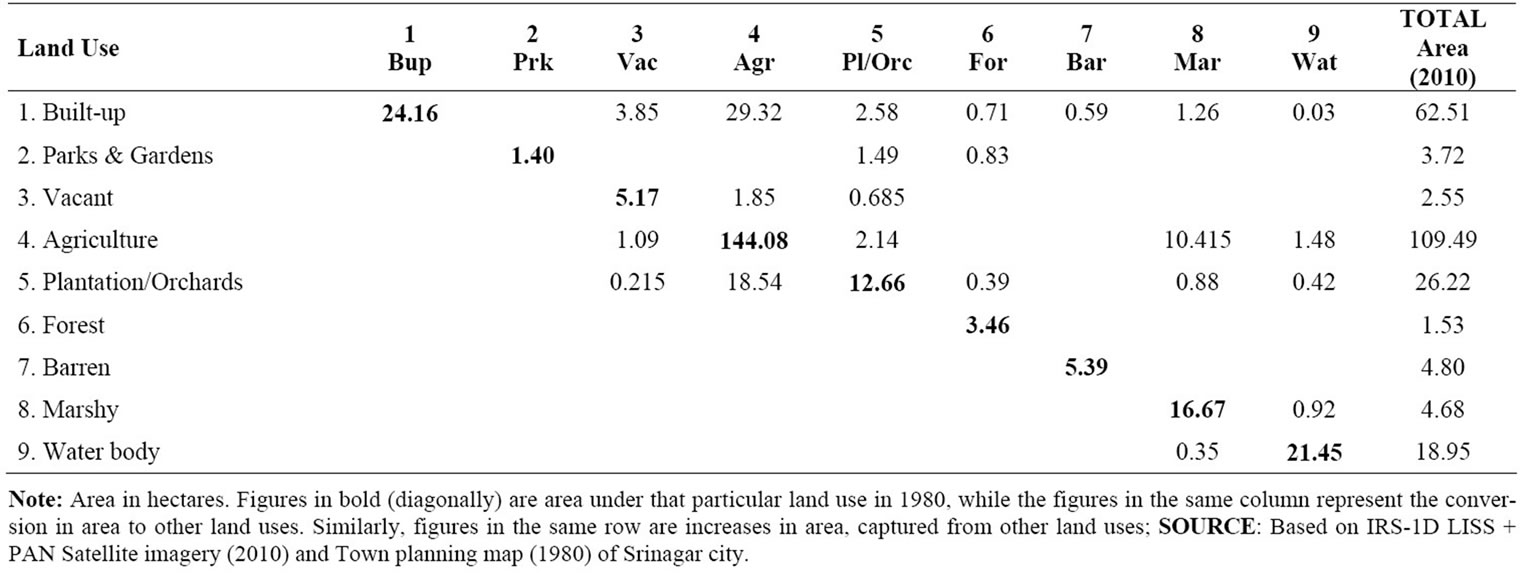
Table 6. Srinagar city: land transformation (1980-2010).
The increase in built up area is attributed to the increasing population due to natural increase and in-migration from the adjoining districts to the city, mostly from north and south and the development made in secondary and tertiary sectors resulting into increase in residential, commercial infrastructural development. The city development has also witnessed increase in the increase in the area under parks/gardens as the city is an important tourist destination.
The area under vacant land decreased because of increasing population pressure in the core area compelling rich people to move to these vacant lands. This has resulted into the emergence of residential colonies in the outskirts of the city.
Agricultural area decreased because of occupational shift of farmers from primary to secondary and tertiary activities. The shift from crop cultivation to horticulture activities have also contributed to the decrease of total land area under agriculture.
The area under plantation/orchard increased because of two reasons; firstly, farmers shifted from the traditional crop cultivation to the horticulture activities i.e., production of timber and various fruits like Apple, Cherry, Almonds, Apricot, Walnut etc., which was more remunerative than the traditional food crop cultivation. Secondly, the annual threat of floods in the low lying areaforced the farmers to opt for horticulture activities.
The demand for land has also consumed forest cover, marshy areas and water bodies. It is an alarming environmental issue where government regulations are commonly violated.
7. Conclusions
The above analysis suggests that Srinagar city witnessed rapid and large scale land use/cover changes and transformation during the study period of 30 years (1980- 2010). This change was tested using paired t-test at 0.01% significance level. The calculated “t” value was found to be more than the tabulated value which validates the significant changes in land use/land cover during the study period. The change was attributed to the increase in urban population during the study period along with socio-economic transformation in the city.
The expansion led to interchange of land, swallowing the fertile agricultural land in its fringe area, where industrial and residential expansion is taking place. The increasing population led to the decrease in per capita land availability resulting into increasing land value and shortage of land. This situation has accelerated the rate of urban expansion and land transformation and the process is still continuing.
REFERENCES
- UNEP, “Land Degradation,” State of the Environment in Bangladesh, 2001.
- B.L. Turner II, D. Skole, S. Sanderson, G. Fischer, L. Fresco and R. Leemans, “Land Use and Land Cover Change,” Science/Research Plan, IGBP Report No. 35, HDP Report No. 7, IGBP and HDP, Stockholm and Geneva, 1995, pp. 20-25.
- FAO/UNEP, “Negotiating a Sustainable Future for Land,” Structural and Institutional Guidelines for Land Resources Management in the 21st Century, FAO/UNEP, Rome, 1997.
- W. B. Meyer and B. L. Turner II, (Eds.), “Changes in Land Use and Land Cover: A Global Perspective,” The Press Syndicate of University of Cambridge, UK, 1994.
- W. B. Meyer and B. L. Turner, “Human Population Growth and Land Use/Cover Change,” Annual Review of Ecology and Systematics, Vol. 23, 1992, pp. 39-61. doi:10.1146/annurev.es.23.110192.000351
- P. M. Vitousek, H. A. Mooney, J. Lubchenco and J. M. Melillo, “Human Domination of Earth’s Ecosystems,” Science, Vol. 277, No. 5325, 1997, pp. 494-499. doi:10.1126/science.277.5325.494
- J. A. Foley, R. DeFries, G. P. Asner, C. Barford, G. Bonan, S. R. Carpenter, F. S. Chapin, M. T. Coe, G. C. Daily, H. K. Gibbs, J. H. Helkowski, T. Holloway, E. A. Howard, C. J. Kucharik, C. Monfreda, J. A. Patz, I. C. Prentice, N. Ramankutty and P. K. Snyder, “Global Consequences of Land Use,” Science, Vol. 309, No. 5734, 2005, pp. 570-574. doi:10.1126/science.1111772
- T. M. Burley, “Land Use or Land Utilization?” Professional Geographer, Vol. 13, No. 6, 1961, pp. 18-20. doi:10.1111/j.0033-0124.1961.136_18.x
- J. R. Anderson, E. E. Hardy, J. T. Roach and R. E. Witmer, “A Land Use and Land Cover Classification System for Use with Remote Sensor Data,” A Revision of The land Use Classification system as Presented in US Geological Survey Circular 671, United States Government Printing Office, Washington, 1977.
- S. Fazal and A. Amin, “Impact of Urban Land Transformation on Water Bodies in Srinagar City, India,” Journal of Environmental Protection, Vol. 2, No. 2, 2011, pp. 142- 153.
- United Nations, “World Urbanization Prospectus: The 2007 Revision,” United Nations, New York, 2007.
- Census of India, 2011.
- E. Erle and R. Pontius, “Land-Use and Land-Cover Change,” In: J. Cutler, Ed., Encyclopaedia of Earth, Cleveland, Washington DC, Environmental Information Coalition, National Council for Science and the Environment, 2007, Last Retrieved 19 January 2008. http://www.eoearth.org/article/Land-use_and_land-cover_change.
- J. R. Jenson and D. C. Cowen, “Remote Sensing of Urban/Suburban Infrastructure and Socio-Economic Attributes,” Photogrammetric Engineering and Remote Sensing, Vol. 65, No. 5, 1999, pp. 611-622.
- M. Herold, N. Goldstein and K. Clarke, “The Spatiotemporal form of Urban Growth: Measurement, Analysis and Modeling,” Remote sensing of Environment, Vol. 86, No. 3, 2003, pp. 286-302. doi:10.1016/S0034-4257(03)00075-0
- D. N. Michael, “Fundamentals of GIS,” 3rd Edition, Printed in the USA, 2005.
- M. Herold, D. Roberts, M. Gardner and P. Dennison, “Spectrometry for Urban Area Remote Sensing—Development and Analysis of a Spectral Library from 350 to 2400 nm,” Remote Sensing of Environment, Vol. 91, No. 3-4, 2004, pp. 304-319. doi:10.1016/j.rse.2004.02.013